I understand that the British University in Dubai may make a digital copy available in an institutional repository. Last but not least, I would like to take this opportunity to thank all the staff members at Victoria International School who have been so helpful and kind to me.
INTRODUCTION
Background of the Study
- Lighting Significance in classroom
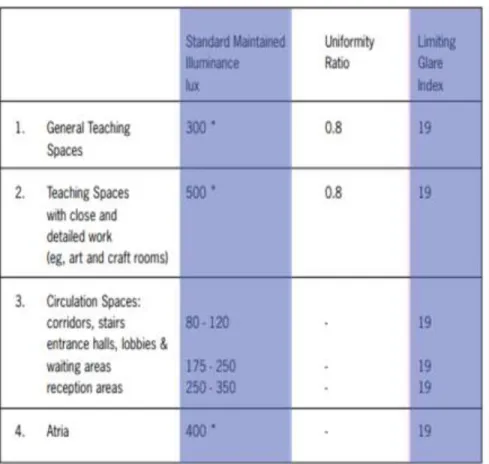
- Required lighting levels in classroom
- Lighting Quality
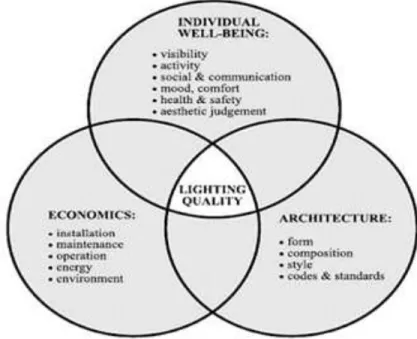
To improve the understanding of light quality, agreement must be reached on a method that can objectively determine light quality. IN Figure 3, published by (Samanji, 2012) highlights the various elements that are integral to the overall effects of lighting quality.
Aims & Objectives
A particular example that highlights this is a study published by (Hamner, Bierman, Figueiro and Rea, 2011) where observers perceived a light environment where the color was almost blue. As a result, when designing an appropriate indoor lighting environment, it is necessary to accurately predict the color perception of a space and pay attention to the possible effects on an observer.
Scope of the Study
Moreover, the findings will also be useful to other research students who are interested in doing further research on the topic in the future. It would be helpful if they could show that the environment is a factor in the learning process.
Research Delimitation and limitation
This is similarly supported by (Blair, 1998) who states that there is a significant correlation between the standard of the school facility and the student's learning process. While the effect of the family's socio-economic status on the child's learning may be insignificant, the level of education the parents have achieved plays a significant role.
Dissertation Outline
Overview
Daylight Theory
- Daylight factor and illuminance level
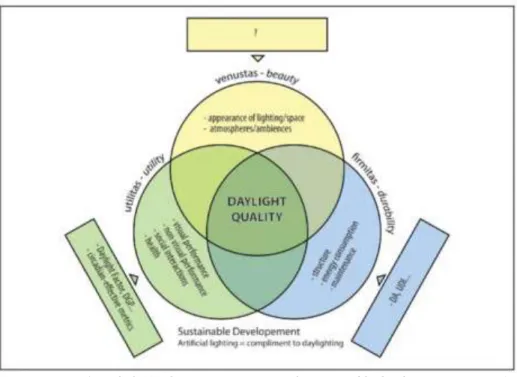
There are other factors that can affect the quality of daylight, apart from the amount of daylight, and Figure 10 shows the design process for daylight quality in a sustainable development context. Studies of daylight tended to focus mostly on the amount of daylight in the past, but today the amount of daylight is considered a good measure of daylight quality (Jovanovic, et al., 2014).
Daylight Effects
- Daylight effects on human circadian Rhythm
- Daylight and student performance
According to (Figuero and Rea, 2010), eye fatigue due to visual discomfort is one of the factors that lead to loss of concentration (Ibrahim & Ahmad, 2013). Students' performance is reduced when they do not get the appropriate visual comfort for the necessary learning tasks (Gilavand, et al., 2016).
Color Rendering Index
According to (Hathaway, 1995), sunlight is noted as the reference point for CRI and it has an index of 100. Sunlight is 100 CRI as it combines all the colors (red, orange, yellow, green, blue, indigo and violet) in the spectrum, and the intensity of the object's color when sunlight is reflected from it just shows the true intensity of the object's color.
Visual discomfort factors
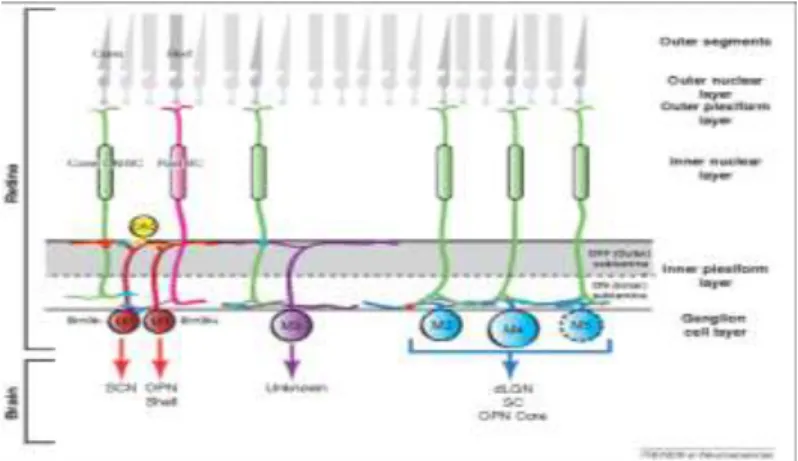
- Intrinsically Photosensitive Retinal Ganglion Cells (ipRGCs)
- Flicker and Glare
- Other health risks due to lighting
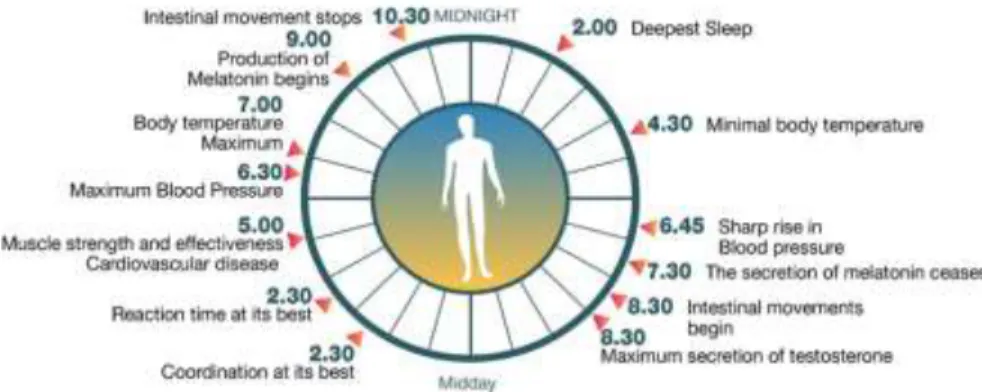
This master body clock, or circadian clock, can be found in the hypothalamus of the brain's suprachiasmatic nuclei (Czeisler, 2013), which controls metabolic processes, hormone secretion, body temperature, cardiovascular function and aging processes (Anna and Roman Kondratove, 2012). According to (Wilkins, Veitch and Lehman, 2010), the human retina is capable of detecting flicker in the 100-200 Hz range.
Research Question
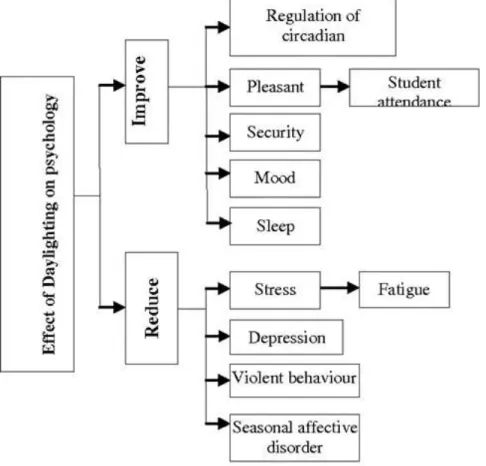
Nadakuduti, Douglas, Capstick, Kuhn, Benkler, & Kuster, 2010), it can be concluded that the typical light sources, such as fluorescent and LED lamps, generate electromagnetic fields that are significantly below the limits recommended by the International Commission on Non -ionization. Radiation protection as found in (ICNIRP Guidelines, 2013). In summary, an overview of both the improving and harmful effects of daylight on health can be found in Figure 15. Through the use of appropriate techniques and methodologies, we aim to provide an adequate answer to the research question.
In particular, the research question will aim to study how lighting in schools in the United Arab Emirates affects student health and performance.
Dissertation Hypothesis
Therefore, the purpose of this experiment is to determine the effects of lighting with different colors on the productivity of users, in order to demonstrate how lighting affects work performance, thus suggesting a lighting scheme that will lead to less pollution, better productivity and a scheme that is environmental. friendly. Researchers have found that lighting interventions in the built environment can affect human behavior and performance to a significant degree. However, it is important to note that controlling for some classroom variables may be difficult and may inadvertently influence the results, potentially leading to different conclusions.
The purpose of this study is to raise awareness of the need for classroom design, particularly in primary schools in the United Arab Emirates, as requested by the Classroom Design Committee.
Similar studies - different methods
- An Overview of the Theory
- Sociological Survey
- Simulation
- Observational
- Experimental
Below is a description of classroom lighting design (artificial lighting) designed to ensure that students and teachers in the classroom are comfortable and that their performance is enhanced by combining high quality daylight and artificial light in a planned way (simulating the results). At the conclusion of the study, further research into the relationship between daylight (bright light) and productivity is recommended (Figueiro et al, 2002). Based on the analysis, key performance indicators were used to assess the efficiency and effectiveness of the school.
It will improve the researcher's knowledge of the effect of lighting on students in classrooms.
Research Method of the Study
- The Methodology Framework
- Duration of the study
- Geographic location of the study
- An overview of the study's environment
- Lighting
- Data collection methods
- Observing the Environment
- Students’ Grades and Data
- Resources required
Moreover, there was no sampling bias in the field experiments and there was no bias in the analysis of the characteristics of the demand (Colorado State University, 2008). This is particularly important as there will be around 40 fixtures that will be tested over the course of the study. During the duration of the experiment the students will be able to sit in designated areas for consistency purposes (as this will affect the results as this is a variable that will be recorded).
The quality of education and children's health is directly linked to their participation.
The methods and tools of data analysis
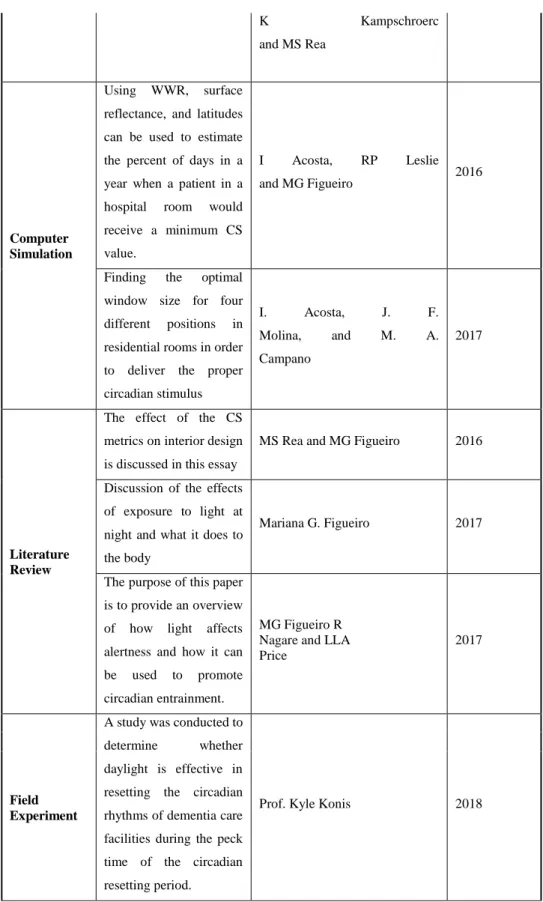
For a typical class space, it is necessary to determine the window size to obtain an appropriate CS value. The purpose of this study was to learn how effective ambient light can affect the alertness of office workers during the workday. The purpose of this paper is to provide an overview of how light affects alertness and how it can be used to promote circadian entrainment.
A study was conducted to determine whether daylight is effective in resetting the circadian rhythms of dementia care facilities during the pecking time of the circadian reset period.
Climate condition
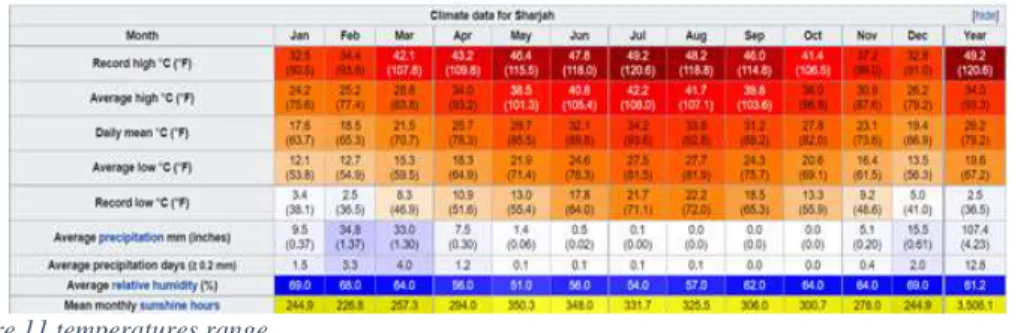
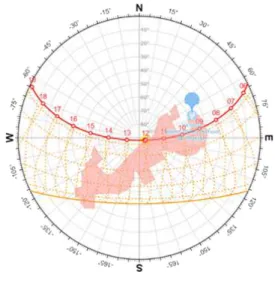
Figure 5 shows the average, maximum, minimum and extreme temperatures for the period 1984-2001 provided by Dubai International Airport (DIA) to the Department of Civil Aviation (DCA). The red dotted line indicates the average maximum temperature while the green dotted line indicates the average minimum temperature. In Figure 6, the green dotted line represents the average minimum and the orange line indicates the average humidity range over the course of each month.
Based on the graph, the average number of hours of sunshine per day is between 7 and 11.
Developing the experiment
Comparing the effects of sufficient daylight with those of full-spectrum, blue-filtered fluorescent lighting and LED lighting, this chapter presents descriptions and explanations of the findings according to the research questions of the study. Students will receive a grade report at the end of each semester following the completion of the evaluation process. Using key performance indicators as a benchmark, the results of the analyzes were used to measure the effectiveness and efficiency of the school.
During the course of the study, 55 children from three classes at Victoria International School's early learning center were recruited to participate in the study.

Observation of the Experimental Environment
- Site analysis
- Classroom’s interior and orientation
- Simulation for Lighting Study
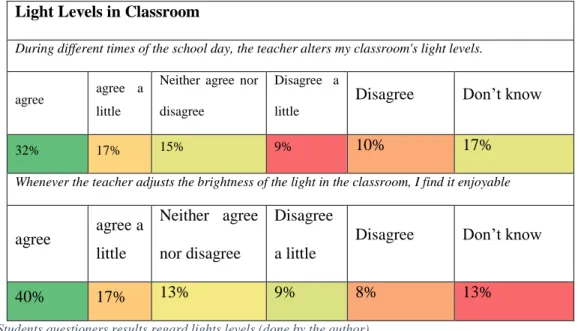
But that most of the respondents agreed (40%) and partially agreed (17%) that they like it when the light level in the classroom changes, see table 12. Every time the teacher adjusts the brightness of the light in the classroom. I think it is funny. Several of the lighting conditions had mixed effects on moods or feelings of calm/excited (3500K) and sleepy/awake (6000K).
Further research and other methodologies are needed to gain a more comprehensive understanding of the effects of LED lighting versus fluorescent lighting in the classroom. A more in-depth analysis of the results is necessary to understand the results. At different times of the school day, my teacher changes the light level in my classroom.
Summery
Illumination and Activity
Children were asked to select their preferred picture to illustrate specific activities that could be performed under LED, fluorescent, and full-spectrum fluorescent lighting. Compared to the fluorescent image of 3500K and 5000K full spectrum fluorescent, the LED image of 6000K was more frequently chosen by participants for various tasks, including reading at their desk (58%), while for drawing and writing it was preferred by (64 %), and taking tests (54%).
Illumination and Emotion
A 3500K image showed an interesting contrast between feeling calm and feeling excited, with a relatively small percentage (24%) of respondents reporting feeling calm.
Illumination and Behavior
Light and Object Acuity
Illumination and Sounds
Illumination and flickering
In classrooms with 5000K, most students reported feeling alert and focused, while in classrooms with 3500K they felt more relaxed and safe. This question may not be an accurate representation of the effect of CCT on humans. The results of the study were mixed in terms of emotion detection, sound detection and blink detection.
The reason for this is that the participants come from different schools and their perception of the school has been self-reported by the students.
Appendix A: Questionnaire
Are there any other details you would like to share about the lighting in your classroom and how it affects your behavior and feelings. It seems like there are dots in front of my face when the lights come on My classroom has an excessive amount of light, and I don't like it.
Appendix B: Survey results