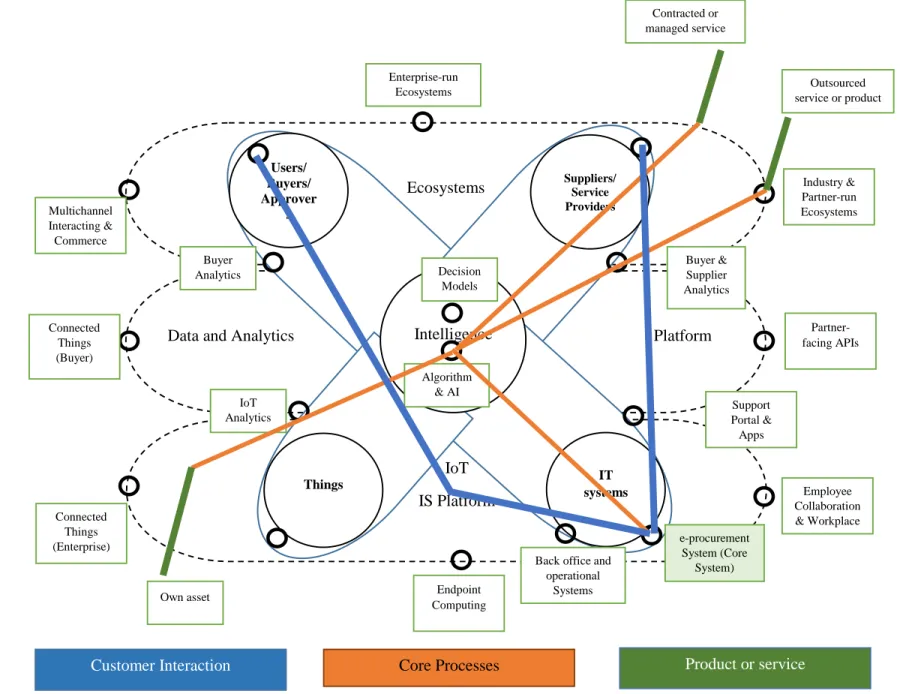
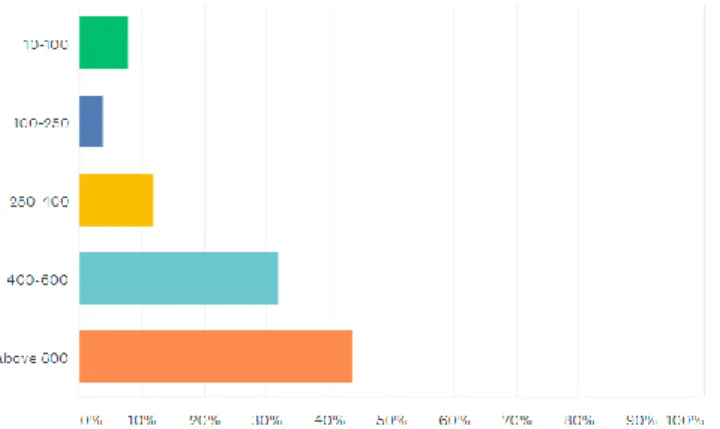
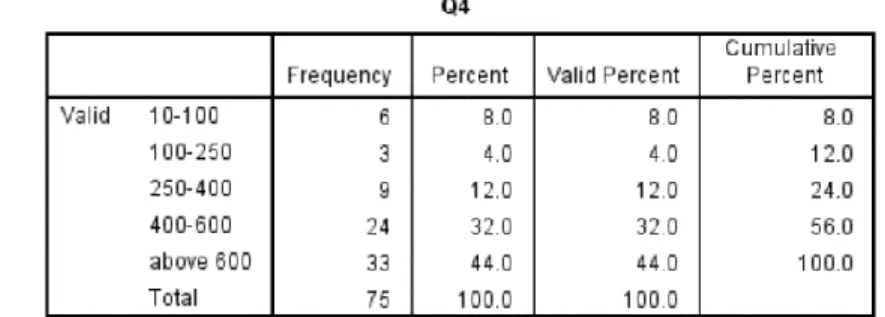
Fig.13: Expenditure overview of each property in UAE Fig.14: Expenditure by purchase type report. Fig.34: The proposed conceptual model for e-procurement in the hospitality industry Fig.35: Response of participants to question 4.
Problem Statement
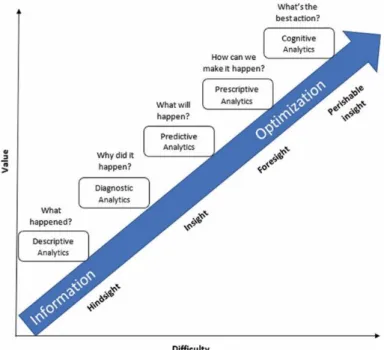
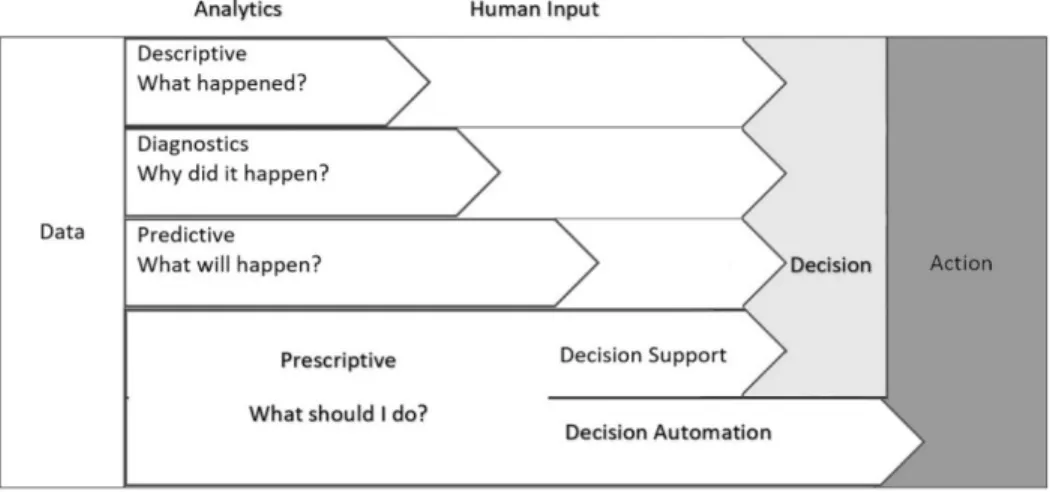
Mainstream business people are seriously thinking about incorporating the data analytics maturity model as it offers limitless possibilities of the commercial revolution and operating efficiency. 7. the use of data analysis maturity model and, finally 4) to identify the perception of an expert(s) about the results obtained.
My Contributions
Data analysis at the descriptive, diagnostic, predictive, prescriptive and cognitive levels is my second contribution. An ML algorithm for demand forecasting using LSTM time series forecasting is my fourth paper.
Significance of the Study
There are many stakeholders involved in the procurement process in the hospitality industry (Boris Evelson, 2018) and getting everyone's consent to use their data is a real challenge (McKinsey, 2018). The author proposes a new conceptual framework for the integration of AI and the use of ML in hospitality and e-ordering in particular.
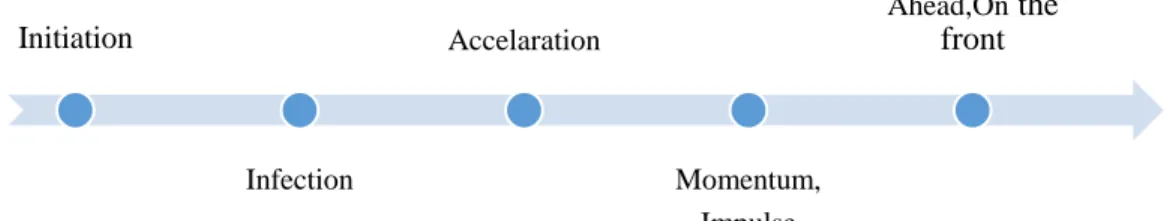
Theoretical Framework
The next phase is the infected stage where the managers are interested in the idea of data analysis and slowly start to develop models. The third phase is the acceleration stage where the organization uses data analytics for competitive advantages.
Research Aims and Objectives
For this study, the name of the hotel is called "The X Hotels"; real name and other non-disclosure details are confidential. Create a clear and precise framework on how to integrate a coherent value-added AI system into your chosen industry.
Research Questions
How Can Machine Learning Analytics (ML) Optimize Procurement Efficiency in the Hospitality Industry Using Deep Learning? . VQ 3) What is the perception of expert(s) about the proposed integrated system with AI and ML in e-procurement of the hospitality industry. As part of the qualitative method, intense document analysis and reviews are completed plus an interview/survey with an expert(s) in the relevant area about the results obtained.
Organisation of the Thesis
17 . RQ 2) How can the data analytics maturity model be adapted in e-procurement data from the hotel industry. The results from the survey and the interview of subject expert(s) perception of the results of this research are presented in the same chapter.
Integration of AI
Most of the data available has been created in the last few years, while the term "big data" has been around since 2005, coined by O'Reilly Media after it coined the term Web 2.0. Although adoption of the system is evident from the survey, to the best of this author's knowledge, very few papers have been published linking big data and artificial intelligence in hospitality e-ordering.
E-procurement in the Hospitality Industry
Benefits & Barriers of E-procurement
Yu, Yevu and Nani (2020) in their research cite the benefits of e-procurement such as supplier relationship control, convenience and accurate order fulfillment, improved efficiency in purchase order utility. The benefits of the perceived organizational performance of purchasing can be stated from several authors who seemed similar are listed here.
Quality of Data in E-procurement of Hospitality Industry
Data Analytics in the Hospitality Industry
These models are maintained in the data flow that affects the collaboration between guests and the organization. In this paper, the researcher focuses on the integration of BDBA and SCA to manage uncertainties in the organization.
Predictive Analytics in the Hospitality Industry
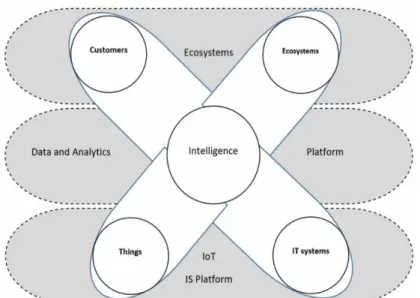
If the situation requires automation of the process, this is also possible with decision automation systems. The ecosystem can be clearly defined as the stakeholders in the organization that will interact with the business intelligence systems and are therefore a critical component of the platform.
Deep Learning and Machine Learning Techniques in E-procurement of the Hospitality
The hotel industry involves a wide range of stakeholders in the form of employees, suppliers, managers, dealers, customers, guests and so on. The hospitality industry is considered a highly connected and interoperable industry that makes use of all these collaborative systems.
Optimisation in e-procurement
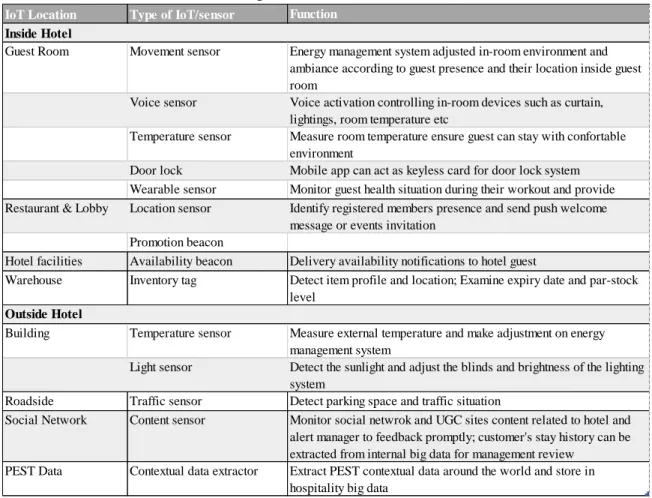
IoT in Hospitality
The history of the customer's stay can be obtained and can be used for analysis and predictions on preferences. Sensors can be used to examine the expiration date of food and beverage items and assist the chef in purchasing and consumption (Fan et al., 2014).
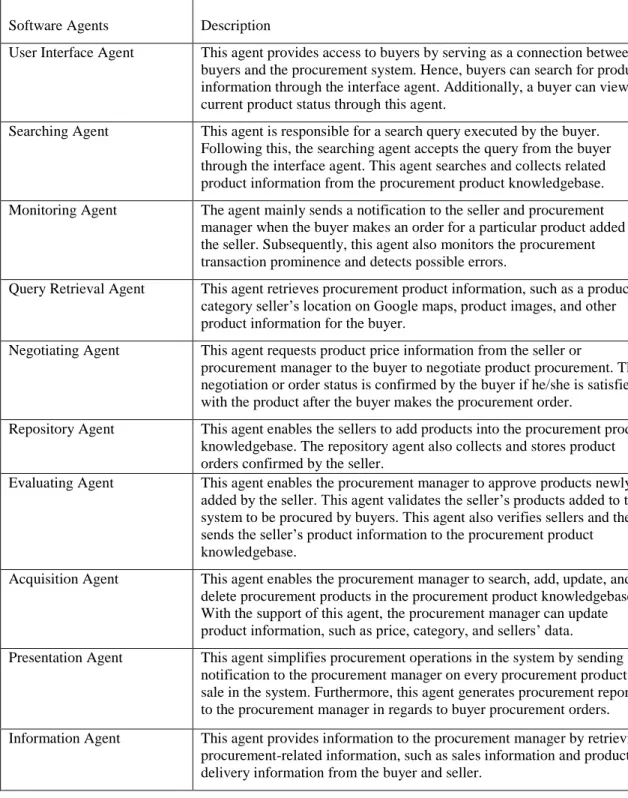
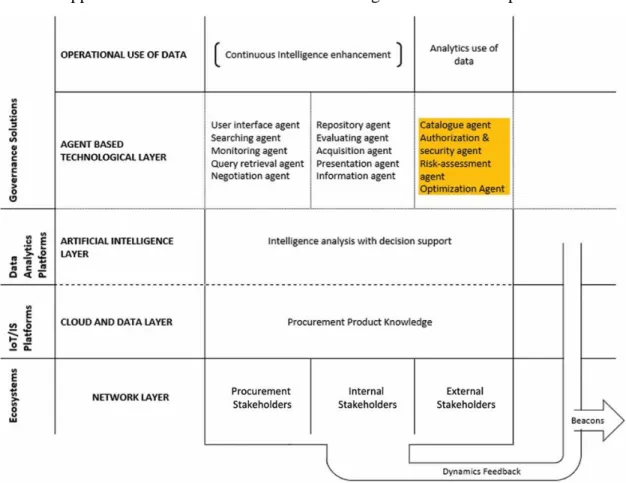
Agent-Based Technology (ABT) in the hospitality industry
Repository Agent This agent enables the vendors to add products to the procurement product knowledge base. Evaluating Agent This agent enables the procurement manager to approve products newly added by the vendor.
Ecosystem in Hospitality
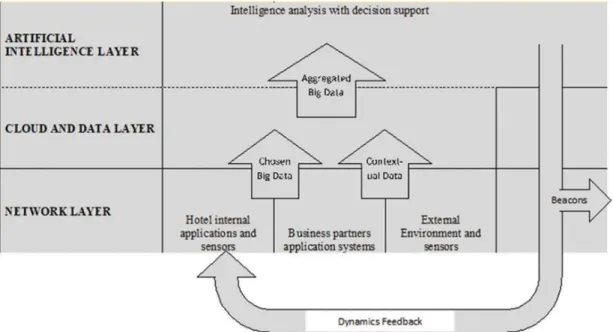
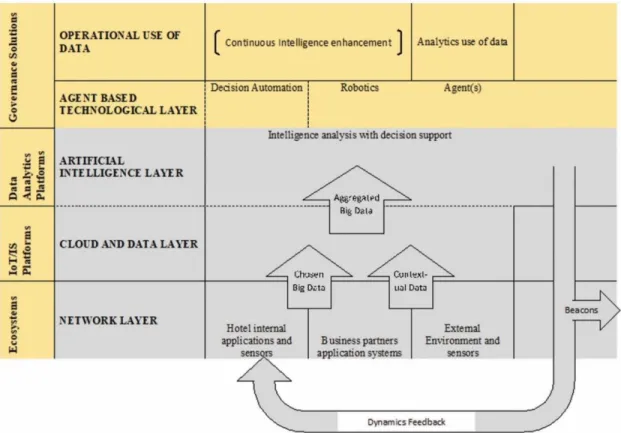
The framework proposed by Buhalis and Leung (2018) for a smart hospitality system is shown in Figure 7. The third layer is the AI layer that selects big data needed for intelligence analysis and decision making.
Gap in the literature
The initial framework for Predictive Analytics and AI Integration by International Research Organization is used as the backbone in my study. The data analysis, agent-based technology and the whole framework proposed in my study are made in a way to reform e-procurement in the hospitality industry.
Chapter Summary
While Buhalis and Leung talk about big data analytics, there is no clear roadmap on how to achieve the objective to make it compelling to stakeholders. There is no proposal for having state-of-the-art technology that combines data analytics maturity models, agents or multi-agents and integrates AI for full efficient and smooth functionality.
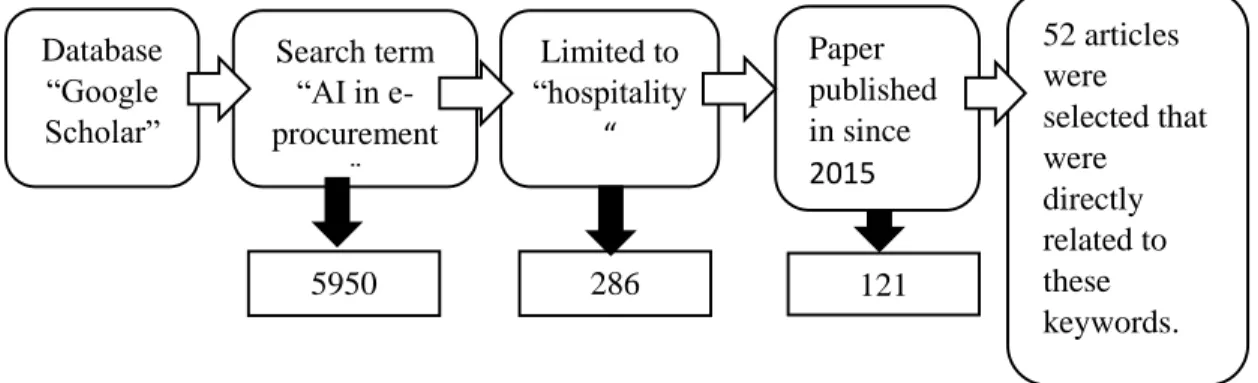
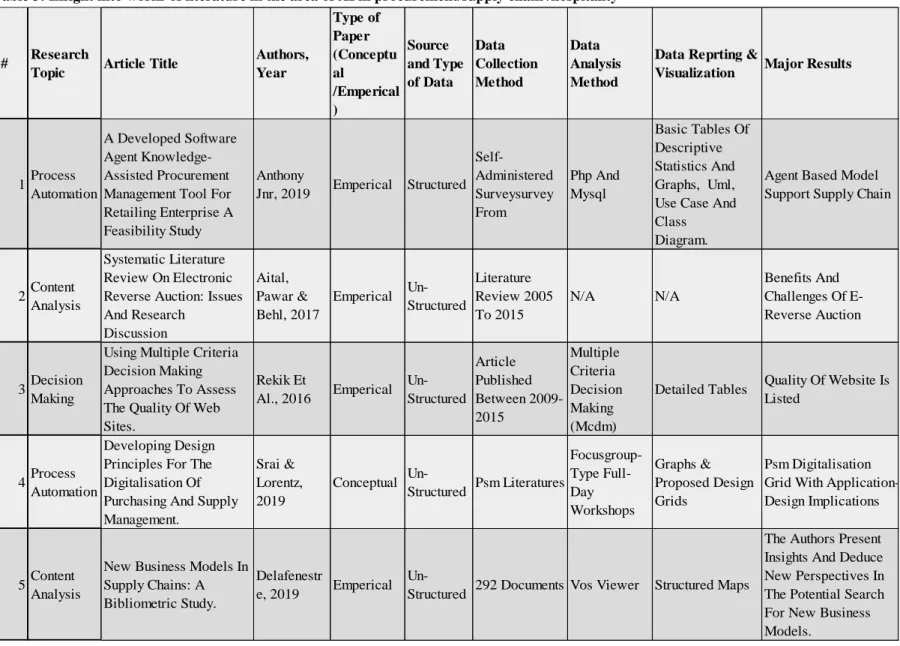
Structured Review
- Statistics of the trend in publishing
- Major areas of research
- Content analysis in the selected publications
- Comparing various studies in the field of AI /e-procurement/supply chain /hospitality
The study provided academia with a comprehensive review of the previous research on IAT benefits in food supply chain management. Few of the researchers have contributed to the research world on the supply chain performance framework.
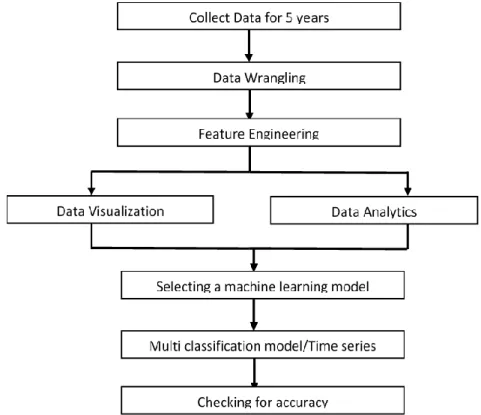
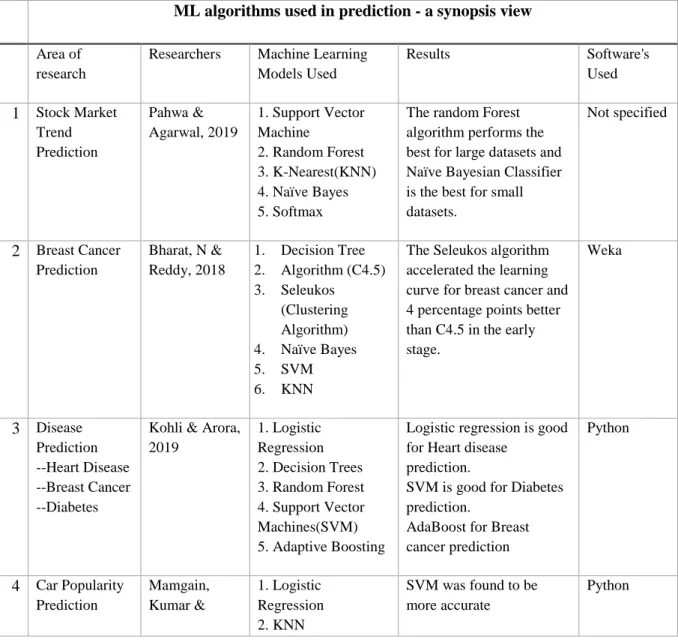
Machine Learning and Deep Learning used for Prediction and Forecasting
- A conceptual framework for applying machine learning and deep learning
- Classification algorithm selection
- Cross-Validation
- Fine Tuning the hyperparameters with GridSearch
- LSTM & RNN
The train_test_split function from scikit-learn's cross_validation module is used in the research. Moreover, the study also specified that the "epoch" number of training times has no effect on the performance of the trained forecast and it just shows an unsystematic behavior (Siami-Namini & Namin 2018).
Current Level of Adoption
In the same study, "Artificial Intelligence Trends: Decision Augmentation" (International Research Organization, 2020), barriers to adoption were explored, which are depicted in Figure 5. Although adoption has many benefits, most of the companies surveyed mentioned that acquiring skilled people were the biggest barrier.
Major Gaps in the Literature
Any concerns from members of the ecosystem may worsen their participation, and therefore a standardized communication protocol must be established. In the fast-paced and unpredictable business environment, it is very important to be proactive rather than reactive.
Chapter Summary
An Exploratory Case Study
Research Paradigm
The overview of the methodology explains the sampling strategy, data collection and analysis procedures, verification procedures and ethical considerations. The test subjects here are the different properties (hotels) of the same chain of the hotel brand.
Challenges Faced During Research
The research can be considered as a case study in a hotel chain, which will give an in-depth insight into the test subject.
Situating the Research
Exploring the Setting
This system is limited in reporting facilities, the Field Operations managers extract data from an Oracle database into an Excel sheet. Therefore, Field Operations Managers extract data from their database to create a monthly report, consumption records and so on.
Data Collection
Data analytics and forecasting take a longer part of the research, as the data needs to be organized and aligned with units and formats. The exploratory approach of data analytics allows the user to overcome the complications of treating individual properties as patterns.
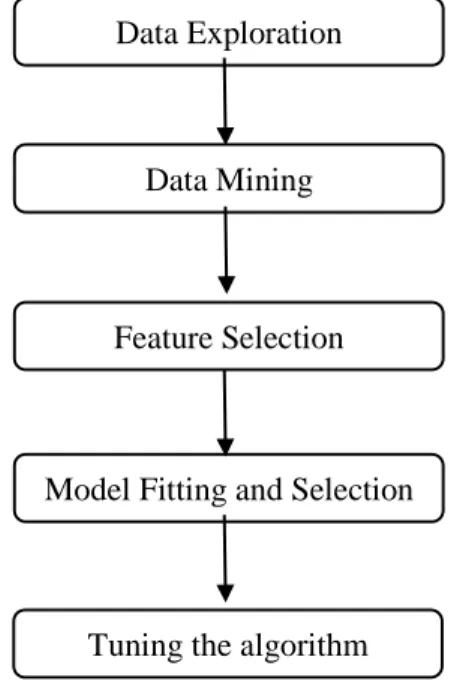
Proposed Method for Designing the Framework
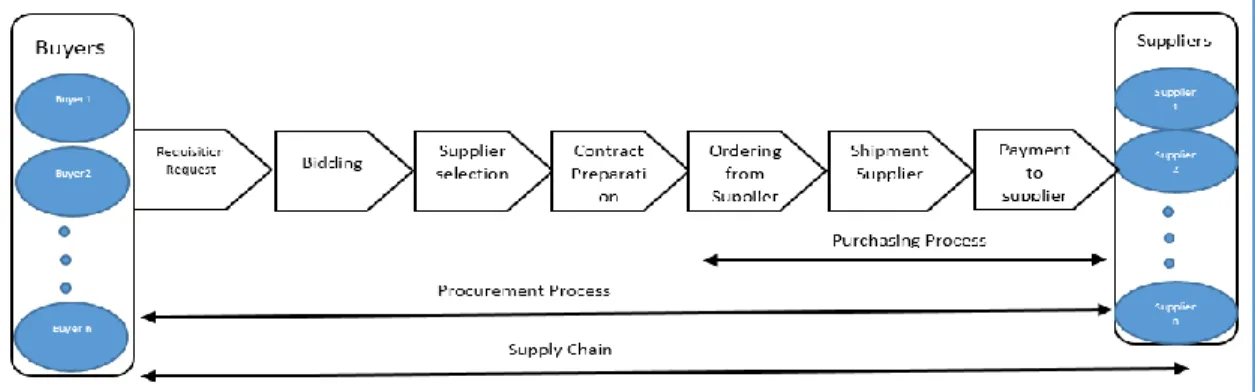
Use Case: Initiate Request and Submit Request for e-procurement
In this example, a use case is a buyer (individual hotel) submitting a request to the e-procurement system that is the main system. The prerequisite for the use case is that the buyer selects the specific product/service they ultimately want at X Hotels.
Components of AI Integrated Framework
This means prioritizing how best to work with data by knowing the data, the outcome, what policy to apply and considering the level of confidence to consider. Finally, the focus should be on workforce skills and organizational models, not just technology.
Proposed Method for Forecasting Problems
The problems in the data set are usually a man-made error in data entry. Ensuring the CSV format was properly maintained was one of the issues that consumed time, and the dataset spanned five years of data.
Validity of the Results
Ethical Considerations
Chapter Summary
Data Analytics
Data Selection, Slicing, and Filtering
Data Clustering
Forecast Error Measures
Root Mean Square Error (RMSE)
RMSE is the square root of the variance of the residuals, used as an error measure to find the duration of the purchase. In this research, the linear regression method was used as the base model, from which the RMSE score is taken as the error measure.
Adjusted R Squared
Baseline Prediction
Linear regression
Persistence forecast
Model Selection
This method is said to be best for trend projection or when the data set represents long time series data. The fast and powerful methods that ML relies on, such as using train test distributions and k-fold cross-validation, do not work in the case of time series data.
Chapter Summary
Recurrent Neural Network (RNN) has the property of selectively remembering patterns for a long time. Some of the reports listed are already generated at The X Hotels, but for monthly or quarterly analysis.
Supplier Spend Summary
Spend summary per property
Spend report by purchase type
Spend report by category
Spend by product name
Discussions
Chapter Summary
Diagnostic analytics are traditional analytics that provide companies with the ability to understand the reason for a certain trend or pattern and to be able to drill down to the root cause. The five diagnostic charts made are new to the company and are very beneficial to the top management for futuristic purposes.
Pie chart
Pie charts are popular with top management as they are interested in seeing the percentage spend comparisons.
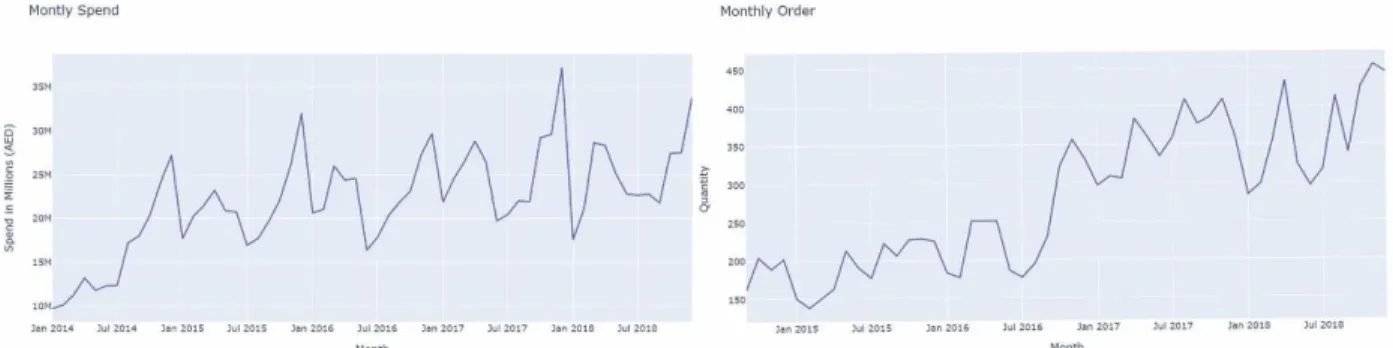
Time Series Graph
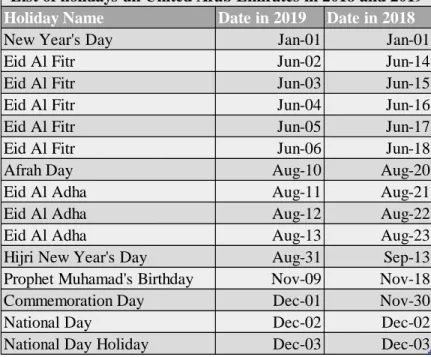
Similarly, the highest spending and usage for 2018 was in March, while the highest point in 2019 was in April. So, more than national holidays, what matters for the highest spending and utilization happens on.
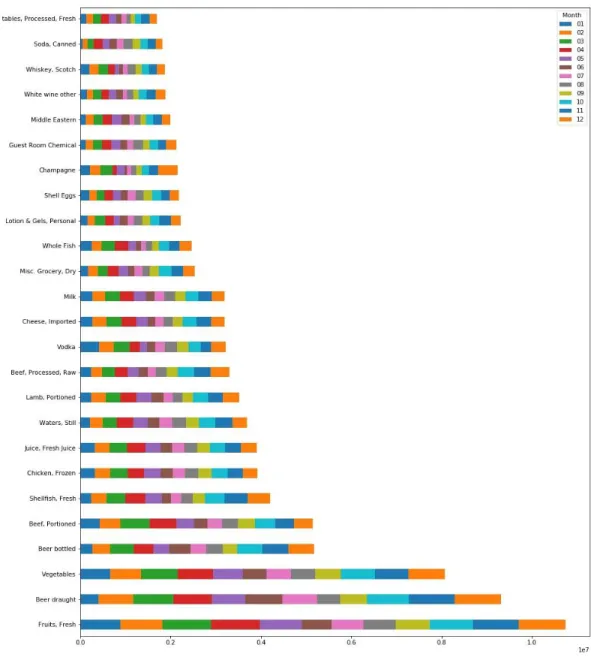
Stacked Bar Graph
A bar chart has been produced which is easy to understand and visualize with different colors to represent the 12 months of the year. Stacked bar charts are preferred by top managers for the following reasons: 1) easy to see, 2) distinguish outliers, and 3) save time.
Line Graph
Further analysis showed that the occupancy rate and expenses were the highest during that period and that the properties therefore won a special deal. The brown-framed building depicted in the line graph had the highest occupancy during that time in the entire region and therefore had the highest consumption.
Discussions
It makes it easier for management to identify a trend or fluctuation in spending and use it to analyze intent. The graph shows some fluctuations in price over a period of time and for one property the fluctuation is large.
Chapter Summary
Predictive analytics involves mining data from current datasets to find trends and patterns to predict future outcomes and trends. Prescriptive analysis is done to find the best course of action in the given situation (Wiki).
Duration of purchase
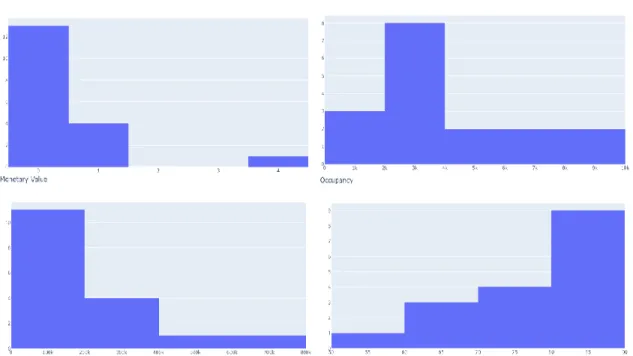
This distribution is used to find the purchase duration between the last purchase date of the first nine months and the first purchase in the next three months. Most properties are active buyers as the pub lies in the 0-1 for the Recency plot.
Demand Forecasting
First, the data is made as a supervised learning model for ML, then make sure it is stationary, and finally, the dataset must be at a certain scale. The initial steps in data transformation included converting the data to stationary, converting the time series to a supervised model to have a feature set for the LSTM model, and scaling the data.
Cognitive Analytics
It can be seen from the graph that the actual quantity purchased has increased while the model has also predicted that the quantity purchased will increase. The supplier has already been alerted by the system to the expected order which was forecasted using the demand forecast, so he would keep his inventory accordingly for delivery according to the contract terms.
Discussions
With the recent proliferation of developing refined ML-based techniques and especially deep learning algorithms using LSTM, higher accuracy and powerful results can be achieved for sequential time series data.
Chapter Summary
New proposed conceptual framework for the hospitality industry
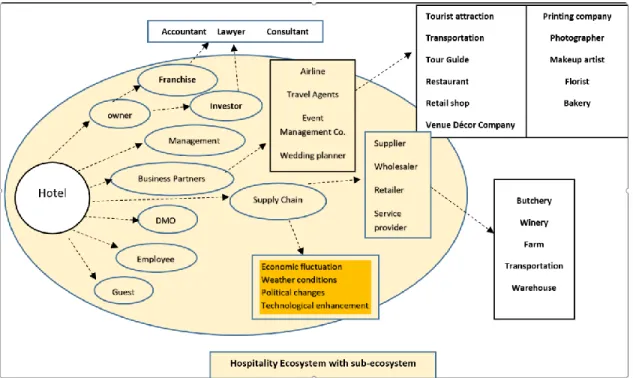
The hype in the hospitality industry around the world is forcing hoteliers to be proactive and innovative in ways to cater to digital natives. In any type of hotel, be it a small, medium or large enterprise, there is a large number of employees in the supply chain, including food and beverage, guest room suppliers, HVAC (heating, ventilation/ventilation and air conditioning). suppliers, technology providers, maintenance and service providers and others.
Conceptual Model for E-procurement in the Hospitality Industry
The third agent deployed is a risk assessment agent that will monitor risks such as currency fluctuation rates/pandemic alerts and escalate all related stakeholders to sort out mismatches in requirements/resources. The fourth agent added is an optimization agent that will continue to monitor decisions made to optimize requirements and pre-exploit alternative solutions for a given scenario.
Discussions on the Extended Framework
In section 4.7 the author has given the detailed methodology of the use case with an example and the components required to integrate AI in an industry. Additionally, the initial framework to integrate AI and predictive analytics is also specified in Section 2.2.4 A and Section 2.2.4 B.
Summary of the Interview
Otherwise, it would require an adjustment in either their dataset or code naming convention to make it work. Although the framework is flexible, it would be expensive for SMEs.
Summary of Survey
Eighty-six percent of participants said this feature is very important, as shown in Figure 37. Ninety-five percent of participants said this feature is very important, as shown in Figure 38.
Statistical Analysis of the Survey
The results of the survey show that the added agents are useful and add value to the business process according to the participants. Overall, an average of 92% of participants emphasized the importance of new agents, with a standard deviation of 4.3% of participants' views on agents.
Validate the qualitative study
Buhalis and Leung (2018) and Raschka, Julian, and Hearty (2016) specified the importance of having a piece of accurate information rather than an estimate. 2015) have specified the challenges in demand forecasting the importance of demand forecasting in the supply chain.
Further Discussions
During the transport of food from the farm to the warehouse or distribution centers or the customer, the goods can be tagged using barcodes, radio frequency identification (RFID) tags or NFC (near field communication) tags. As the tagged items move through the various components of the food supply chain, the related data points can be automatically verified, ensuring that a complete handling audit trail is created and maintained.
Limitations of Deploying the Proposed Framework
Solid and substantial efforts must be progressively required to make the details of the acquisition relevant and useful to the relevant stakeholders to achieve the desired results. The framework must demonstrate its productivity at a time when, in general, the best direction with stakeholders will not be consistent with the framework.
Chapter Summary
Just if X Hotel's integrated providers do not use the integrated framework, the sub-procedure of selecting providers would prove to be pointless. The obstacle for the framework is mostly difficulty in accepting the initial acceptance of the intelligent e-procurement system by the stakeholders.
Limitations
Recommendation for Implementing the AI Integrated Framework
Thus, the system would contribute to the strategic advantage of all stakeholders and the results would show a positive impact on the entire ecosystem. The system should undergo progressive improvement that should be achieved using online studies or field meetings to generate new ideas until the framework is completed capable and applicable to the organization.
Validity, Reliability, and Generalisability
Analytics Expectation: The most expected outcome of an integrated AI and ML framework would be that the system change would bring an immediate improvement to the effective improvement of business processes and greatly contribute to time savings. Final system integration and implementation will be collective and a joint decision between the company and its integrated suppliers to get the best out of the system.
Chapter Summary
Conclusions
A large number of scenarios have been tested in different environments and each component that impacts the e-procurement data has been analyzed using the data analytics maturity model. LSTM proved to be a good algorithm for forecasting spending and amount of e-procurement data.
Impact of the Contributions
A survey was conducted with people in the hospitality industry who are directly or indirectly related to public procurement procedures on the proposed framework to get their opinion. The level of professional knowledge of the staff was only 45% on average. Eight percent of participants said they would recommend the proposed framework to top management. Two percent of the participants confirmed that the added agents are very important for the e-procurement system, and the difference was only 4.3%.
Further Works
Chapter Summary
International Journal of Artificial Life Research, vol. https://study.com/academy/lesson/hospitality-industry-history-origin.html. Big data and supply chain decisions: the impact of volume, variety, and velocity properties on the bullwhip effect.
Descriptive Analytics
Buyer Summary
Spend Summary
Spend report (yearly)
Spend by Purchase type
Diagnostic Analytics
Pie Chart
However, most supply chain systems display information about what has happened, not what will happen. These details are important because the proposed integrated system is intended for the purchasing system in the hospitality industry.
Time Series
Trend Analysis
Stacked Bar Chart
Line graph
Machine Learning Algorithm for Finding Purchase Duration
Import data
Import Libraries
Date conversion to datetime data type
Cut off entire data into two [9 month and 3 months] for finding purchase duration
Finding latest purchase date and earliest purchase date from the cutoff point
Finding purchase duration
Adding Initial feature
Plot Features
Elbow method for making cluster
Finding overall score
Scatter plot between each features
Adding more features
Adding label
Create Heat map
Split into test and train data
Baseline Model
Machine Learning Model Selection
Finding Accuracy
Fine Tuning the model
Duration of purchase for the frequent buyer
This is then combined with the data frame with the original data and the analysis is performed.
Duration of purchase for the most spend product
Duration of most purchase commodity
Machine Learning Algorithm for Demand forecasting
Data Wrangling
Aggregate spend by month
Data Transformation to make stationary data
Baseline Prediction
Adding time lags
Finding optimum Adjusted R 2
Train-Test-Split
Scaling the data
- Building LSTM Model
Fit the LSTM model
Use the model for prediction
Inverse Transform
Plot Actual and Predicted data for Spend forecast
Plot Actual and Predicted data for Quantity forecast
- Survey Consent Form
- Survey Design
Demographic details
Importance of the integrated system
Knowledge and recommendation