Thesis Title: Monitoring System for Li-ion Batteries Health Estimation for Smart Grid. The focus is to improve the data acquisition and the Li-Ion batteries State of Health (SoH) estimation mechanisms.
- Overview
- Problem Statement
- Importance and Motivation
- Objective
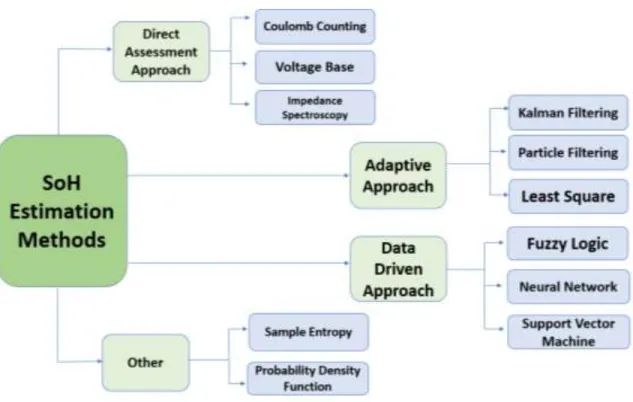
There are several methods used to assess the health of rechargeable batteries. State of health (SoH) monitoring files are used to determine the value of the battery compared to its ideal state [17].
- Rechargeable Batteries
- Lead Acid Batteries
- Nickel Cadmium Batteries
- Nickel – Metal Hydride Batteries
- Lithium Ion Batteries
- Applications of Lithium Ion Batteries
- Emergency Power Back Up or Uninterrupted Power Supply (UPS)
- Dependable Electric and Recreational Vehicle Power in Electric Vehicles: . 26
- Portable Power Packs (Power Banks)
- Alarms, Surveillance and other security systems
- Reliabe Marine Performance
- Battery Technologies
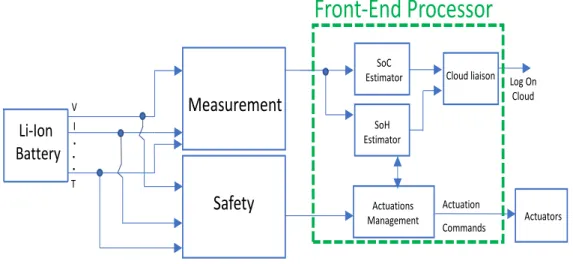
- Lithium Ion Batteries Management Systems
- State of Health (SoH) Estimation Methods
Impedance spectroscopy – this method uses the wide frequency spectrum to estimate the state of health of the battery. The main disadvantage of this method is that its accuracy depends on the efficiency of the training process.
The Li-Ion Battery Data set
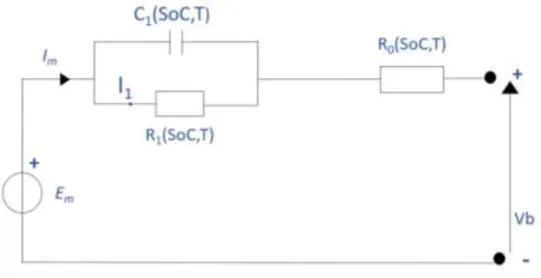
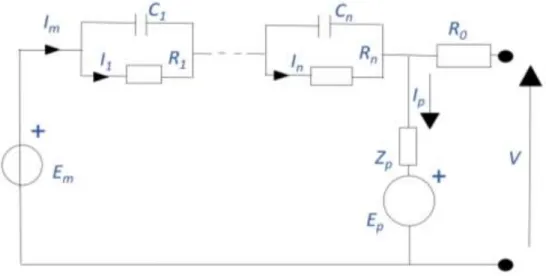
Fast, reliable modeling schemes are needed to properly simulate highly advanced lithium cells. The ability to simplify a model depends on the interest of the problem, the number of RCs, and the specific characteristics of the model. The accuracy of the model would also not be affected by the computational complexity of entering large numbers.
According to this study, it is possible to calculate the internal temperature, non-linear open circuit voltage, calculation for average discharge current and dynamic temperature characteristics of the cell using a single RC block. It is not possible to achieve the specific complexity and accuracy of the model parameters without the appropriate value of P. Using the simulation phase, it is possible to determine the value of the equivalent circuit of the elements using two-dimensional look-up tables.
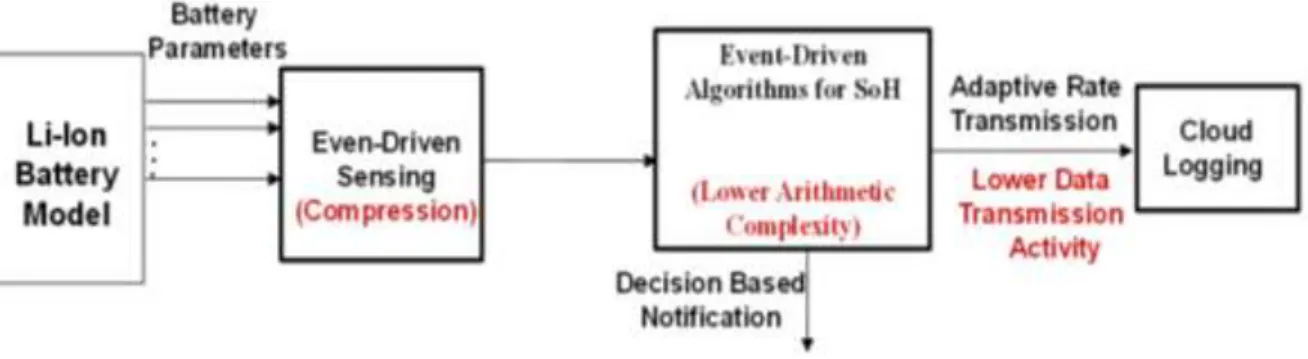
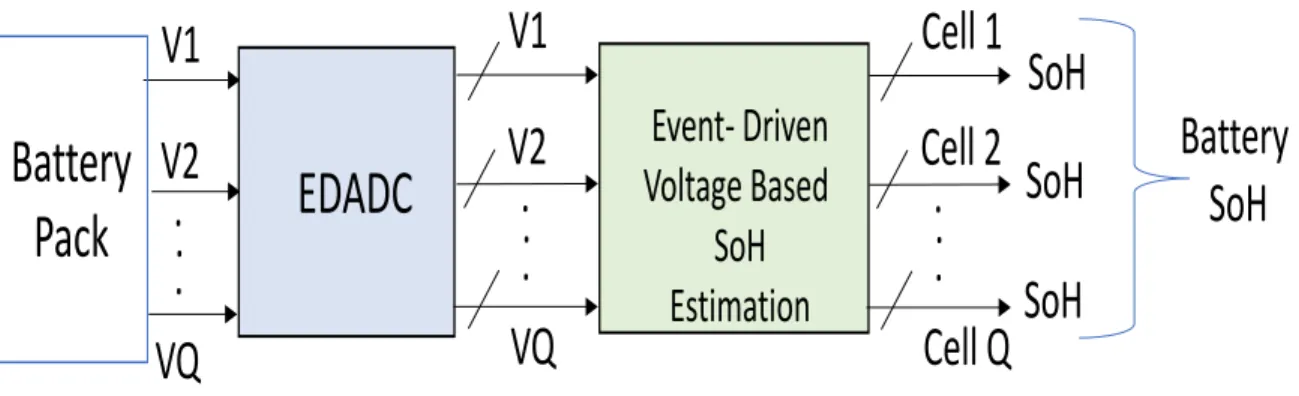
The Event-Driven Data Acquisition
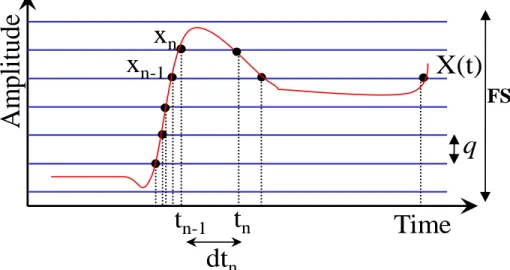
In equation (3), dtn is the time distance between the current, tn, and the previous, tn-1, sampling times. The solution proposed in the article is to use EDADCs to obtain battery parameters, which depend on the Event Driven Sampling (EDS) phenomenon. When choosing the set of levels, it is important to ensure that the levels span the analog signal amplitude range Δx(t).
In the above figure one can see that it is possible to have thresholds that are evenly spaced. It is nevertheless important to note that it is possible to space the thresholds logarithmically or to use either. In an event-driven sampling, each sample can be defined as a pair (Xn, tn), where tn is the time, and xn the amplitude.
Event- Driven Battery Management
46 is sampled immediately after one of the predetermined thresholds is crossed by the minimum analog signal of the input band.
Event- Driven Voltage Base Method
- The Classical Approach
- The Event-Driven Approach
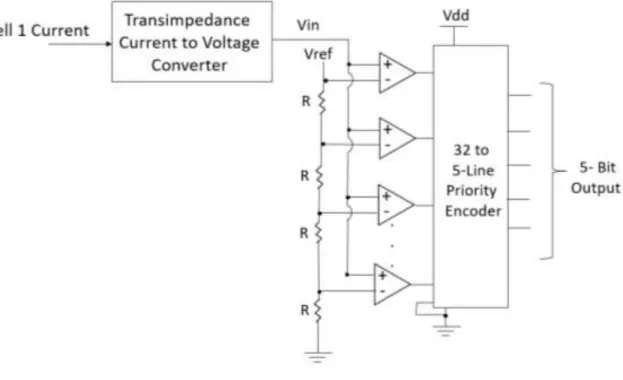
48 The component-level schematic of the EDADC used in this case for one cell is shown in Figure 13. However, due to the electrochemical kinetics and temperature of the battery, the voltage is more strongly influenced by the battery current. This approach can be made more effective by offsetting the voltage reading with a correction term proportional to the current of the battery.
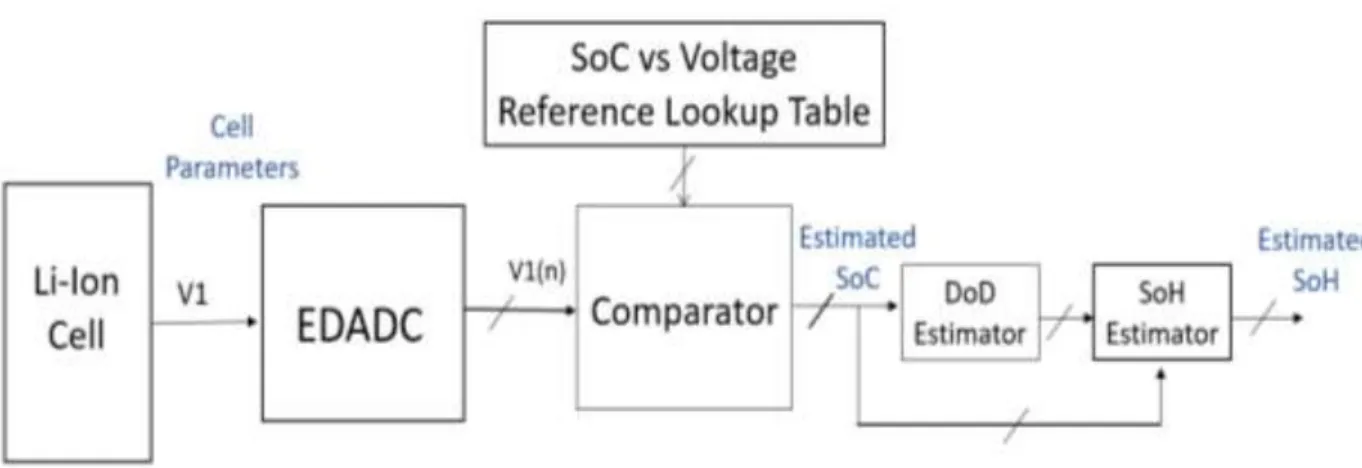
This is a simple approach and periodically calculates the SoH of the target cell by first estimating its current SoC using a predefined voltage vs. SoC curve. For each input battery voltage sample 𝑉𝑚𝑛, magnitude comparisons P between 𝑉𝑚𝑛 and SV are performed. The result of the comparator is used to determine the current SoC of the intended cell of the battery pack.
Event- Driven Coulomb Counting Method
- The Classical Approach
- The Event-Driven Approach
51 The component-level schematic of the EDADC used for single-cell power acquisition in this case is shown in Figure 16. Measurement of the lithium ion state of charge (SoC) by Coulomb counting produces a measurement error of about 3%, resulting in a very accurate indication of the remaining energy in the battery [32]. 52 The component-level schematic of the voltage acquisition EDADC used in this case is shown in Figure 17.
The operating mode of the battery is recognized by the direction of the current through the battery system. For calibration, a sample version of the reference SoC-OCV correlation curve is stored in a lookup table. In total, P thresholds are placed within the entire size dynamics of the battery voltage Vb(t).
Evaluation Measures
- The Computational Complexity of Voltage Based Approach
- The Computational Complexity of Coulomb Counting Approach
- The SoH estimation error
Therefore, the overall computational complexity of the SOH estimation processes can be calculated by using Equation (8). Therefore, the total computational complexity of the designed solution can be calculated by using Equation (9). Then, for a considered time length LT, the obtained number of current samples N and voltage samples M can be respectively calculated as 𝑁 = 𝐹𝑠𝐼× 𝐿𝑇 and 𝑀 = 𝐹𝑠𝑉× 𝐿𝑇.
Therefore, for LT the obtained number of samples for a cell voltage and current can be different[9], [46]. Therefore, the overall computational complexity of the event-driven coulomb count and the event-driven SoC-OCV calibration processes can be calculated using Equation (11). Therefore, the number of samples obtained for a considered time period, LT, may vary and is a function of the EDADC resolution.
First Case Study
However, in the proposed approach the total number of sampled data points is much lower and is NED-Voltage=143. Furthermore, it demonstrates a significant computational efficiency, reduction in the number of operations, of the proposed approach compared to the classical counter. 60 Tables 1 and 2 show the obvious compression and processing benefits of the created solution compared to traditional counterparts.
The SoH curves obtained with the reference estimator, the classical estimator, and the proposed event-driven estimator are presented in Figure 19. The result is 3.1% MPSoHE for the classical estimator and 8.9% MPSoHE for the event-driven estimator. . It ensures that, in addition to achieving 10.4 times gains in terms of data compression, additions, subtractions and comparisons, compared to conventional equality, the achieved precession of the SoH estimate of the proposed solution is also quite comparable to the classical and reference estimator.
Second Case Study
However, in the proposed approach, the total number of sampled data points is much lower and is NED-Current=719 for the cell current and NED-Voltage=89 for the cell voltage, respectively. Here, the compression gains are calculated by calculating the ratios between the obtained number of samples in the classical case and in the proposed solution. Furthermore, in the proposed solution the used EDADCs have much less resolutions, 5-bit and 2.86-bit respectively for the cell current and the cell voltage acquisition.
However, in the classic case, 12-bit ADCs are used to acquire the cell current and voltage. It ensures a drastic reduction in system hardware level complexity compared to the traditional counterparts [9], [4]. In the Coulomb Counting method, we choose this resolution for current and voltage signal because we have confirmed with simulation that this resolution is the optimal results.
Third Case Study
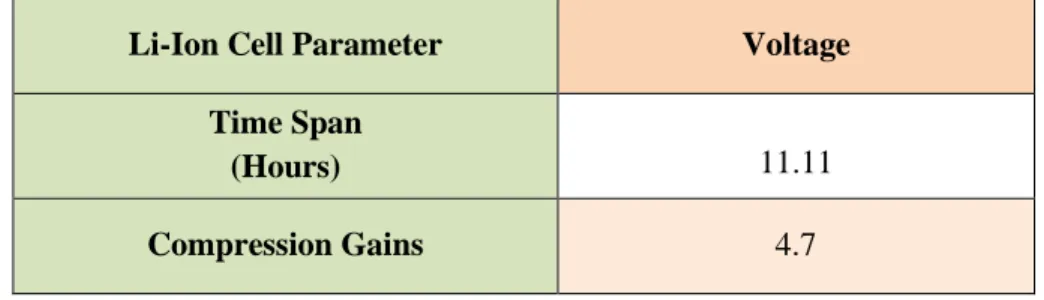
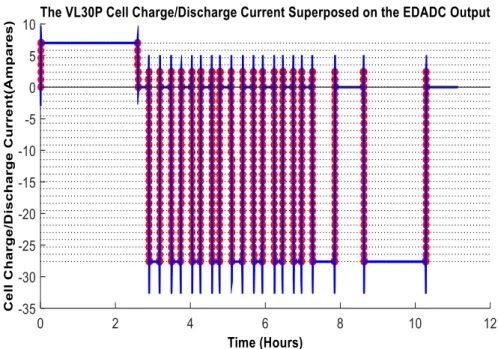
In this case, for the considered time span of 11.11 hours, a total of 73 voltage samples were taken from EDADC. For FsI=1kHz and FsV=16.66mHz, the considered cell voltage and current measurement period of 11.11 hours will result in N=40 Mega-samples for cell current and M=667 samples for cell voltage respectively. However, in the proposed approach the total number of sampled data points is much lower and are respectively NED-Current=368 for cell current and NED-Voltage=73 for cell voltage.
It is achieved by intelligently using sensing and event-driven processing mechanisms for the target application. The SoH curves obtained with the reference estimator, the classical estimator and the proposed event-driven estimator are respectively shown in Figure 23. It results in a 3.4% MPSoHE for the classical estimator and a 7.2% MPSoHE for the event-driven estimator. events.
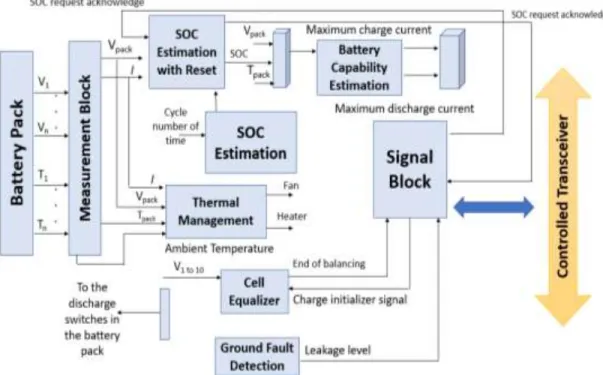
Extended Results for a Battery Pack
- Voltage Based SoH Estimation
- Coulomb Counting Based SoH Estimation
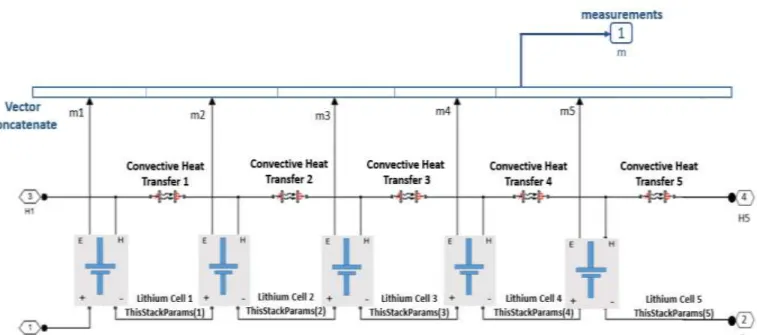
These voltage curves can also be used for balancing the cells of the battery pack[32]. In this case, for the considered time frame of 3 hours, the total voltage samples taken by the EDADCs, for each cell in the battery pack, are shown in Figure 29. Then for the considered time frame of 3 hours, result in 180 voltage samples for each cell.
In this case, for the considered time span of 3 hours, EDADC acquires a total of 188 instantaneous samples. In this case, for the considered time span of 3 hours, the total voltage samples obtained by the EDADC for each cell in the battery pack are shown in Figure 30. Similarly, the MPSoHEs are calculated for each cell of the battery pack used, discussed in Section 3.6.3. In the case of the event-based voltage estimator, the result is displayed in minimum, maximum and average values.
82 systems are battery condition monitoring, energy recovery in electronic vehicles and thermal management (cooling) of battery systems[32]. The main limitation of the classical approach is that it is based on the classical theory of signal acquisition and processing. State of health measures the battery's state of merit compared to the ideal conditions the battery should be in.
One of the biggest disadvantages of renewable energy sources is that they are not stable in their current voltage. It is not obvious to compare the proposed approach with the state-of-the-art tactics, as they are based on the classical sampling and treatment-based concepts[59]. The obtained SoH estimation precession for the proposed solution is also comparable to the classical and reference estimator.
Future Work
Chen, 'Status-of-health estimation for the lithium-ion battery based on support vector regression', Appl. Bossche, 'Critical review of methods for estimating the state of health of Li-ion batteries for real applications', Renu. Mohamed, “An overview of lithium-ion battery state of charge estimation and management system in electric vehicle.
Liaw, 'On-Line Health Assessment of Lithium-Ion Batteries Using State of Charge Calculation', J. AlQathami, 'A Proficient Li-Ion Batteries State of Health Assessment Based on Event-Driven Processing', in 2019 3rd International Conference on Energy Conservation and Efficiency (ICECE), 2019, pp. The poster was under the title "Li-Ion Battery State of Health Assessment Based on Event-Driven Processing and Analysis".