The author has also granted permission to the University to retain or make a digital copy for similar use and for the purposes of digital preservation of the work. Regional climate change scenarios indicate ever-increasing trends in energy consumption in buildings, which are a serious cause for concern for the UAE's built environment sector. The intermodel comparison reflects the underestimation of dynamic thermal simulations in predicting cooling energy savings compared to CFD simulation.
Introduction
- Energy footprint of building stock in the UAE
- Building stock of UAE and typical end use energy consumption
- Mitigating energy consumption of buildings
- Regional warming in the UAE
- Research problem statement
- Aims and Objectives
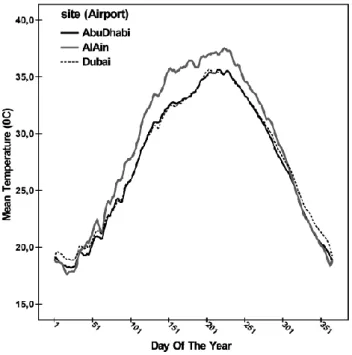
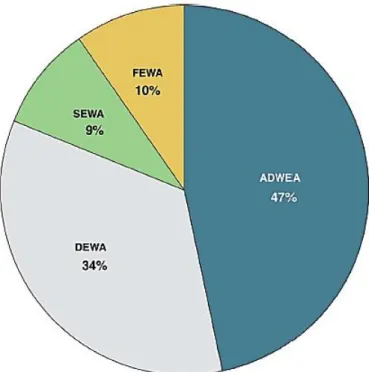
It can be well understood that most of the building stock is in the 1 - 4 storey range. As shown in Table 2, the commercial sector accounted for 35.9% of the total electricity consumption for the building stock in the United Arab Emirates. In their research they focused on the change in near surface air temperatures and atmospheric humidity for three regions in the United Arab Emirates namely Dubai, Abu Dhabi and Al Ain from 1982 to 2009.
Literature review
Energy consumption of office buildings in the UAE
The cooling energy consumption for the base building was measured at approximately 4,03,4000 kWh giving a benchmark value of 173 kWh/m2/year. The authors reported an EUI of 503.2 kWh/m2/year for the office case with the glazed facade in the south direction and an EUI of 393.8 kWh/m2/year for the office case with the glazed facade in the north direction. The maximum monthly EUI of 43.8 kWh/m2/year was observed for the office cupboard with south facade in the month of October and a monthly EUI of 38.6 kWh/m2/year for the office cupboard with north facade in August.
External shading
These peak heating energies were primarily required during the heating months, but were offset by the energy saving potential of the external shades during the cooling months. C and an egg crate configuration that delivers a maximum temperature drop of 6.3 degrees. It also used a thermal imaging tool that shows surface temperatures in three shading configurations and a base case.
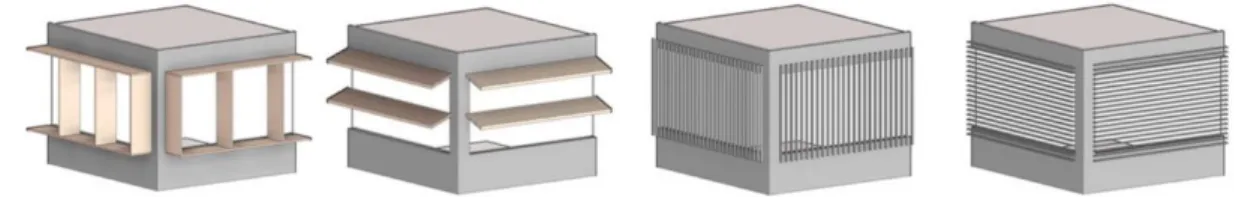
Double skin façade
But the number of studies related to the applicability and performance of DSF in hot climates is gradually increasing over the years. It should be noted that most of the DSF studies cited in this research confirm the multilevel type of DSF. A window-to-wall ratio (WWR) of 40% was used for the DSF interior cladding.
Smaller solar gains on the inner surface of the CRFS would consequently mean smaller cooling loads for the CRFS, which are shown in Figure 20. The second part of this study presented the analysis of the CRFS for velocity and temperature profiles. The authors observed a characteristic display of the buoyancy effect during the analysis of the velocity vectors for the CRFS.
The primary models were further divided due to the number of perforations in the outer skin of the DSF. The impact of DSF inlet and outlet on cavity performance was not considered in this study. They found that as the thermal mass of the outer skin of the DSF increased, so did the performance of the DSF.
The authors stated that the possible reason for higher temperatures in the upper part of the DSF could be attributed to non-optimized inlet and outlet openings. Kim (2021) studied the performance of DSF under the hot climatic conditions of Saudi Arabia. The author highlighted that the investment costs for a DSF system are relatively higher than for a traditional facade system, where DSF indicates overheating of the cavity during the summer months.
Methodology
As discussed in the literature review section on Dubai's building stock, a high-rise office building was chosen that represents the majority of Dubai's building stock and the type of occupancy well. Reiterating the conclusion of the literature review, it was understood that the passive technologies such as external shading and double skin facades can achieve promising reductions in the energy consumption of buildings. Another reason for choosing these three cases is because they uniquely represent the different levels of construction that developers would choose for the UAE's built environment sector.
The purpose of the study was also to ensure that a high-rise building is considered, and therefore a 13-storey building was chosen. The dimension of one side of the building is 40 meters in length for the chassis and the external shade house. The overhang covers the entire length of the window and is projected from the wall on which the pane is placed.
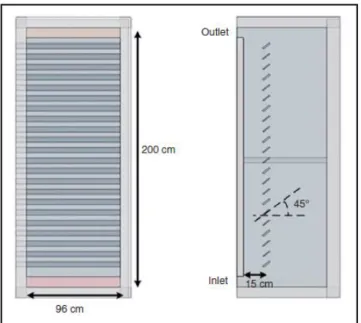
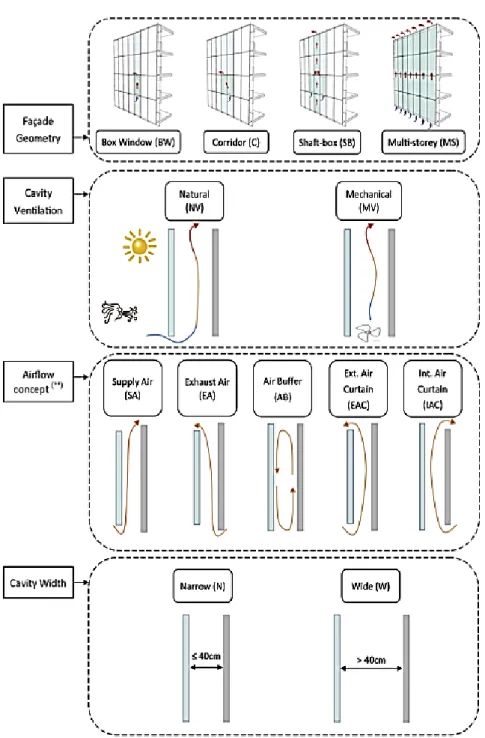
In the case of the DSF model, the overall building dimensions are slightly expanded due to the inclusion of the DSF cavity, making it a total length of 42m each side with 2m cavity width of DSF along one side of the building. The DSF configuration used for this particular study in light of the classification discussed in the literature review section will be a multi-story facade system allowing natural ventilation with an external air curtain (EAC) airflow concept and a wide cavity depth. The DSF cavity zone in the DSF model has been set with the cavity option available in the DesignBuilder software.
In this particular study of the DSF cavity, inlet and outlet are defined as a hole.
Results and discussions
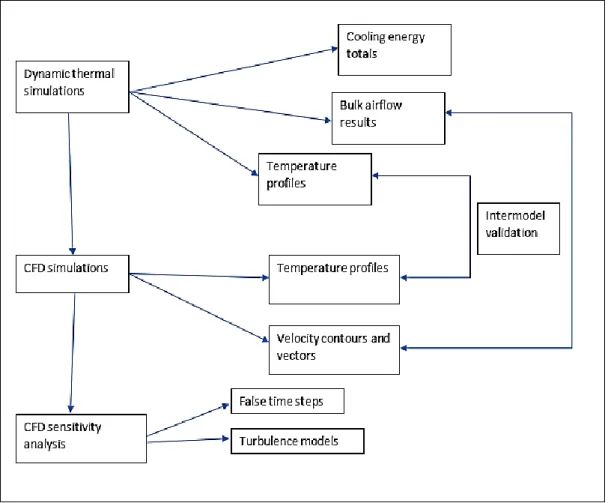
Dynamic thermal simulations
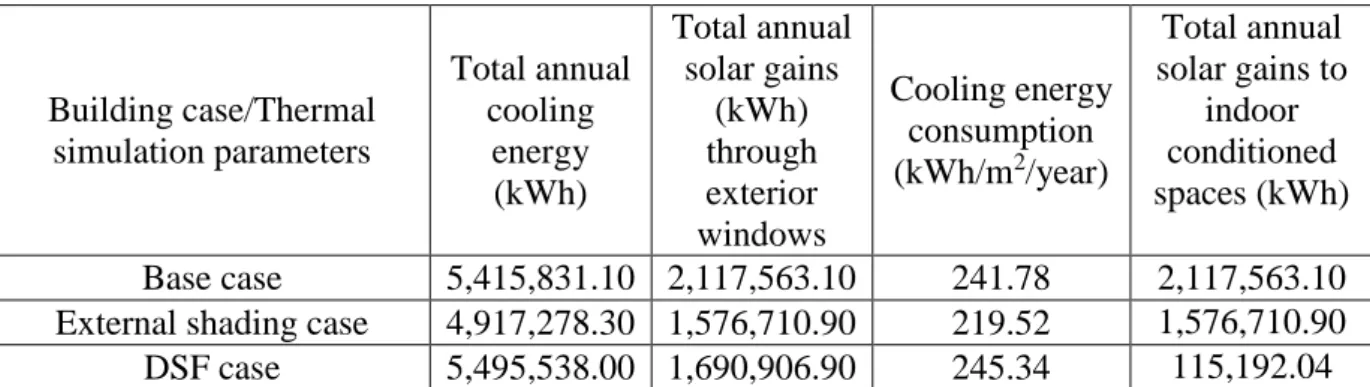
This leads to the fact that the higher cooling energy consumption in the DSF case is not due to the solar gains, but due to the phenomena occurring in the DSF cavity itself. The highest value of the solar gains is with the base case in October month and the least value of solar gains is with DSF case in September month. The temperature profiles of the base case and the external shadow case are very straight forward and not much happens in terms of the temperature variation along the height of the surface.
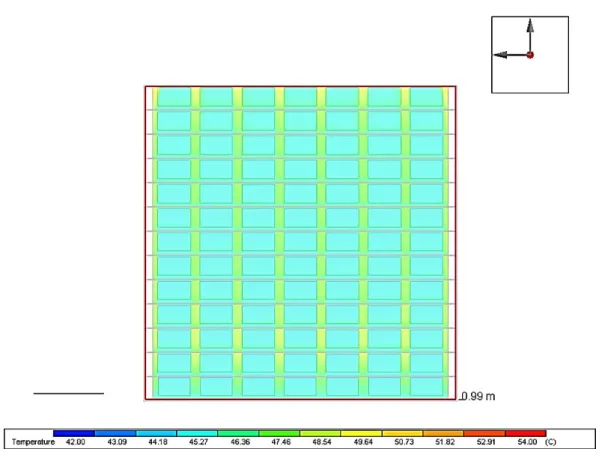
If we look at the surface temperatures of the outer shade housing, it can be seen that the windows on the right side of the west facade are at lower temperatures (about 42 degrees C) than the rest of the surface. In addition, it is worth observing the surface temperatures of the inner side of the outer DSF cladding (Figure 72). The next part of the dynamic thermal simulations comprised the mass airflow results, which were limited to the DSF case only.
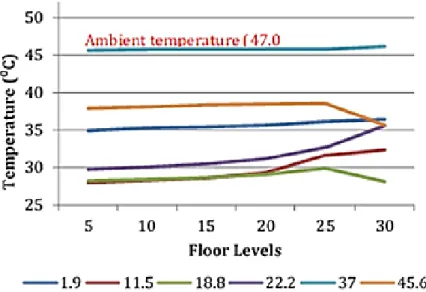
As can be seen in figure 73, the direction of the air flow is from the bottom to the top of the DSF. The velocities are obtained by multiplying the inlet and outlet velocities by the area of the inlets and outlets respectively. It can be observed that as we go up the floors, the temperature tends to have a gradual increase until the DSF comes out.
It is clear from the graphs that from 1 a.m. to 7 a.m. the temperature variation along the height of the DSF is insignificant at only 2 degrees.
DSF Cavity Internal CFD analysis
- Sensitivity analysis for CFD simulations
As can be seen in Figure 83, velocity values gradually increase from the bottom of the cavity as we move up the cavity. The transition of the velocity takes place from the 0.71 m/s to a higher value of 0.81 m/s towards the second floor. The first set of in-house CFD simulations were performed for a period of 14,000 iterations (Figure 87) and using the k-e turbulence model.
Furthermore, the results of the constant effective viscosity turbulence model stabilize much faster than the k-e turbulence model. It is well understood that the CFD calculations take place for a certain period of time determined by the requirement of the analysis in question. The second part of the CFD sensitivity analysis consisted of changing the turbulence model from k-e to constant viscosity and having the dummy time step of 0.2, to understand the effect on the residuals of the CFD analysis.
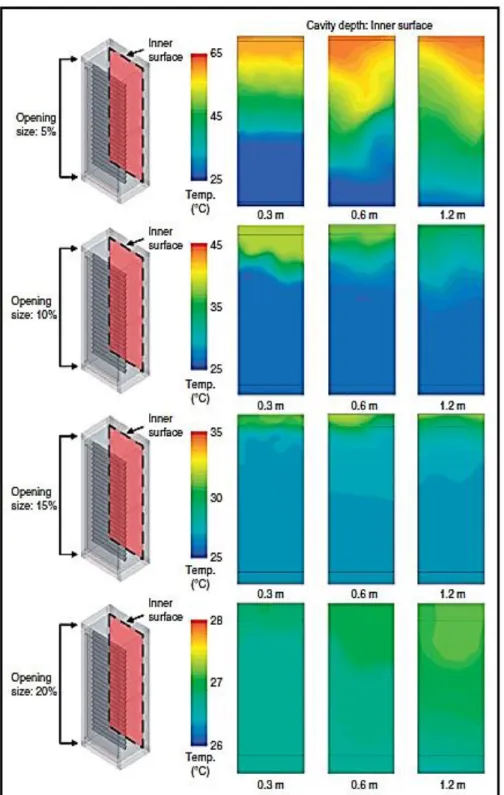
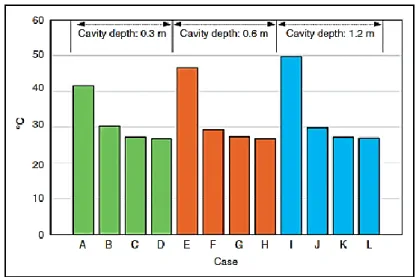
At the central monitor point the behavior of the x-velocity is quite random and its value. The temperature change in all the three images above is quite similar with negligible difference. Additionally, to confirm the airflow direction, a CFD slice from the middle of the CFD domain was generated, as shown in Figure 104.
Magnified images at each of the three monitor points also show a streamlined flow.
Intermodel comparison
Temperature profiles
Velocity profiles
Conclusion and future works
Changing the turbulence model from k-e to constant effective viscosity resulted in faster convergence of the simulations, although the initial erratic behavior was the same as that observed in the case of the k-e turbulence model. The final part of the research included a comparison of the results obtained with dynamic thermal simulations and internal CFD simulations. C was observed between temperature readings of dynamic thermal simulations and CFD analysis.
The velocity values from both assays could not be directly compared as the dynamic thermal simulations helped determine only the inlet and outlet velocities, but showed a level of similarity at the DSF inlet. Overall, the research highlighted the potential of DSFs for the hot climate of the UAE and has shown promising reductions in annual cooling energy savings. Further research avenues could be to optimize DSF for hot climates by choosing the optimal combination of DSF variables.
Energy performance of double skin facade in a conventional residential building in Irbid, Jordan. Impact of external shading devices on thermal performance and lighting of offices in hot climate regions. Double skin facade: Modeling technique and influence of venetian blinds on air flow and heat transfer.
Evaluation of different CFD modeling strategies for the prediction of airflow and temperature in a naturally ventilated double skin vessel.