The Saudi Insurance Market Report
2020
The General Department of Insurance Control
Table of Content
o Highlights of the Saudi Insurance Sector-2020 5
o Major Developments in 2020 6
o Insurance Market Performance - Overall
• Gross Written Premiums 9
• Insurance Penetration 10
• Insurance Density 11
• Gross Written Premiums by Line of Business 12
• Net Written Premiums by Line of Business 14
• Gross Written Premiums by Client Segment 16
• Gross Written Premiums by Geographic Regions 17
• Gross Written Premiums by Distribution Channel 18
• Retention Ratio by Line of Business 19
• Gross Claims Paid by Line of Business 20
• General and Health Net Earned Premiums vs. Net Claims Incurred 21
• Market Profitability 22
• Balance Sheet - Policyholders’ Assets 23
• Balance Sheet - Shareholders’ Assets 24
• Balance Sheet - Policyholders’ Liabilities and Equity 25
• Balance Sheet - Shareholders’ Liabilities and Equity 26
o Insurance Market Performance - By Line of Business
• Health Insurance 28
Table of Content
• Motor Insurance 30
• Property/ Fire Insurance 31
• Engineering Insurance 32
• A&L and Other Insurance 33
• Marine Insurance 34
• Energy Insurance 35
• Aviation Insurance 36
o Other Market Indicators
• Gross Commissions Incurred by Line of Business 38
• Employees of Insurance Companies by Nationality 39
• Employees of Insurance intermediaries by Nationality 40
• Insurance Market Structure 41
• Capitalization of Insurance Companies 42
o Appendix: Data Tables
• Table 1: Gross Written Premiums by Line of Business 44
• Tables 2 & 3: Insurance Penetration and Density 45
• Table 4: Net Written Premiums by Line of Business 46
• Table 5: Gross Written Premiums by Distribution Channel 47
• Table 6: Gross Written Premiums by Client Segments 48
• Table 7: Retention Ratio by Line of Business 49
• Table 8: Gross Commissions Incurred by Line of Business 50
• Table 9: Gross Claims Paid by Line of Business 51
Insurance Sector Highlights - 2020
• The insurance sector witnessed a premium growth of 2.3% in 2020*, with total written premiums reaching SR 38.78 Billion. Energy and Accident &
Liability insurance classes witnessed notable increase in written premiums.
• The gross written premium through online aggregator reached SR 2.3 Billion in 2020 compared to SR 1.3 Billion in 2019.
• The penetration ratio of the sector increased from 1.28% in 2019 to 1.48% in 2020.
• The overall loss ratio decreased from 81.9% in 2019 to reach 77.5% in 2020 due to the improvements in the loss ratio of Health and Motor insurance classes.
• The net profit (after zakat & tax) for the sector increased by 61.6% over the last year’s corresponding figure, reaching 1.38 Billion in 2020, improving in turn the return-on-assets and return-on-equity ratios.
• The overall Saudization ratio increased from 74% in 2019 to 75% in 2020.
• In 2020, the sector witnessed materialization of the first merger, which was between Walaa and Metlife-AIG-ANB Cooperative Insurance Company, followed by the merger between Gulf Union and Alahlia Cooperative insurance company, also in 2020. This reflects the Central Bank’s effort to support the sector in consolidation and acquisition in order to achieve the objectives of Saudi Vision 2030. This is also expected to strengthen the financial position of insurance companies enabling them to better protect the rights of policyholders, enhance customer services, manage the costs, enhance efficiency, provide diverse insurance products, and attract talented resources.
• Additionally, the year 2020 witnessed signing of a binding merger agreement between Aljazira Takaful and Solidarity**. This was followed by a memorandum of understanding (MoU) between Enaya and Amanah insurance companies for their potential merger.
Highlights of the Saudi Insurance Sector
(*) This report is based on the sector data collected from 30 insurance and reinsurance companies.
(**) the merger materialized in February 2021
Major Regulatory Developments in 2020
•
The Central Bank conducted a number of supervisory visits and inspections as part of its risk-based supervision framework. A total of 261 supervisory visits and inspections were carried out during 2020 covering the insurance sector. In line with the Central Bank’s aim to measure the overall performance of the sector, the Market Conduct program for insurance intermediary was introduced during 2020 in order to prevent and control market misconduct activities, including unlicensed activities.
•
In 2020, SAMA continued to refine the existing regulations and also introduced new regulations in order to respond to the evolving business environment in a timely manner. The highlighted regulations are as follows:
– Rules governing the activities of Insurance Aggregators, which are expected to streamline the operations and facilitate easy access to affordable insurance cover for the masses
– New rules for Insurance Products Approval by SAMA were issued, aimed at making the approval process more efficient as well as strengthing the internal review process at insurance companies
– Bancassurance activities with the objective of increasing awareness and reach of insurance savings products
– Actuarial Work Rules, which are expected to significantly strengthen the role of actuarial expertise in the sector and increase the level of technical sophistication in the sector, ultimately increasing the reliability of results produced by insurance companies.
– Issuance of at least 44 circulars on a range of subjects
• SAMA also proactively facilitated introduction of a number of new insurance products in line with its mandate to promote and develop the insurance industry, some of which are: drone risk insurance, insurance against cancellation of live-events, and unified policy for Inherent Defects Insurance aimed at protecting policy holders and beneficiaries in the construction and housing sector.
Major Developments in 2020
•
The sector successfully completed Phase 2 of the IFRS17 implementation-journey, and moved on to Phase 3 of the four-phase implementation road map issued by the Central Bank (Phase 3 is due for completion in April 2021).
•
SAMA encouraged insurance companies to adopt the latest technology in their operations and services provided to customers, which was reflected in the digitization of a large number of procedures in the insurance sector. These ranges from right at the start of the sales process until the final claim settlement, in addition to handling of accidents, in order to improve quality of service and hence increase customer satisfaction. The success of this was clearly demonstrated during the lock-down period due to COVID-19.
•
The Saudi Central Bank valued the initiatives taken by the insurance sector during the COVID19 pandemic. In the motor sector,
insurance companies extended all in force policies for individuals for two months free of charge. In the health sector, with the
objective of providing easy and risk-free access to health services, insurance companies introduced telemedicine services for
consultation with physicians as well as started a service to deliver medicines to beneficiaries at their homes. The Central Bank
also highly appreciates the donation of 68 million riyals made by the insurance sector to a government fund created to deal
with the adverse impact of COVID19.
Insurance Market Performance
17,173.7 16,327.4 14,028.4 14,280.7 14,678.3
18,630.3 19,035.5
19,883.4 22,474.9 22,836.8
1,051.4 1,140.3
1,102.7
1,134.9 1,263.6
2016 2017 2018 2019 2020
Gross Written Premiums
Protection Insurance Health Insurance General Insurance
Gross Written Premiums
35,014 36,503
36,855 37,890
SRMillion
2016 2017 2018 2019 2020
Growth 2019-2020 Line of Business SR M % of Total SR M % of Total SR M % of Total SR M % of Total SR M % of
Total
Health Insurance 18,630.3 50.5% 19,035.5 52.1% 19,883.4 56.8% 22,474.9 59.3% 22,836.8 58.9% 1.6%
General Insurance 17,173.7 46.6% 16,327.4 44.7% 14,028.4 40.1% 14,280.7 37.7% 14,678.3 37.9% 2.8%
Protection Insurance 1,051.4 2.9% 1,140.3 3.1% 1,102.7 3.1% 1,134.9 3.0% 1,263.6 3.3% 11.3%
Total 36,855.3 100% 36,503.2 100% 35,014.5 100% 37,890.5 100% 38,778.7 100% 2.3%
38,778
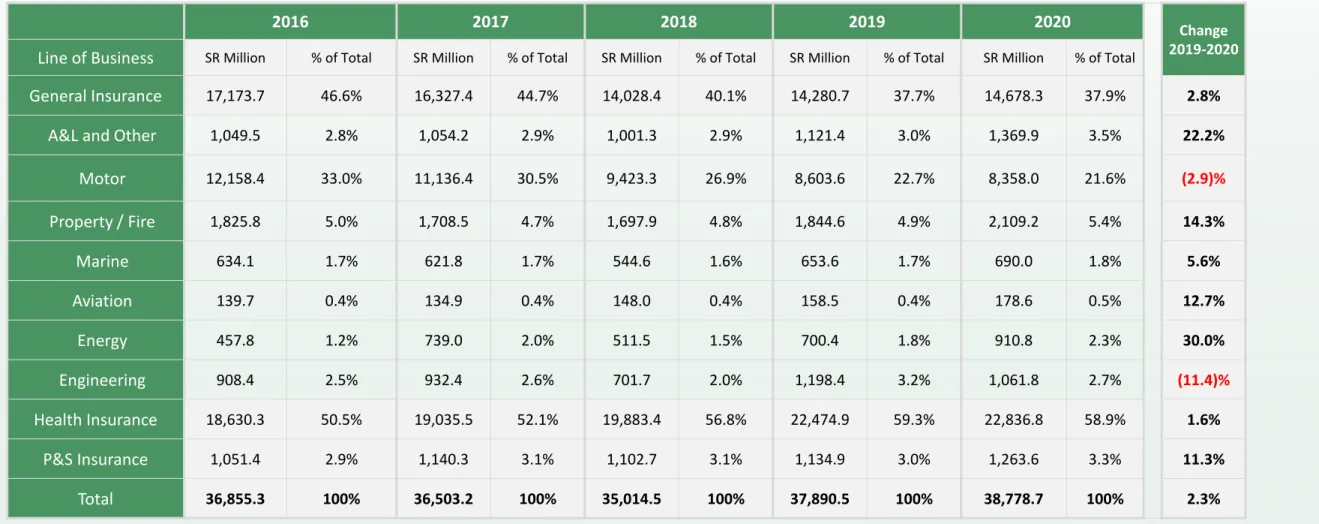
• In 2020, the total Gross Written Premiums grew by 2.3 percent, reaching SR 38.78 Billion compared to SR 37.89 Billion in 2019.
• Health insurance remained the largest line of business in 2020, growing at 1.6%. Its contribution to total GWP in 2020 reached 58.9%.
• General insurance’s contribution to total GWP slightly increased from 37.7% in 2019 to 37.9%
in 2020.
• Protection and Savings insurance, representing the smallest line of business, slightly increased in 2020 attaining 3.3% share in total premiums.
0.96% 0.89% 0.73% 0.70% 0.73%
1.04% 1.04%
1.03% 1.10% 1.13%
0.06% 0.06%
0.06% 0.06% 0.06%
2016 2017 2018 2019 2020
Insurance Penetration of Non-Oil GDP (2)
General Insurance Health Insurance Protection Insurance
0.72% 0.64% 0.48% 0.48% 0.56%
0.78% 0.74%
0.68% 0.76% 0.87%
0.04%
0.04%
0.04% 0.04%
0.05%
2016 2017 2018 2019 2020
Insurance Penetration of Total GDP (1)
General Insurance Health Insurance Protection Insurance
Insurance Penetration
-0.13%
1.20%
1.42%
1.54%
1.28%
-1.74%
1.82%
1.99%
2.06%
1.87%
1.48%
1.92%
•
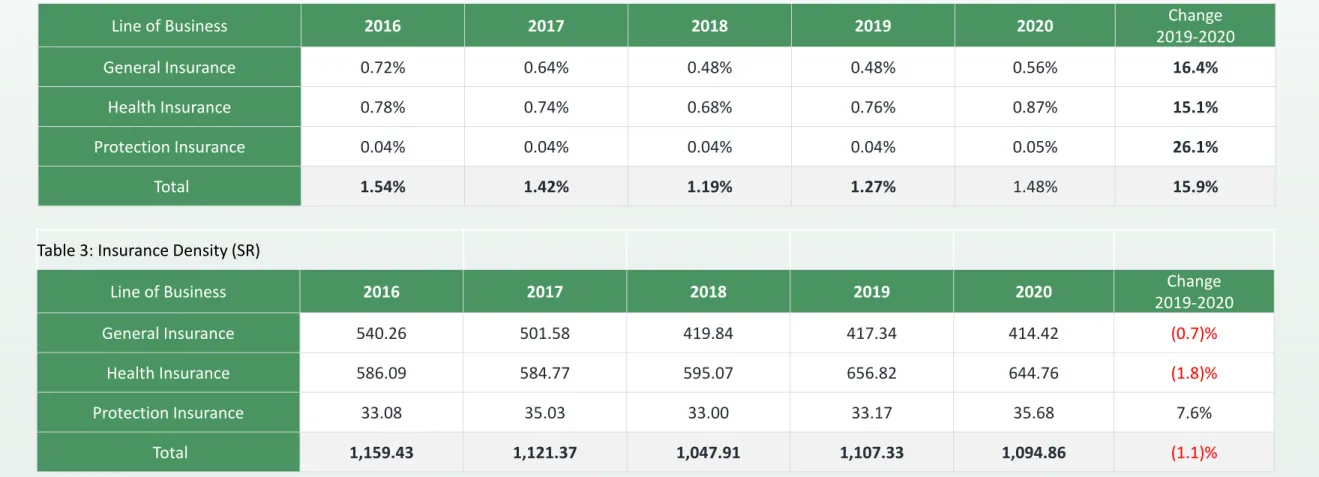
The insurance penetration (ratio of insurance premium to GDP) increased from 1.28 percent in 2019 to 1.48 percent in 2020 due to the increase in premiums.
•
Over the course of 5 years, compound annual growth rate for insurance penetration has been -0.13%
•
The penetration of insurance to non-oil GDP increased
marginally from 1.87 percent in 2019 to 1.92 percent in 2020.
540.26 501.58
419.84 417.34 414.42
586.09
584.77
595.07 656.82 644.76
33.08
35.03
33.00
33.17 35.68
2016 2017 2018 2019 2020
Insurance Density
General Insurance Health Insurance Protection Insurance
Insurance Density
(1)1,159
1,121
1,048 -1.28%
1,107 1.095
•
Insurance density is defined as Gross Written Premiums per Capita.
•
Despite the increase in GWP In 2020, Insurance density decreased by 1.1% to reach SR 1,095, from SR 1,107 per Capita in 2019, due to the increase in population.
(1) Saudi population of 30.77, 31.78, 32.5, 33.4,34.2 and 35.42 Million in 2016, 2017, 2018, 2019, and 2020 respectively, General Authority for Statistics
Gross Written Premiums by Line of Business (1 of 2)
2016 2017 2018 2019 2020
Growth 2019-2020 Line of Business SR M % of
Total SR M % of
Total SR M % of
Total SR M % of
Total SR M % of Total
Aviation 139.7 0.4% 134.9 0.4% 148.0 0.4% 158.5 0.4% 178.6 0.5% 12.7%
Energy 457.8 1.2% 739.0 2.0% 511.5 1.5% 700.4 1.8% 910.8 2.3% 30.0%
Engineering 908.4 2.5% 932.4 2.6% 701.7 2.0% 1,198.4 3.2% 1,061.8 2.7% (11.4)%
Marine 634.1 1.7% 621.8 1.7% 544.6 1.6% 653.6 1.7% 690.0 1.8% 5.6%
Property / Fire 1,825.8 5.0% 1,708.5 4.7% 1,697.9 4.8% 1,844.6 4.9% 2,109.2 5.4% 14.3%
A&L and Other 1,049.5 2.8% 1,054.2 2.9% 1,001.3 2.9% 1,121.4 3.0% 1,369.9 3.5% 22.2%
P&S 1,051.4 2.9% 1,140.3 3.1% 1,102.7 3.1% 1,134.9 3.0% 1,263.6 3.3% 11.3%
Motor 12,158.4 33.0% 11,136.4 30.5% 9,423.3 26.9% 8,603.6 22.7% 8,358.0 21.6% (2.9)%
Health 18,630.3 50.5% 19,035.5 52.1% 19,883.4 56.8% 22,474.9 59.3% 22,836.8 58.9% 1.6%
Total 36,855.3 100% 36,503.2 100% 35,014.5 100% 37,890.5 100% 38,778.7 100% 2.3%
• Motor and Health insurance represent 80.4% of total GWP in 2020.
• Health insurance including the compulsory and non- compulsory remained the largest line of business in 2020, accounting for 58.9% of total GWP, and
experiencing 1.6% premium growth during 2020.
• Motor insurance stood in the second place with a 21.6% share of total GWP. Its’ gross written
premiums decreased by 2.9% in 2020.
18,630.3 19,035.5 19,883.4 22,474.9 22,836.8
12,158.4 11,136.4 9,423.3
8,603.6 8,358.0
1,051.4 1,140.3
1,102.7
1,134.9 1,263.6
5,015.3 5,191.0
4,605.0
5,677.0 6,320.3
0 5,000,000 10,000,000 15,000,000 20,000,000 25,000,000 30,000,000 35,000,000 40,000,000
2016 2017 2018 2019 2020
Other General P&S
Motor Health
Gross Written Premiums by Line of Business (2 of 2)
36,855 37,890
36,503
35,014
SR Million
38,778
Net Written Premiums by Line of Business (1 of 2)
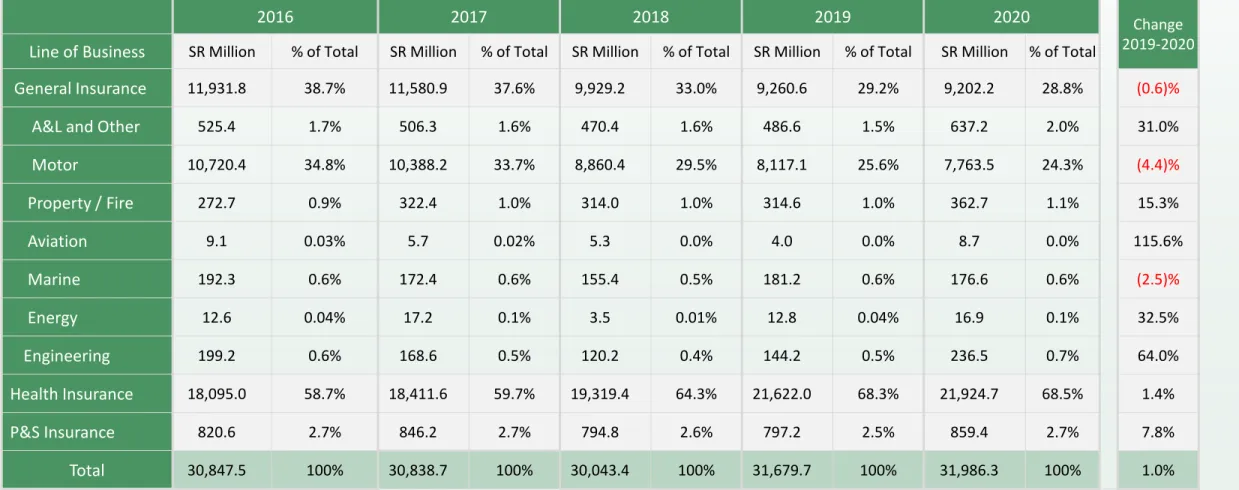
• Net Written Premiums (NWP) is defined as the premiums retained by the insurance company, after the subtraction of the premiums ceded to local or international reinsurers from Total GWP
• Total NWP increased by 1% from SR 31.68 Billion in 2019 to SR 31.99 Billion in 2020.
• General Insurance (excluding Motor) share of total NWP increased slightly from 3.6% in 2019 to 4.5% in 2020.
• Health insurance accounted for 68.5% of total NWP in 2020, whereas Motor insurance share was 24.3% of total NWP in 2020
2016 2017 2018 2019 2020
Growth 2019-2020 Line of Business SR M % of
Total SR M % of
Total SR M % of
Total SR M % of
Total SR M % of Total
Aviation 9.1 0.03% 5.7 0.02% 5.3 0.02% 4.0 0.01% 8.7 0.03% 115.6%
Energy 12.6 0.04% 17.2 0.06% 3.5 0.01% 12.8 0.04% 16.9 0.05% 32.5%
Engineering 199.2 0.6% 168.6 0.5% 120.2 0.4% 144.2 0.5% 236.5 0.7% 64.0%
Marine 192.3 0.6% 172.4 0.6% 155.4 0.5% 181.2 0.6% 176.6 0.6% (2.5)%
Property / Fire 272.7 0.9% 322.4 1.0% 314.0 1.0% 314.6 1.0% 362.7 1.1% 15.3%
A&L and Other 525.4 1.7% 506.3 1.6% 470.4 1.6% 486.6 1.5% 637.2 2.0% 31.0%
P&S 820.6 2.7% 846.2 2.7% 794.8 2.6% 797.2 2.5% 859.4 2.7% 7.8%
Motor 10,720.4 34.8% 10,388.2 33.7% 8,860.4 29.5% 8,117.1 25.6% 7,763.5 24.3% (4.4)%
Health 18,095.0 58.7% 18,411.6 59.7% 19,319.4 64.3% 21,622.0 68.3% 21,924.7 68.5% 1.4%
Total 30,847.5 100% 30,838.7 100% 30,043.4 100% 31,679.7 100% 31,986.3 100% 1.0%
18,095.0 18,411.6 19,319.4
21,622.0 21,924.7
10,720.4 10,388.2 8,860.4
8,117.1 7,763.5
820.6 846.2
794.8
797.2 859.4
1,211.4 1,192.7
1,068.8
1,143.5 1,438.6
5,000,000 13,000,000 21,000,000 29,000,000
2016 2017 2018 2019 2020
Other General
P&S
Motor
Health
Net Written Premiums by Line of Business (2 of 2)
31,680
30,847 30,839
30,043
SR Million
31,986
Gross Written Premiums by Client Segment
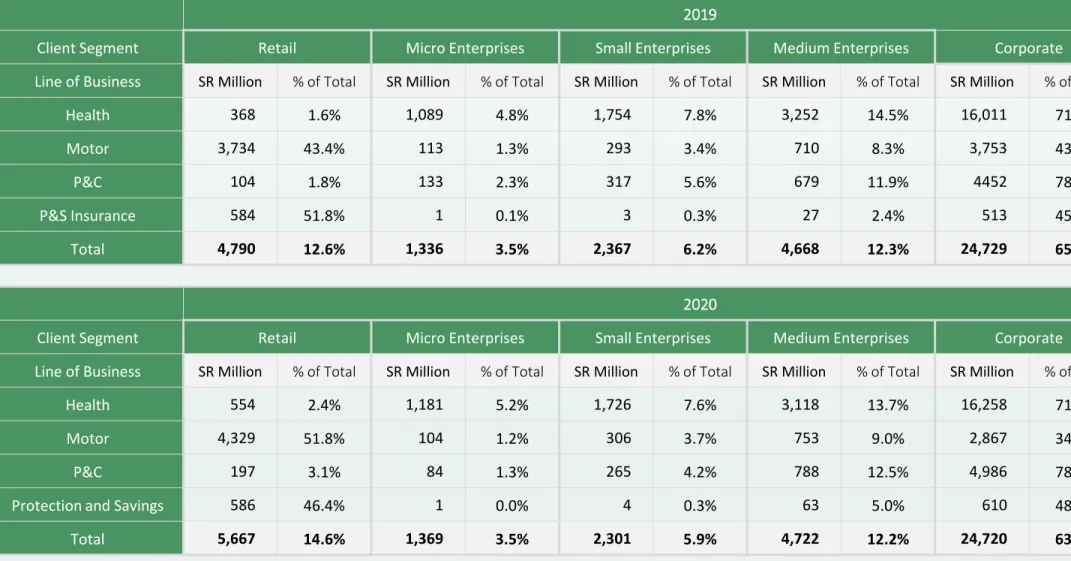
• Retail insurance GWP totaled SR 5.67 Billion, representing 14.6% share of total market GWP in 2020. Under motor insurance, individual policyholders represent 51.8% share of total motor premium.
• Micro enterprises, small enterprises, and medium enterprises insurance represents 3.5%, 5.9%, and 12.2%
share of total market GWP respectively.
• Large Enterprises’ insurance represents 63.7% of total market GWP. Under health insurance, large enterprises’
premium totaled SR 16.26 Billion, representing 71.2% of total health insurance GWP.
% of Total GWP
12.64%
3.53%
6.25%
12.32%
65.27%
14.61%
3.53% 5.93%
12.18%
63.75%
Retail Micro Enterprises Small Enterprises Medium Enterprises Corporate
GWP by Client Segment
2019 2020
Gross Written Premiums by Geographic Regions
% of Total GWP
•
Central region remained the highest in GWP reaching a 50% share of total GWP in 2020
•
Western region stood in second place with a 31% share of total GWP in 2020 compared to 26% in 2019.
•
Eastern region’s share of total GWP decreased from 20%
in 2019 to reach 16% in 2020.
4%
20%
26%
50%
2%
16%
31%
50%
0%
10%
20%
30%
40%
50%
60%
Other Eastern Westren Central
GWP by Geographic Regions
2019 2020
GWP by Distribution Channel
% of Total GWP
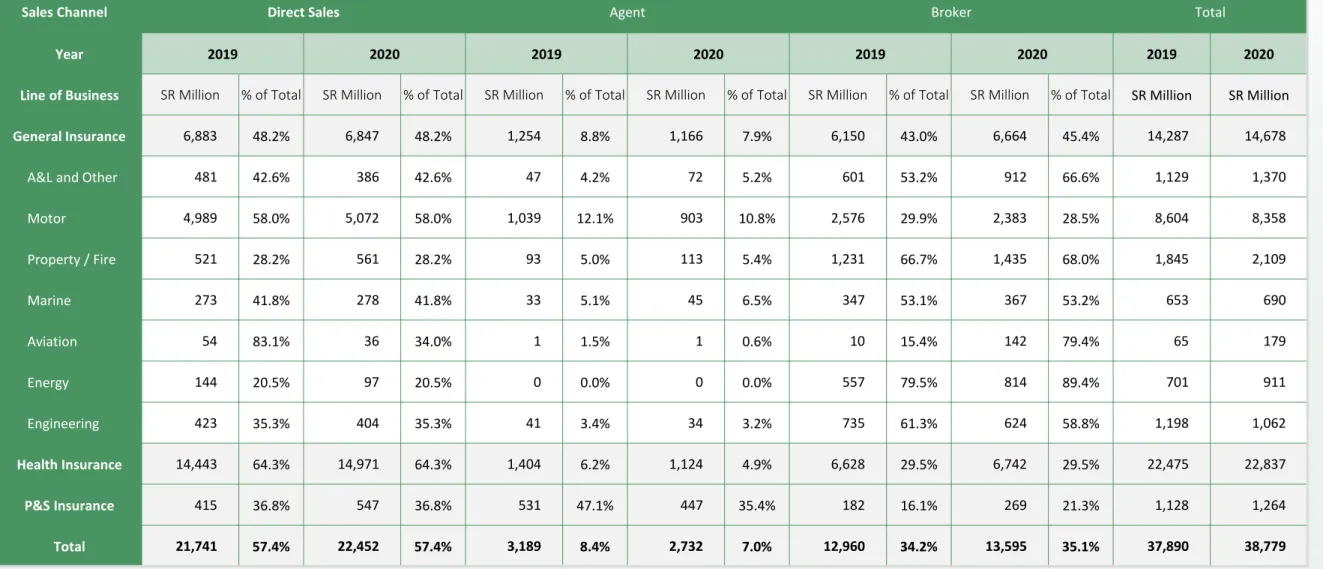
• Direct sales remained the largest distribution channel in 2020. Its contribution to total GWP in 2020 reached 57.9%
compared to 57.4% in 2019.
• Sales through brokers increased from 34.2% in 2019 to reach 35.2% in 2020.
57.4%
8.4%
34.2%
57.9%
7.0%
35.1%
0%
10%
20%
30%
40%
50%
60%
70%
Direct Sales Agent Broker
GWP By Distribution Channel
2019 2020
96%
93%
47%
26%
17%
22%
5%
2%
96%
94%
43%
28%
17%
12%
3%
2%
97%
94%
47%
29%
18%
17%
4%
1%
0% 20% 40% 60% 80% 100%
Health Motor A&L and Other Marine Property / Fire Engineering Aviation Energy
2018 2019 2020
Retention Ratio by Line of Business for
General and Health Insurance
Weighted average excluding Motor and Health insurance23%
Weighted average including all lines of business
83%
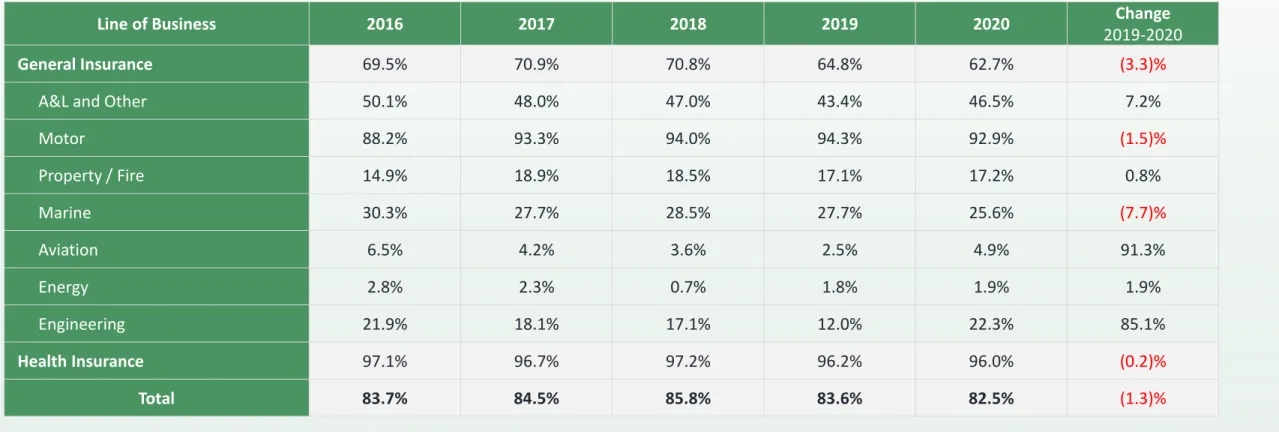
• The retention ratio measures the written premiums retained by the insurance company after excluding the reinsurers’ share, which is considered a measure of the net risk carried by the insurer. Retention ratio is calculated by dividing the NWP by the GWP.
• The overall retention ratio decreased from 84% in 2019 to 83% in 2020
• The retention for health and motor insurance classes remained high, at 96% and 93% respectively
• For other general insurance classes in aggregate, the retention ratio reached 23% in 2020 compared to 20% in 2019
Notes:
• All licensed companies are required to adhere to a minimum retention ratio of 30% of its total insurance premiums (as per Article 40 of the Implementing Regulations)
• Retention ratios are not shown for Protection & Savings insurance as the savings element of the contract must be retained by the company. Therefore retentions for Protection & Savings insurance are not directly comparable with other insurance lines of business
14,547.8 15,479.2 17,628.9 18,540.9 18,664.6 9,059.4 8,314.1
6,929.8 6,507.0 5,478.6
420.0 498.5 629.3 578.8
652.2
2,042.0 2,264.2 2,048.8 2,826.5
2,114.2
2016 2017 2018 2019 2020
Other General P&S
Motor Health
Gross Claims Paid by Line of Business
26,556
28,453
26,069 27,236
SR Million
26,910
• Total gross claims paid decreased from SR 28.45 Billion in 2019 to SR 26.91 Billion in 2020, which represents a decrease of 5.4%
• In 2020, Health gross claims paid increased by 0.7%
whereas Motor gross claims paid decreased by 15.8% over 2019
• Table 9 in the appendix contains all the gross claims paid data by line of business from 2016 to 2020
General and Health Net Earned Premiums vs. Net Claims Incurred
30,202 29,919 29,211
30,253
30,836
23,416 24,314 24,027 24,769
23,637
77.5%
81.3%
82.3%
81.9%
76.7%
73%
74%
75%
76%
77%
78%
79%
80%
81%
82%
83%
0 5,000 10,000 15,000 20,000 25,000 30,000 35,000
2016 2017 2018 2019 2020
Net Earned Premiums Vs. Net Claims Incurred
NEP NCI
Loss Ratio %NEP
• Net Earned Premiums (NEP) is equal to NWP minus the change in net unearned premium reserve
• The insurance market’s General and Health NEP totaled SR 30.84 Billion in 2020, compared to SR 30.25 Billion in 2019, an increase of 1.9%
• General and Health Net Claims Incurred (NCI), is equal to the total of net claims paid plus the change in outstanding and IBNR claims reserve
• In 2020 General and Health net claims incurred decreased by (4.6%) to reach SR 23.64 Billion
• In 2020 General and Health net Loss ratio decreased and reached 76.7% from 81.9% in 2019
Market Profitability
• Underwriting result is equal to insurance revenues including insurance investment income minus related insurance expenses.
• Shareholders Operations Results include the share of shareholders from underwriting result and the shareholder investment income minus others G&A expense.
• The net result is equal to the sum of revenues minus the sum of expenses and Zakat & Tax.
• In 2020, the underwriting result increased by 94.1% to reach SR 1,848 million, compared to 952 million in 2019.
• Shareholders operations’ results increased to SR 1,916 million in
2020,reprensting a 50.3% growth compared to SR 1,274 million in 2019.
• The insurance market’s net result increased by 61.6% to 1,386 million in 2020, compared to SR 858 million in 2019.
• Return on Assets (ROA) is the ratio of net result to total assets. In 2020, insurance market’s ROA was 2.05%
• Return on Equity (ROE) is the ratio of net result to total equity. In 2020, insurance market’s ROE was 7.52%
952
1,274
858
1,848 1,916
1,386
Underwriting Result Income from Shareholders Operations
Net Result
Insurance Market Profitability
2019 2020
1.34%
5.27%
2.05%
7.52%
Insurance Market ROA/ROE
2019 2020
Balance Sheet - Policyholders’ Assets
• Total Policyholders’ assets amounted to SR 46.33 Billion in 2020 compared to SR 44.59 Billion in 2019
• Investments accounted for the largest share of policyholders’ assets, with a value of SR 17.46 Billion in 2020 compared to SR 16.21 Billion in 2019
• At the end of 2020 insurance companies held SR 4.88 Billion in cash and cash equivalents in their policyholders’ accounts compared to SR 5.48 Billion in 2019
* Other investments consists mainly of investments in funds related to saving products
General and Health Insurance
Protection and
Savings Insurance Total Insurance
2019 2020 2019 2020 2019 2020
Cash and cash equivalents 5,209,090 4,669,582 273,422 210,869 5,482,512 4,880,451 Receivables, net 8,102,764 10,510,947 215,915 322,373 8,318,678 10,833,320 Reinsurance recoverables 9,662,429 8,700,784 423,120 521,191 10,085,549 9,221,975 Deferred policy acquisition cost 775,122 845,335 4,212 4,878 779,334 850,213
Prepaid expenses 980,337 1,497,107 2,058 8,624 982,395 1,505,731
Investments 13,192,386 14,198,588 3,015,187 3,261,042 16,207,573 17,459,629 Deposits at financial
institutions 9,735,284 9,138,054 86,964 68,141 9,822,248 9,206,195
Loans - - - - - -
Debt securities and fixed
income 2,699,798 3,593,212 9,844 9,888 2,709,642 3,603,100
Shares (common, preferred) 260,279 317,788 - - 260,279 317,788
Real estate 9,861 62,138 - - 9,861 62,138
Investment in subsidiaries &
affiliates - - 996,927 - 996,927 -
Other 487,164 1,087,395 1,921,452 3,183,013 2,408,616 4,270,408
Tangible assets 529,323 444,479 4,364 6,143 533,687 450,622
Intangible assets 52,833 79,527 - - 52,833 79,527
Other policyholders assets 2,149,006 1,018,327 (5,140) 27,696 2,143,866 1,046,023 Total 40,653,290 41,964,676 3,933,137 4,362,816 44,586,427 46,327,491
Balance Sheet - Shareholders’ Assets
• Shareholders’ assets amounted to SR 21.32 Billion in 2020 compared to SR 19.34 Billion in 2019
• Investments accounted for the largest share of shareholders’ assets, with a value of SR 15.51 Billion in 2020 compared to SR 15.9 Billion in 2019
• At the end of 2020, insurance companies’ shareholders held SR 2.87 Billion in cash and cash equivalents compared to SR 1.7 Billion in 2019
• Insurance companies’ total assets amounted to SR 67.64 Billion in 2020 compared to SR 63.93 Billion in 2019
Amount In Thousands
2019 2020
Cash and cash equivalents 1,698,302 2,868,429
Receivables, net 2,666 295
Investments 15,945,918 15,510,237
Deposits at financial institutions 8,839,169 7,516,955
Loans - -
Debt securities and fixed income 3,757,182 4,037,497
Shares (common, preferred) 1,313,413 1,583,286
Real estate 7,025 5,435
Investment in subsidiaries & affiliates 202,001 215,195
Other 1,827,129 2,151,869
Tangible assets 265,681 375,555
Accrued interest, rent, income 101,116 135,251
Intangible assets 953,166 1,121,397
Distributions due from policyholders account 540,716 991,871
Other shareholders assets (168,670) 311,995
Total Shareholders Assets 19,338,896 21,315,029
Balance Sheet - Policyholders’ Liabilities and Equity
• At the end of 2020, insurance companies held SR 32.41 Billion in technical reserves, which consist of unearned premiums, outstanding claims, IBNR and adjustment expense reserves, compared to SR 33.1 Billion in 2019
• Mathematical reserves amounted to SR 3.37 Billion in 2020 compared to SR 3.19 Billion in 2019
• Total policyholders’ liabilities and allocated surplus amounted to SR 46.33 Billion in 2020 compared to SR 44.59 Billion in 2019
Amount In Thousands Policy
General and Health Insurance Protection and Savings
Insurance Total Insurance
2019 2020 2019 2020 2019 2020
Total Policyholders liabilities 39,848,295 41,295,794 3,870,737 4,275,897 43,719,032 45,571,692
Policyholders payables 1,159,536 1,001,986 19,550 22,538 1,179,086 1,024,524
Reinsurance balances payable 1,861,493 1,756,375 83,085 88,993 1,944,578 1,845,367
Technical reserves 32,658,465 31,778,526 446,074 628,676 33,104,540 32,407,202
Unearned premium 16,009,879 16,518,420 103,708 125,561 16,113,588 16,643,981
Outstanding claims, IBNR
and adjustment expenses 16,648,586 15,260,106 342,366 503,115 16,990,952 15,763,221
Mathematical reserves 3,190,892 3,372,983 3,190,892 3,372,983
Other reserves 430,305 861,263 3,529 10,556 433,834 871,818
Unearned reinsurance commissions 249,521 283,354 2,547 2,207 252,069 285,561
Accrued expense and deferred income 2,080,082 3,412,480 85,272 118,674 2,165,354 3,531,154
Declared dividend payable - - - -
Distribution due to shareholders account 515,870 977,894 24,846 13,977 540,716 991,871
Other policyholders liabilities 893,022 1,223,918 14,942 17,293 907,964 1,241,211
Accumulated surplus 804,994 668,880 62,400 86,918 867,394 755,798
Total Policyholders liabilities and Equity 40,653,290 41,964,674 3,933,137 4,362,815 44,586,427 46,327,489
Balance Sheet - Shareholders’ Liabilities and Equity
• At the end of 2020, shareholders’ liabilities decreased to SR 2.88 Billion from SR 3.07 Billion in 2019 while
shareholders’ equity increased to SR 18.44 Billion in 2020 compared to SR 16.27 Billion in 2019
• Share capital increased to SR 12.49 Billion in 2020 compared to SR 12.4 Billion in 2019
• Shareholders’ liabilities and equity increased to SR 21.32 Billion in 2020 compared to SR 19.34 Billion in 2019
Amount In Thousands
Policy 2019 2020
Total Shareholders liability 3,065,329 2,876,783
Shareholders payables 345,827 303,481
Zakat 1,041,592 1,182,076
Accrued expenses and deferred income 182,829 189,100
Other shareholders liabilities 1,495,080 1,202,127
Total Shareholders equity 16,273,567 18,438,246
Share capital 12,402,667 12,488,539
Statutory reserves 2,544,807 2,726,161
Retained earnings 1,109,539 2,599,571
Other shareholders equity 216,554 623,975
Total Shareholders Liabilities & Equity 19,338,896 21,315,029 Total Liabilities & Equity 63,925,323 67,642,519
Insurance Market Performance By
Line of Business
22,475
21,622
20,899
18,345 22,837
21,925 21,789
17,991
1.6% 1.4% 4.3%
(1.9%)
GWP NWP NEP NCI
Health
2019 2020
Health Insurance
MillionSR
• Health insurance, which includes both compulsory and non- compulsory lines, accounted for 58.9% of the 2020 total market gross written premiums (GWP) with SR 22.84 Billion in underwritten premiums
• Health insurance accounted for 68.3% of the market’s net written premiums (NWP) as insurance companies retained SR 21.92 Billion of their Health insurance GWP, which was the highest of all business lines representing a 96%
retention ratio
• Health insurance’s net earned premiums (NEP) registered SR 21.79 Billion, representing 68.8% of the insurance market’s NEP.
• Health insurance’s net claims incurred (NCI) amounted to SR 17.99 Billion, and resulted in a loss ratio of 82.6%
% of Total
GWP NWP NEP NCI
2019 59.3% 68.3% 67.5% 72.5%
2020 58.9% 68.5% 68.8% 74.1%
Retention Ratio Loss Ratio
1,134.9
797.2
717.9
531.3 1,263.6
859.4 854.6
640.0 11.3%
7.8% 19.0%
20.5%
GWP NWP NEP NCI
P&S
2019 2020
Protection and Savings Insurance
Retention ratio and loss ratio are not shown due to the savings part of the premium which distorts the ratios
MillionSR
• Protection and Savings insurance’s GWP totaled SR 1.26 Billion in 2020, which represents a 3.3% contribution to the market’s total business volume.
• Protection and Savings insurance accounted for 2.7% of the market’s NWP, as insurance companies retained SR 859.4 Million of GWP.
• Protection and Savings insurance’s NEP registered SR 854.6 Million, which represents a share of 2.7% of total NEP.
• Protection and Savings insurance accounted for 2.7% of total market’s NCI in 2020 and amounted to SR 640 Million.
% of Total
GWP NWP NEP NCI
2019 3.0% 2.5% 2.3% 2.1%
2020 3.3% 2.7% 2.7% 2.6%
8,603.6
8,117.1 8,211.1
5,999.8 8,358.0
7,763.5 7,761.9
5,171.5 (2.9%)
(4.4%) (5.5%)
(13.8%)
GWP NWP NEP NCI
Motor
2019 2020
Motor Insurance
MillionSR
• Motor insurance’s GWP totaled SR 8.36 Billion in 2020, which represents a 21.6% share of total market GWP
• Insurance companies retained 92.9% of their Motor
underwritten premiums Motor insurance NWP totaled SR 7.76 Billion
• Motor insurance’s NEP amounted to SR 7.76 Billion and accounted for 24.5% of the insurance market’s NEP
• Insurance companies recorded SR 5.17 Billion in Motor insurance’s NCI and resulted in a loss ratio of 66.6%
% of Total
GWP NWP NEP NCI
2019 22.7% 25.6% 26.5% 23.7%
2020 21.6% 24.3% 24.5% 21.3%
Retention Ratio Loss Ratio
MillionSR
Property/ Fire Insurance
• Property/ Fire insurance’s GWP totaled SR 2.1 Billion in 2020, which represents a 5.4% share of total market GWP
• Insurance companies retained 17.2% of their Property/ Fire insurance premiums, as the business line’s NWP amounted to SR 362.7 Million. Property/ Fire insurance contributed 1.1% to total market NWP in 2020
• Property/ Fire insurance’s NEP amounted SR 322.8 Million
• Insurance companies recorded SR 161.1 Million in Property/ Fire insurance’s NCI, and resulted in a loss ratio of 49.8%
1,844.6
314.6 316.7
118.1 2,109.2
362.7 322.8
161.1 14.3%
15.3% 1.9%
36.3%
GWP NWP NEP NCI
Property / Fire
2019 2020
% of Total
GWP NWP NEP NCI
2019 4.9% 1.0% 1.0% 0.5%
2020 5.4% 1.1% 1.0% 0.7%
Retention Ratio Loss Ratio
2019 17.1% 37.3%
2020 17.2% 49.9%
MillionSR
Engineering Insurance
• Engineering insurance’s GWP totaled SR 1.06 Billion in 2020, which represent a 2.7% contribution to total market GWP
• Insurance companies retained 22.3% of their Engineering underwritten premiums. Engineering insurance NWP amounted SR 236.5 Million
• Engineering insurance NEP amounted to SR 181.1 Million and accounted for 0.6% of the insurance market’s NEP
• Engineering insurance recorded a loss ratio of 21.6%, with NCI, totaling SR 39.1Million
1,198.4
144.2 139.6
59.3 1,061.8
236.5
181.1
39.1 (11.4%)
64.0%
29.7%
(34.1%)
GWP NWP NEP NCI
Engineering
2019 2020
% of Total
GWP NWP NEP NCI
2019 3.2% 0.5% 0.5% 0.2%
2020 2.7% 0.7% 0.6% 0.2%
Retention Ratio Loss Ratio
MillionSR
A&L and Other Insurance
MillionSR
• Accident and Liability (A&L) insurance includes the following lines of business: personal accident, work related, employer’s liability, third party liability, general liability, product liability, medical liability, professional liability, theft & burglary, fidelity, safe burglary inside the premises and in transit and other liability products
• Insurance companies underwritten SR 1.37 Billion in A&L and Other general insurance premiums in 2020
• Insurance companies retained SR 6372 Million of A&L and Other general insurance underwritten premiums, with a 46.5% retention ratio
• A&L and Other general insurance NEP totaled SR 586.2 Million, which represents a 1.8% contribution to market’s NEP
• Insurance companies recorded SR 176.2 Million in A&L and Other general insurance’s NCI, and resulted in a loss ratio of 30.1%
1,121.4
486.6 496.8
176.5 1,369.9
637.2
586.2
176.2 22.2%
31.0% 18.0%
(0.2%)
GWP NWP NEP NCI
A&L and Other
2019 2020
% of Total
GWP NWP NEP NCI
2019 3.0% 1.5% 1.6% 0.7%
2020 3.5% 2.0% 1.8% 0.7%
Retention Ratio Loss Ratio
2019 43.4% 35.5%
2020 46.5% 30.1%
MillionSR
Marine Insurance
• The Marine insurance line of business includes both marine cargo and marine hull insurance
• Marine insurance GWP totaled SR 690 Million in 2020, which represents a 1.8% contribution to market’s GWP
• Insurance companies retained 25.6% of their Marine insurance underwritten premiums, as the business line’s NWP amounted to SR 176.6 Million
• Marine insurance’s NEP recorded SR 171.7 Million, which represents a 0.5% share of market’s NEP in 2020
• Marine insurance’s NCI amounted to SR 83.2 Million.
This resulted in a loss ratio of 48.5%
653.6
181.2 176.5
65.8 690.0
176.6 171.7
83.2 5.6%
(2.5%)
(2.7%)
26.5%
GWP NWP NEP NCI
Marine
2019 2020
% of Total
GWP NWP NEP NCI
2019 1.7% 0.6% 0.6% 0.3%
2020 1.8% 0.6% 0.5% 0.3%
Retention Ratio Loss Ratio
2019 27.7% 37.3%
MillionSR
Energy Insurance
• In 2020, Energy insurance GWP totaled SR 910.8 Million, which represents a 2.3% share of total market’s GWP
• Energy insurance NWP amounted to SR 16.9 Million, accounting for only 0.05% of the insurance market’s NWP
• Energy insurance’s NEP amounted to SR 14.5 Million, accounting for only 0.05% of the insurance market’s NEP
• Energy insurance’s NCI amounted to SR 16 Million. This resulted in a loss ratio of 110.2%
700.4
12.8 7.8 3.0
910.8
16.9 14.5 16.0
30.0%
32.5% 85.7% 424.3%
GWP NWP NEP NCI
Energy
2019 2020
% of Total
GWP NWP NEP NCI
2019 1.8% 0.04% 0.03% 0.01%
2020 2.3% 0.05% 0.05% 0.07%
Retention Ratio Loss Ratio
2019 1.8% 39.0%
2020 1.9% 110.2%
MillionSR
Aviation Insurance
• Aviation insurance GWP reached SR 178.6 Million in 2020, a 0.5% contribution to market’s GWP
• NWP for Aviation insurance reached SR 8.7 Million, resulting in a retention ratio of 4.9%
• Aviation insurance’s NEP totaled SR 7.9 Million, accounting for only 0.02% of the insurance market’s NEP
• Aviation insurance’s NCI amounted to SR (0.6) Million, resulting in a loss ratio of (7%)
158.5
4.0 5.4 1.4
178.6
8.7 7.9
(0.6) 12.7%
115.6% 45.7%
(139.3%)
GWP NWP NEP NCI
Aviation
2019 2020
% of Total
GWP NWP NEP NCI
2019 0.4% 0.01% 0.02% 0.01%
2020 0.5% 0.03% 0.02% 0.00%
Retention Ratio Loss Ratio
2019 2.5% 25.9%
Other Market Indicators
777.5 780.8
502.6 521.1 560.2
690.6 762.8
615.8
769.7
1,180.7
24.3 30.5
19.4
52.7
73.9
306.6 299.3
264.9
420.0
456.4
2016 2017 2018 2019 2020
Other General P&S Health
Gross Commissions Incurred by Line of Business
1,873
1,799 1,764
1,402
SR Million
Motor Health P&S Other General
Growth
7.5% 53.4% 40.2% 8%
2,271
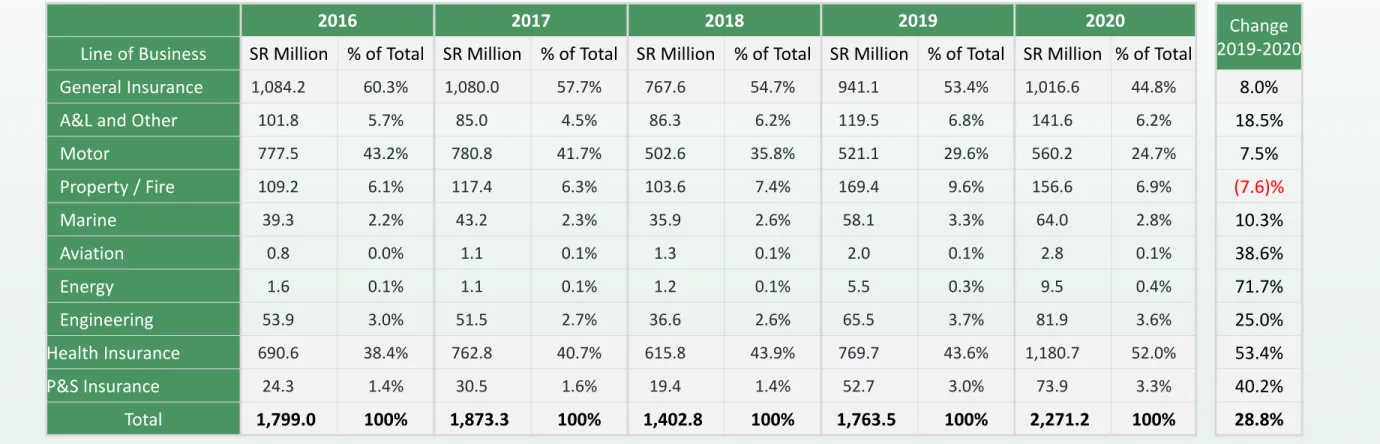
• Total commissions incurred amounted to SR 2.27 Billion in 2020, compared to SR 1.76 Billion in 2019, which represents an increase of 28.8%
• General insurance related commissions accounted for 44.8% of total commissions incurred in 2020
• Health insurance’s share of total commissions incurred represented 52% in 2020
• Protection and Savings insurance’s commissions incurred was 3.3% of total commissions incurred in 2020
Employees of Insurance Companies by Nationality
• The total number of insurance companies’ employees in Saudi Arabia was 11,015 in 2020, compared to 11,213 in 2019
• The ratio of Saudi nationals employed by insurance companies in 2020increased to 75% of the total workforce
• The Saudization ratio for non-managerial positions in 2020 increased to 79%, while the Saudization ratio for managerial positions increased to 65%
• Note: A newly-licensed insurance company is required to adhere to a Saudization ratio of 30% at the end of its first year of operation and shall increase the ratio annually, according to its Saudization plan (as per Article 79 of the Implementing Regulations)
2019 Total
2019
2020 Total
Nationality Non-Managerial Managerial Non-Managerial Managerial 2020
Non-Saudi 1,924 955 2,879 1,814 889 2,703
Saudi 6,913 1,421 8,334 6,645 1,667 8,312
Total 8,837 2,376 11,213 8,459 2,556 11,015
Saudization Ratio 78% 60% 74% 79% 65% 75%
74% 75%
Saudization in insurance sector
60%
78%
65%
79%
Saudization Ratio in by Managerial position
Non-Managerial Managerial
2020 2019
2020 2019
Employees of Insurance intermediaries by Nationality
• The total number of employees in insurance intermediaries was 6,139 in 2020.
• The percentage of Saudi nationals employed in insurance intermediaries was 74% in 2020
• The Saudization percentage in non-managerial positions in 2020 was 76%,
while the Saudization ratio in managerial positions was 67%. 20%
40%
60%
80%
Saudization Ratio
Saudization Ratio
20%
40%
60%
80%
Saudization in Non-Managerial Positions
Saudization in Managerial Positions
Saudization Ratio by Managerial position
67%
2020 Total
Nationality Non-Managerial Managerial 2020
Non-Saudi 1,207 370 1,577
Saudi 3,810 752 4,562
Total 5,017 1,122 6,139
Saudization Ratio 76% 67% 74%
76%
74%
9,382 795
935 1,418
1,473
2,535 2,733
9,062
10,447
9,860 834
793 1,410 1,215
2,421 2,570
8,376
10,411
9,541 950
722
1,446 1,105
2,069
2,974
7,641
8,567
0 2000 4000 6000 8000 10000 12000
Gross Written Premiums by Company
2018 2019 2020
Insurance Market Structure
Remaining 22 Companies
Company 8 Comapny5 Comapny4 Comapny3 Company2 Company1
Comapny6 Comapny7
• In 2020, the top 8 insurance companies generated 75.8% of the insurance market’s GWP
• The remaining 22 insurance companies included in the report accounted for the remaining 24.2% of total market
premiums