Saudi Arabian Monetary Agency – Insurance Supervision Department
The Saudi Insurance Market Report
2011
Introduction 4 Insurance Market Performance - Overall
– Gross Written Premiums 6
– Insurance Penetration 7
– Insurance Density 8
– Gross Written Premiums by Line of Business 9
– Net Written Premiums by Line of Business 11
– Retention Ratio by Line of Business 13
– Gross Claims Paid by Line of Business 14
– General and Health Net Earned Premiums vs. Net Claims Incurred 15
– Market Profitability 16
– Balance Sheet - Policyholders’ Assets 17
– Balance Sheet - Shareholders’ Assets 18
– Balance Sheet - Policyholders’ Liabilities and Equity 19
– Balance Sheet - Shareholders’ Liabilities and Equity 20
Insurance Market Performance - By Line of Business
– Health Insurance 22
– Protection and Savings Insurance 23
– Motor Insurance 24
– Property/ Fire Insurance 25
Table of Contents
Table of Contents
– Engineering Insurance 26
– A&L and Other Insurance 27
– Marine Insurance 28
– Energy Insurance 29
– Aviation Insurance 30
Other Market Indicators
– Commissions Incurred by Line of Business 32
– Employees Breakdown by Nationality 33
– Insurance Market Structure 34
– Capitalization of Insurance Companies 35
Appendix: Data Tables
– Table 1: Gross Written Premiums by Line of Business 37
– Tables 2 & 3: Insurance Penetration and Density 38
– Table 4: Net Written Premiums by Line of Business 39
– Table 5: Retention Ratio by Line of Business 40
– Table 6: Gross Claims Paid by Line of Business 41
– Table 7: Commissions Incurred by Line of Business 42
Introduction
Introduction
Introduction
In 2011, Gross Written Premiums (GWP) in the Saudi insurance market reached SR 18.504 Billion, up from SR 16.387 Billion in 2010.
This represents an increase of 12.9%, compared to a 12 % growth rate in 2010:
– Health insurance GWP, which represent 52.5% of the insurance market, increased by 11.7% to SR 9.708 Billion in 2011 compared to SR 8.690 Billion in 2010
– General insurance GWP, which represent 43% of the insurance market, increased by 17.3% to SR 7.890 Billion in 2011 compared to SR 6.725 Billion in 2010
– Protection & savings (P&S) insurance GWP, which represent 5% of the insurance market, decreased by 6.9% to SR 0.905 Billion in 2011 compared to SR 0.972 Billion in 2010
Insurance Market Performance - Overall
Insurance Market Performance - Overall
Gross Written Premiums
Gross Written Premiums (2007 to 2011, SR Million)
% Growth 2010–11
-6.9%
11.7%
17.3%
12.9%
3,065
4,805
7,292
8,690
9,708 1,003
972
905
2011 18،504
7،890
2010 16,387
6,725
2009 14,610
6,315
2008 10,919
594
2007 8,583
5,191 327
5,520
General Health P&S
The overall insurance Gross Written Premiums increased by SR 2.117 Billion to reach SR 18.504 Billion(1)in 2011, compared to SR 16.387 Billion in 2010, which represents a growth rate of 12.9%
Health insurance remained the biggest line of business in 2011. Its contribution to total GWP slightly decrease from 53% in 2010 to 52.5%
in 2011, while General insurance’s contribution to total business volume increased from 40.7% in 2010 to 42.6% in 2011
Health insurance accounted for SR 1.100 Billion of the SR 2.117 Billion increase, which represents a 52.5% contribution to the market’s GWP increase
Protection and Savings insurance remained the smallest line of
business accounting for 5% of total GWP, with a decrease in its written premiums by 6.9% in 2011
In SR Million
2007 2008 2009 2010 2011
SR (M) % Total SR (M) % Total SR (M) % Total SR (M) % Total SR (M) % Total
Protection &
Savings 327 4% 594 5% 1,003 7% 972 6% 905 5%
Health 3,065 36% 4,805 44% 7,292 50% 8,690 53% 9,708 52%
General 5,191 60% 5,520 51% 6,315 43% 6,725 41% 7,890 43%
Total 8,583 100% 10,919 100% 14,610 100% 16,387 100% 18,504 100%
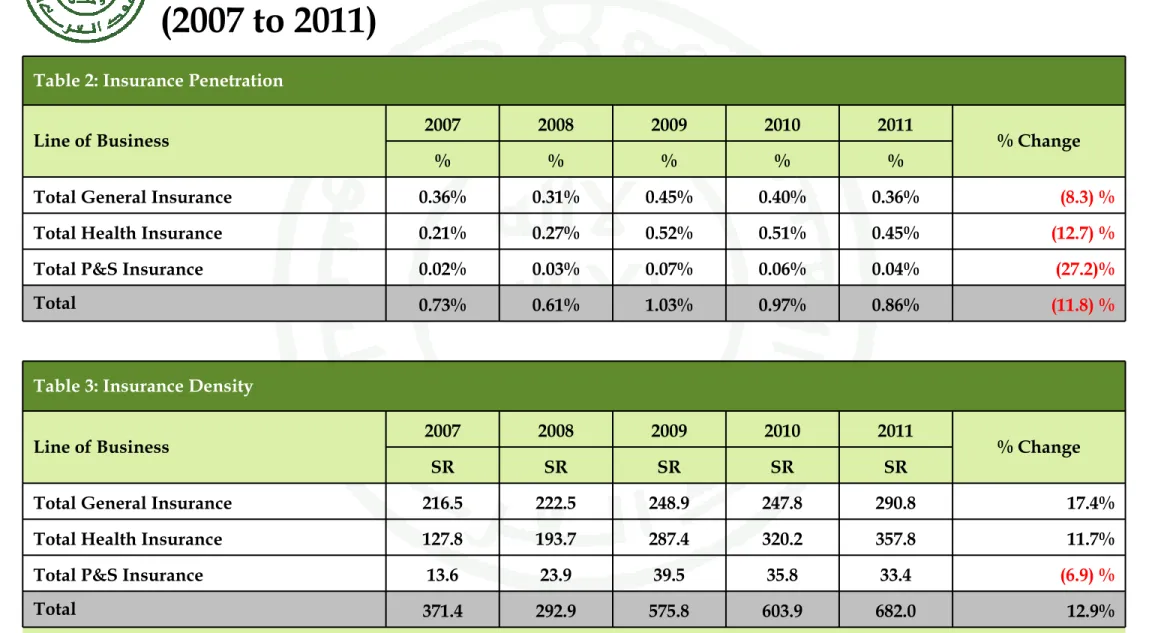
Insurance Penetration
Insurance penetration of total Gross Domestic Product (GDP) is defined as Gross Written Premiums divided by the total GDP
Over the past five years, insurance penetration has been growing at a
compounded annual growth rate (CAGR) of 10%
In 2011, insurance penetration decreased to 0.85%, down from 0.97% in 2010. This is mainly due to a strong growth in total GDP (28% in 2011 compared to 18.6% in 2010). The oil sector accounted for a significant part of this growth
Insurance penetration of non-oil GDP is defined as Gross Written Premiums divided by non-oil GDP
Insurance penetration of non-oil GDP decreased to 2.02%, from 2.07% in 2010 Insurance penetration of non-oil GDP has
grown at an average annual rate of 11%
between 2007 and 2011
+11%
2011 2.02%
0،10
% 1.06%
0.86%
2010 2.07%
0.12%
1.10%
0.85%
2009 1.99%
0.14%
0.99%
0.86%
2008 1.59%
0.09%
0.70%
0.80%
2007 1.34%
0.05%
0.48%
0.81%
Insurance Penetration of Non-Oil GDP(2) (2007 to 2011, % of Non-Oil GDP)
0.52% 0.51% 0.45%
0.27%
0.21%
0.61%
0.07%
0.85%
0،04
% 2011 +10%
2008
0.45%
0،36
% 1.04%
0.40%
2009 2010
0.97%
0.06%
0.03%
0.31%
2007 0.59%
0.02%
0.36%
(1) Total GDP of SR 1,443 SR 1,786 SR 1,413 SR 1,690 and SR 2,163 Billion in 2007, 2008, 2009, 2010, and 2011, respectively (2) Non-oil GDP of SR 642 SR 690 SR 738 SR 792 and SR 919 Million in 2007, 2008, 2009, 2010, and 2011 respectively
Insurance Penetration of Total GDP(1) (2007 to 2011, % of Total GDP)
% Growth 2010–11
-10 %
-33%
-12%
-12 %
% Growth 2010–11
1 %
-17 % -2%
-4 % Total General Insurance
Total Health Insurance Total P&S Insurance Total P&S Insurance Total Health Insurance Total General Insurance
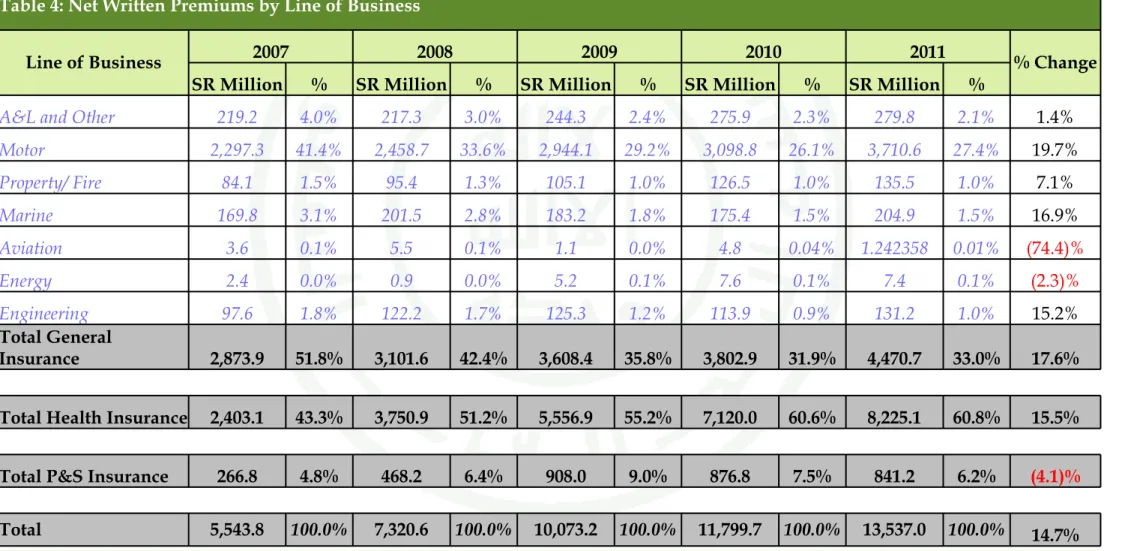
Insurance Density
Insurance density is defined as Gross Written Premiums per Capita. Insurance density increased from SR 604 per Capita in 2010 to SR 682 per capita in 2011, which represents a 13% increase
Expenditures per Capita on insurance products have increased by an average annual rate of 17% between 2007 and 2011 The density of Protection and Savings
insurance remained low in absolute terms, and relative to General and Health
insurance, at SR 33 per Capita
40 33
128
194
287 320 358
36 +17%
2011 682
291
2010 604
248
2009 576
249
2008 440
24 222
2007 358
14 216
Insurance Density(1) (2007 to 2011, SR per Capita)
% Growth 2010–11
17.3 %
-8.3%
12.9%
11.9%
Total P&S Insurance Total General Insurance Total Health Insurance
Motor and Health insurance accounted for around 73.7% of total GWP in 2011
Health insurance, which includes both compulsory and non-compulsory lines of business, remained the largest line of business in 2011,
accounting for 52.5% of total GWP
Motor compulsory and non- compulsory lines of business stood in second place with a 21.2% share of total GWP
Marine insurance underwritten premiums grew by 22.4%
which is the highest growth among all line of business Aviation underwritten
premiums decreased by 10.6%
compared to 2010
Gross Written Premiums by Line of Business
(1) A&L stands for Accidents and Liabilities insurance throughout the document In SR
Million
2007 2008 2009 2010 2011 Growth
SR M % Total SR M % Total SR M % Total SR M % Total SR M % Total %
Aviation 114 1% 139 1% 174 1% 305 2% 272 1.5% -10.6%
Energy 305 4% 208 2% 302 2% 329 2% 361 2.0% 9.8%
A&L and
Other 577 7% 531 5% 544 4% 507 3% 632 3.4% 24.6%
Marine 532 6% 620 6% 525 4% 518 3% 634 3.4% 22.4%
P&S 327 4% 594 5% 1,003 7% 972 6% 905 4.9% -6.9%
Engineerin
g 480 6% 682 6% 810 6% 869 5% 913 4.9% 5.0%
Property/
Fire 742 9% 798 7% 905 6% 959 6% 1,157 6.3% 20.7%
Motor 2,440 28% 2,542 23% 3,055 21% 3,239 20% 3,922 21.2% 21.1%
Health 3,065 36% 4,805 44% 7,292 50% 8,690 53% 9,708 52.5% 11.7%
Total 8,583 100% 10,919 100% 14,610 100% 16,387 100% 18,504 100% 12.9%
Gross Written Premiums by Line of Business (continued)
2,440
2,542
3,055
3,239
3,922 905
959
1,157 810
869
913
798
905 972
1,003
327
329 302
208 305
174
139
2010 16,387
8,690 507 518305
18,504
7,292 544 525
2008 10,919
4,805 594 682620 531
2007 8,583
+21%
2011 9,708
634
2009 14,610
632 361 304
3,065 742 480 532 577 114
P&S Energy
A&L and Other Marine
Health Engineering Motor
Property/ Fire Aviation Gross Written Premiums by Line of Business
(2007 to 2011, SR Million)
Net Written Premiums (NWP) is defined as the premiums retained by the insurance company, after the subtraction of the premiums ceded to local or international reinsurers from GWP by line of business
Total NWP increased from SR 11.800 Billion in 2010 to SR 13.537 Billion in 2011, a 14.7% increase Around 88.2% of total NWP in 2011
was generated by Health and Motor insurance
Health insurance remained the largest line of business accounting for 60.8% of total NWP
Motor insurance share of total NWP remained in second place.
Motor insurance accounted for 27.4% of NWP in 2011, up from 26% in 2010
Net Written Premiums by Line of Business
In SR Million
2007 2008 2009 2010 2011 Growth
SR M % Total SR M % Total SR M % Total SR M % Total SR M % Total %
Aviation 4 0% 6 0% 1 0% 5 0% 1 0.0% -74.4%
Energy 2 0% 1 0% 5 0% 8 0% 7 0.1% -2.3%
Engineeri
ng 98 2% 122 2% 125 1% 114 1% 131 1.0% 15.2%
Property/
Fire 84 2% 95 1% 105 1% 127 1% 136 1.0% 7.1%
Marine 170 3% 201 3% 183 2% 175 1% 205 1.5% 16.9%
A&L and
Other 219 4% 217 3% 244 2% 276 2% 280 2.1% 1.4%
P&S 267 5% 468 6% 908 9% 877 8% 841 6.2% -4.1%
Motor 2,297 41% 2,459 34% 2,944 29% 3,099 26% 3,711 27.4% 19.7%
Health 2,403 43% 3,751 51% 5,557 55% 7,120 61% 8,225 60.8% 15.5%
Total 5,544 100% 7,321 100% 10,073 100% 11,800 100% 13,537 100% 14.7%
Net Written Premiums by Line of Business (continued)
2,297
2,459
2,944
3,099
3,711 908
877
841 276
244
136
98
+25%
2011 13,537
8،225 205 280
2010 11,800
7,120 175 127
2009 10,073
3,751 468 217 201
2007 5,544
2,403 267 219
7,321
105
5,557
2008
183
Net Written Premiums by Line of Business (2007 to 2011, SR Million)
Health Motor P&S
A&L and Other Marine
Property/ Fire Engineering Energy Aviation
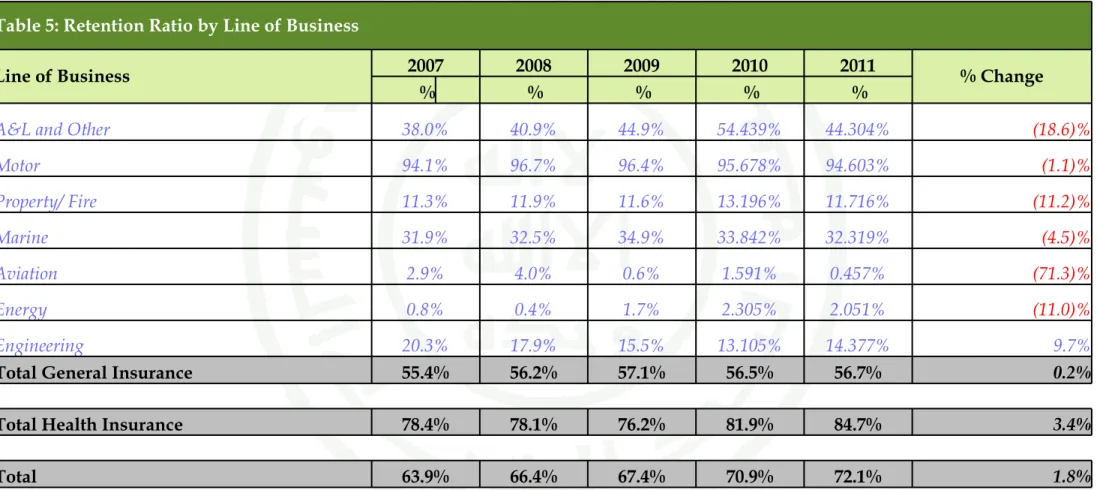
Retention Ratio by Line of Business
The retention ratio measures the written premiums retained by the insurance company. It is calculated by dividing the NWP by the GWP
The overall retention ratio of insurance companies in the Saudi market increased to 72.1% in 2011 compared to 70.9% in 2010. This ratio is largely skewed due to the high retention ratio of Motor and Health insurance which collectively account for around 73.7% of total GWP. In 2011, the retention ratios for Motor and Health insurance were 95% and 85%, respectively
The weighted average retention ratio of other insurance lines of business (i.e., excluding Motor and Health insurance) decreased to 19% in 2011 compared to 2010 Notes:
- Newly licensed companies are required to adhere to a minimum retention ratio of 30% (as per Article 40 of the Implementing Regulations)
- Retention ratios are not shown for Protection &
Savings insurance as the savings element of the contract must be retained in the Saudi Arabian company. Therefore retentions for Protection &
Savings insurance are not directly comparable with other insurance lines of business
96%
76%
45%
35%
15%
12%
1%
2%
2%
2%
13%
13%
34%
54%
82%
96%
0%
2%
Aviation Energy Property/ Fire
12%
Engineering
14%
Marine
32%
A&L & Other
44%
Health
85%
Motor
95%
72.1%
19%
Retention Ratios by Line of Business (2009 to 2011, % of GWP)
2011 2010 2009 Weighted average excluding
Motor and Health insurance Weighted average
including all lines of business
Total gross claims paid increased by 37% from SR 8.42 Billion in 2010 to SR 11.49 Billion in 2011
In 2011, Health and Motor gross claims paid grew by 45.1% and 34.1%, respectively compared to 2010 figures
In 2011, P&S insurance recorded the highest growth rate in gross claims paid, after increasing by 114.7%
from SR 136.2 Million to SR 292.5 Million
Table 6 in the appendix contains all the gross claims data by line of business from 2007 to 2011
Gross Claims Paid by Line of Business
Gross Claims Paid by Line of Business (2007 to 2011, SR Million)
1,218
1,492
1,621
1,882
2,730 226
570 +30%
2011 11,485
7,297 527 293
2010 8,514
5,440 136 276
2009 4,061
1,898 166
4,010 7,255 169 98
2008 5,224
2,839 140 27
2007
% Growth 2010–11
Total
P&S Motor
Property/ Fire Health
Engineering Marine
A&L and Other Energy
Aviation
34.9%
17.9%
-40.6%
59.9%
-25.6%
42.1%
114.7%
32.8%
45.1%
34.1%
General and Health Net Earned Premiums vs. Net Claims Incurred
11,668
9,517 7,966
5,983 4,628
8,382 6,510
5,649 4,088
3,111
23%+
29%+
2011 2010
2009 2008
2007
NCI NEP
Net Earned Premiums Vs. Net Claims Incurred (2007 to 2011, SR Million)
Loss Ratio (% NEP) Net Earned Premiums
(NEP) is equal to NWP minus the change in net unearned premiums reserve
The insurance market’s General and Health NEP totaled SR 11.668 Billion in 2011, up from SR 9.517 Billion in 2010, which represents a 23% increase General and Health Net
Claims Incurred (NCI), i.e., the total of claims paid plus the change in outstanding and IBNR claims reserve, increased by 29% for the year 2011 to reach SR 8.382 Billion For 2011, General and
Health net claims ratio, i.e., the loss ratio, which is equal to NCI divided by NEP, increased to reach 71.8%
71.8%
68.4%
70.9%
68.3%
67.2%
1,138
159 1,234
890
70 927
Underwriting Result
-25% -22%
Investment Result Net Result -56%
2010 2011
Insurance Market Profitability (2010-2011, SR Million)
Insurance Market ROA/ ROE (2011, % of Net Result to Assets/ Equity)
9.7%
2.8%
ROE ROA
Insurance underwriting result is the outcome of subtracting all insurance related expenses from insurance revenues (NEP)
The net result is equal to the sum of revenues minus the sum of expenses
Investment income is the total investment income minus total investment expense In 2011, the insurance underwriting result
totaled SR 0.927 Billion, which represents a 25% decrease from 2010 figures
Investment income decreased to SR 70 Million in 2011 from SR 159 Million in 2010
The insurance market’s net result deceased to 0.89 Billion in 2011 from SR 1.14 Billion in 2010, which represents a 22% decrease Return on Assets (ROA) is the ratio of net
result to total assets. In 2011, insurance market’s ROA was 2.8%
Return on Equity (ROE) is the ratio of net result to total equity. In 2011, Insurance market’s ROE was 9.7%
Market Profitability
2011
Balance Sheet - Policyholders’ Assets
At the end of 2011 insurance companies held SR 3.28 Billion in cash and cash
equivalents in their policyholders’ accounts Reinsurance Recoverable
accounted for the biggest share of policyholders’
assets, with a value of SR 5.47 Billion
Total investments amounted to SR 5.29 Billion
Policyholders’
(operational) assets amounted to SR 21.12 Billion
Item Name
General and Health Insurance
Protection and
Savings Insurance Total Insurance
Cash and Cash Equivalents 3,171,199 112,794 3,283,993
Receivables, net 4,994,432 37,149 5,031,581
Reinsurance Recoverable 5,444,354 22,329 5,466,683
Deferred Policy Acquisition Costs 565,260 2,327 567,587
Prepaid Expenses 394,449 212 394,661
Investments 3,010,735 2,283,561 5,294,296
Deposits at Financial Institutions 1,414,511 440,245 1,854,756
Loans - 7,180 7,180
Debt, Securities and Fixed Income 1,020,511 - 1,020,511
Shares (common, preferred) 279,322 - 279,322
Real Estate 11,145 - 11,145
Investments in Subsidiaries and
Affiliates 104,561 - 104,561
Other* 180,684 1,836,136 2,016,820
Tangible Assets 328,190 456 328,646
Intangible Assets 4,141 - 4,141
Other Policyholders’ Assets 739,014 10,283 749,297
Total Policyholders’ Assets [1] 18,651,774 2,469,110 21,120,884
Policyholders’ Assets (2011, SR Thousand)
* Other investments consists mainly of investments in funds related to saving products
Balance Sheet - Shareholders’ Assets
At the end of 2011, insurance companies’
shareholders held SR 1.92 Billion in cash and cash equivalents
Investments accounted for the biggest share of shareholders’ assets, with a value of SR 6.81 Billion
Shareholders’ assets amounted to SR 10.38 Billion
Insurance companies’
total assets amounted to SR 31.50 Billion
Item Name
General and Health Insurance
Protection and
Savings Insurance Total Insurance
Cash and Cash Equivalents 1,920,337
Receivables, net 28,378
Investments 6,807,722
Deposits at Financial Institutions 3,647,356
Loans 3,773
Debt, Securities and Fixed Income 1,567,627
Shares (common, preferred) 544,131
Real Estate 23,647
Investment in Subsidiaries and
Affiliates 56,502
Other 964,686
Accrued, Interest and Income 37,899
Tangible Assets 129,640
Intangible Assets 780,697
Distributions due from Policyholders
Account 499,840
Other Shareholders’ Assets 170,493
Total Shareholders’ Assets [2] 10,375,006
Total Assets [1] + [2] 31,495,890
Shareholders’ Assets (2011, SR Thousand)
Balance Sheet - Policyholders’ Liabilities and Equity
At the end of 2011, insurance companies held SR 13.95 Billion in technical reserves, which consist of unearned premiums, outstanding claims, IBNR and adjustment expense reserves
Mathematical reserves amounted to SR 1.73 Billion
Policyholders’ liabilities and equity amounted to SR 21.14 Billion
Item Name
General and Health Insurance
Protection and
Savings Insurance Total Insurance
Policyholders’ Payables 861,644 19,249 880,893
Reinsurance Balances Payables 1,120,851 21,881 1,142,732
Technical reserves 13,888,192 65,029 13,953,221
Unearned Premiums 8,117,997 15,990 8,133,987
Outstanding Claims, IBNR and
Adjustment Expense 5,770,196 49,039 5,819,234
Mathematical Reserves 1,342 1,727,970 1,729,312
Other Reserves 34,181 3,561 37,741
Unearned Reinsurance Commissions 312,005 2,584 314,589
Accrued Expense and Deferred Income 1,377,003 17,320 1,394,323
Declared Dividends Payables 64,737 419 65,156
Distributions due to Shareholders Account 433,463 30,965 464,428
Other Policyholders’ Liabilities 461,884 25,200 487,084
Total Policyholders’ Liabilities 18,555,301 1,914,177 20,469,478
Accumulated Surplus 81,103 593,949 675,053
Total Policyholders’ Liabilities & Equity [3] 18,636,404 2,508,126 21,144,531
Policyholders’ Liabilities And Equity (2011, SR Thousand)
Balance Sheet - Shareholders’ Liabilities and Equity
At the end of 2011, shareholders’ liabilities amounted to SR 1.14 Billion while
shareholders’ equity totaled SR 9.19 Billion Share capital constituted
the biggest share of shareholders’ equity with a value of SR 8.25 Billion
Shareholders’ liabilities and equity registered SR 10.32 Billion
Insurance companies’
total liabilities and equity amounted to SR 31.47 Billion
Item Name
General and Health Insurance
Protection and
Savings Insurance Total Insurance
Shareholders’ Payables 283,764
Zakat 312,038
Accrued Expenses and Deferred Income 80,937
Other Shareholders Liabilities 458,313
Total Shareholders Liabilities 1,135,051
Share Capital 8,249,777
Statutory Reserves 816,192
Retained Earnings (135,661)
Other Shareholders’ Equity 255,647
Total Shareholders Equity 9,185,955
Total Shareholders Liabilities & Equity [4] 10,321,006
Total Liabilities & Equity [3] + [4] 31,465,537
Shareholders’ Liabilities And Equity (2011, SR Thousand)
Insurance Market Performance - By Line of Business
Insurance Market Performance - By Line of Business
Health Insurance
9,708
8,225
7,658
5,623
Health
NEP NWP GWP
NCI 65%
62%
60.8%
52.5%
% Total
Retention Ratio Loss Ratio
85% 73%
Health Insurance Performance (2011, SR Million)
Health insurance, which includes both compulsory and non-compulsory lines, accounted for 52.5% of the 2011 total market GWP with SR 9.71 Billion in underwritten premiums
Health insurance accounted for 60.8% of the market’s NWP as insurance companies retained SR 8.23 Billion of their Health insurance GWP, which represents a 85%
retention ratio
Health insurance’s NEP registered SR 7.66 Billion Health insurance’s NCI amounted to SR 5.62 Billion,
which translates into a 73% loss ratio for the year 2011
Retention ratio and loss ratio are not shown due to the savings part of the premium which distorts the ratios
Protection and Savings Insurance
905
841
616
325
P&S
NCI NEP NWP GWP
4%
5%
6.2%
5%
% Total
Protection and Savings Insurance Performance
(2011, SR Million) Protection and Savings insurance’s GWP totaled SR 905
Million in 2011, which represents a 5% contribution to the market’s total business volume
Protection and Savings insurance accounted for 6.2% of the market’s NWP as insurance companies retained SR 841 Million of GWP
Protection and Savings insurance’s NEP registered SR 616 Million, which represents a share of 5% of total NEP Protection and Savings insurance’s NCI amounted to SR
325 Million
Motor Insurance
3,922
3,711
3,315
2,473
Motor
NCI NEP NWP GWP
28%
27%
27.4%
21.2%
% Total
Retention Ratio Loss Ratio
95% 75%
Motor Insurance Performance (2011, SR Million)
Motor insurance’s GWP totaled SR 3.92 Billion in 2011, which represents a 21.2% share of total market GWP Motor insurance’s retention ratio of 95% was the highest
of all business lines. Motor insurance NWP totaled SR 3.71 Billion
Motor insurance’s NEP amounted to SR 3.32 Billion and accounted for 27% of the insurance market’s NEP
Insurance companies recorded SR 2.47 Billion in Motor insurance’s NCI which resulted into a 75% loss ratio
Property/ Fire Insurance
1,157
136 127 131
Property/ Fire
GWP NWP NEP
NCI 2%
1%
1%
6.3%
% Total
Retention Ratio Loss Ratio
12% 103%
Property/ Fire Insurance Performance (2011, SR Million)
Property/ Fire insurance’s GWP totaled SR 1.16 Billion in 2011, which represents a 6.3% share of total market GWP
Insurance companies retained only 12% of their Property/ Fire insurance premiums as the business line’s NWP amounted to 136 Million. Property/ Fire insurance contributed 1% to total market NWP in 2011 Property/ Fire insurance’s NEP registered SR 127
Million of the insurance market’s NEP
Insurance companies recorded SR 131 Million in Property/ Fire insurance’s NCI which translates into a 103% loss ratio
Engineering Insurance
913
131 124
27 Engineering
NCI NEP NWP GWP
0.3%
1%
1%
4.9%
% Total
Retention Ratio Loss Ratio
14% 22%
Engineering Insurance Performance (2011, SR Million)
Engineering insurance’s GWP totaled SR 913 Million in 2011, a 5% contribution to total market GWP
Insurance companies retained 14% of their Engineering underwritten premiums. Engineering insurance NWP registered SR 131 Million
Engineering insurance NEP amounted to SR 124 Million and accounted for 1% of the insurance market’s NEP Engineering insurance recorded a loss ratio of 22%, with
NCI, totaling SR 27 Million
A&L and Other* Insurance
632
280
238
49
A&L and Other
NCI NEP NWP GWP
1%
2%
2.1%
3.4%
% Total
Retention Ratio Loss Ratio
44% 21%
A&L and Other Performance (2011, SR Million) Accident and Liability (A&L) insurance includes the
following lines of business: personal accident, work related, employer’s liability, third party liability, general liability, product liability, medical liability, professional liability, theft & burglary, safe burglary, fidelity and any other liability
Insurance companies underwrote SR 632 Million in A&L and Other general insurance premiums
Insurance companies retained SR 280 Million of A&L and Other general insurance underwritten premiums, and with 44% retention ratio
A&L and Other general insurance NEP totaled SR 238 Million, which represents a 2% contribution to total NEP Insurance companies recorded SR 49 Million in A&L and
Other general insurance’s NCI which translates into a 21% loss ratio
* Other insurance refers to all other business lines in general insurance
Marine Insurance
634
205 198
78
Marine
NCI NEP NWP GWP
1%
2%
1.5%
3.4%
% Total
Retention Ratio Loss Ratio
32% 39%
Marine Insurance Performance (2011, SR Million)
The Marine insurance line of business includes both marine cargo and marine hull insurance
Marine insurance GWP totaled SR 634 Million in 2011, which represents a 3.4% contribution to total market GWP
Insurance companies retained 32% of their Marine insurance underwritten premiums as the business line’s NWP amounted to SR 205 Million
Marine insurance’s NEP recorded SR 198 Million, which represents a 2% share of total NEP for 2011
Marine insurance’s NCI amounted to SR 78 Million. This resulted in a loss ratio of 39%
Energy Insurance
361
7 7
0 Energy
NEP NWP NCI GWP
-0.001%
0.05%
0.1%
2%
% Total
Retention Ratio Loss Ratio
2% -1.5%
Energy Insurance Performance (2011, SR Million)
In 2011, Energy insurance GWP totaled SR 361 Million, which represents a 2% share of total market GWP Insurance companies ceded 98% of their Energy
insurance underwritten premiums. Energy insurance NWP amounted to SR 7 Million
Energy insurance’s NEP amounted to SR 7 Million, accounting for only 0.05% of the insurance market’s NEP
Aviation Insurance
272
1 2 1
Aviation
NCI NEP NWP GWP
0.01%
0.02%
0.01%
1.5%
% Total
Retention Ratio Loss Ratio
0.5% 50%
Aviation Insurance Performance (2011, SR Million)
Aviation insurance GWP reached SR 272 Million in 2011, a 1.5% contribution to total market GWP
NWP for Aviation insurance reached SR 1 Million resulting in a retention ratio of 0.4%
Aviation insurance’s NEP totaled SR 2 Million and NCI amounted to SR 1 Million resulting in a loss ratio of 50%
for 2011
Other Market Indicators
Other Market Indicators
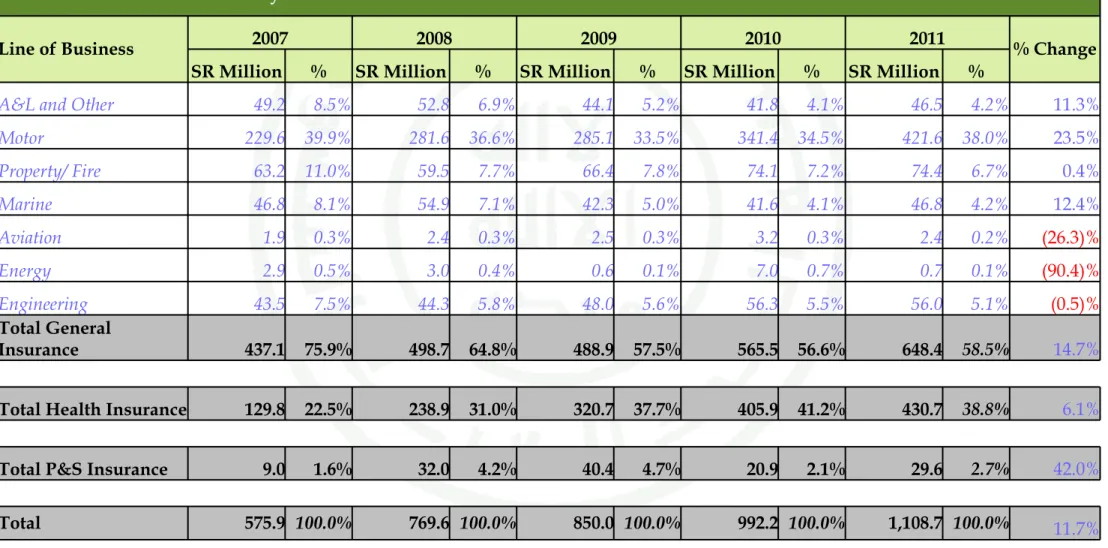
Commissions Incurred by Line of Business
Commissions Incurred by Line of Business (2007 to 2011, SR Million)
Total commissions incurred amounted to SR 1.12 billion in 2011, compared to SR 992 Million in 2010, which represents an increase of 11.7%
General insurance related commissions accounted for 58.5% of total commissions incurred in 2011 Health insurance’s
share of total
commissions incurred represented 38.8% in 2011
Protection and Savings insurance’s
commissions incurred was 2.7% of total commissions incurred in 2011
230
282
285
341
422 74
74
66 60
63
56 56
55
2 3
40 48 770
239
44
9 49 47 43
1,109
431
2011 +18%
2010 992 47
406 850
32
2007
42 21
30
2009 42
47
321
42
2008 130
44 53 576
% Growth 2010–11
-90.4%
42%
-0.5%
-26.3%
11.3%
12.4%
0.4%
23.5%
6.1%
Energy
Health Aviation
A&L and Other P&S
Motor Marine
Property/ Fire Engineering
38.8%
38%
6.7%
5.1%
4.2%
4.2%
2.7%
0.2%
0.1%
% Total
Total 11.7% 100%
The total number of insurance companies’ employees in Saudi Arabia reached 7,457 in 2011, up from 7,081 in 2010 Saudi nationals employed by insurance companies account
for 53% of the total workforce, an increase of 3 percentage points from 2010 figures
In 2011, the Saudization ratio for non-managerial positions increased to 55% up from 53% in 2010, while the
Saudization ratio for managerial positions increased to 40%
up from 33% in 2010
Note: Newly licensed insurance companies are required to adhere to a Saudization ratio of 30% during the first year of operations (as per Article 79 of the Implementing
Regulations)
Employees Breakdown by Nationality
Number of Employees vs. Saudization Ratio (2011)
0 50 100 150 200 250 300 350 400 450 500 550 600 650 700 750 800
0 5 10 15 20 25 30 35 40 45 50 55 60 65 70 75 80 85 90 95 Saudization Ratio
Number of Employees
Minimum Saudization ratio
Nationality
No. of Managerial Employees
Total No. of Employees No. of Non–
managerial Employees
2010 2011 2010 2011 2010 2011
Other Arab Other Non–
Arab Saudi
Saudization Ratio Total
1,273 1,222 314 309 1,587 1,531
1, 606 1,643 336 321 1,942 1,964
3,225 3,542 327 420 3,552 3,962
53% 55% 33% 40% 50% 53%
6,104 6,407 977 1,050 7,081 7,457
Insurance Market Structure
In 2011, the top 8 insurance companies generated 68.6%
of the insurance market’s GWP
The remaining 26 insurance companies included in the report accounted for the 31.4% of total market premiums
Gross Written Premiums by Company (2009 to 2011, SR Million)
851
4,736 381
389 490 500
881 1,347
1,849
4,035
4,507 523
553 565 600
1,749
2,623
4,181
5,801 548
565 601
684 1,069
1,993
2,811
4,431
0 1,000 2,000 3,000 4,000 5,000 6,000 2009 2010 2011
Remaining 26 companies
Market Share
68.6%
2009 2010 2011
Company 8 Company 7 Company 6 Company 5 Company 4 Company 3 Company 2 Company 1
27.6% 25.5%
12.7% 16.0%
9.2% 10.7%
6.0% 5.2%
3.4% 3.7%
3.4% 3.4%
2.7% 3.4%
2.6% 3.2%
32.4% 28.9%
23.9 % 15.2%
10.8%
5.8%
3.7%
3.2%
3%
3%
31.4%
Capitalization of Insurance Companies
Insurance companies’ equity increased form SR 9.1 Billion at the end of 2010 up to SR 9.2 Billion at the end of 2011, with 24 companies exceeding SR 100 Million
The largest company by total equity is
Tawuniya, with total equity of SR 2.05 Billion at the end of 2011 following an increase from SR 1.77 Billion at the end of 2010
Note: the Law on Supervision of Cooperative Insurance Companies stipulates a minimum capital of SR 100 Million for insurance
companies and SR 200 Million for companies that will undertake insurance and reinsurance activities
Insurance Companies’ Equity vs. NWP (2011, SR Million)
Equity 800
1,000 400
300 200
100 0
NWP
1,100 700
500 -100
2,100 2,000 3,400 3,500
300 600 500 400 200 100 0
2,100 Number of
Companies Shareholders’ Equity (2011)
Up to SR 50 Million 7
SR 50 M to SR 100 Million 5
SR 100 M to SR 150 Million 8
SR 150 M to SR 200 Million 4
SR 200 M to SR 500 Million 8
More that SR 500 Million 4
Appendix: Data Tables
Appendix: Data Tables
Table 1: Gross Written Premiums by Line of Business (2007 to 2011)
Table 1: Gross Written Premiums by Line of Business
Line of Business
2007 2008 2009 2010 2011
% Change
SR Million % SR Million % SR Million % SR Million % SR Million %
A&L and Other 577.3 6.7% 531.3 4.9% 543.7 3.7% 506.8 3.0% 631.5 3.4% 24.6%
Motor 2,440.2 28.4% 2,542.1 23.3% 3,055.4 20.9% 3,238.8 19.7% 3,922.2 21.2% 21.1%
Property/ Fire 742.2 8.6% 798.4 7.3% 904.9 6.2% 958.7 5.7% 1,156.7 6.3% 20.7%
Marine 531.6 6.2% 619.6 5.7% 525.0 3.6% 518.2 3.1% 634.1 3.4% 22.4%
Aviation 114.5 1.3% 138.5 1.3% 174.1 1.2% 304.54416 1.9% 272.14299 1.5% (10.6)%
Energy 305.3 3.6% 208.2 1.9% 301.7 2.1% 328.9 2.0% 361.0 2.0% 9.8%
Engineering 479.7 5.6% 682.1 6.2% 810.3 5.5% 869.2 5.2% 912.5 4.9% 5.0%
Total General Insurance 5,190.7 60.5% 5,520.1 50.6% 6,315.3 43.2% 6,725.1 40.7% 7,890.3 42.6% 17.3%
Total Health Insurance 3,065.0 35.7% 4,805.2 44.0% 7,292.0 49.9% 8,690.1 53.3% 9,708.4 52.5% 11.7%
Total P&S Insurance 327.0 3.8% 593.7 5.4% 1,002.8 6.9% 972.2 6.0% 905.1 4.9% (6.9)%
Total 8,582.7 100.0% 10,918.9 100.0% 14,610.1 100.0% 16,387.4 100.0% 18,503.7 100.0%
12.9%
Tables 2 & 3: Insurance Penetration and Density (2007 to 2011)
Table 2: Insurance Penetration
Line of Business 2007 2008 2009 2010 2011
% Change
% % % % %
Total General Insurance 0.36% 0.31% 0.45% 0.40% 0.36% (8.3) %
Total Health Insurance 0.21% 0.27% 0.52% 0.51% 0.45% (12.7) %
Total P&S Insurance 0.02% 0.03% 0.07% 0.06% 0.04% (27.2)%
Total 0.73% 0.61% 1.03% 0.97% 0.86% (11.8) %
Table 3: Insurance Density
Line of Business 2007 2008 2009 2010 2011
% Change
SR SR SR SR SR
Total General Insurance 216.5 222.5 248.9 247.8 290.8 17.4%
Total Health Insurance 127.8 193.7 287.4 320.2 357.8 11.7%
Total P&S Insurance 13.6 23.9 39.5 35.8 33.4 (6.9) %
Total 371.4 292.9 575.8 603.9 682.0 12.9%
Table 4: Net Written Premiums by Line of Business (2007 to 2011)
Table 4: Net Written Premiums by Line of Business
Line of Business 2007 2008 2009 2010 2011
% Change SR Million % SR Million % SR Million % SR Million % SR Million %
A&L and Other 219.2 4.0% 217.3 3.0% 244.3 2.4% 275.9 2.3% 279.8 2.1% 1.4%
Motor 2,297.3 41.4% 2,458.7 33.6% 2,944.1 29.2% 3,098.8 26.1% 3,710.6 27.4% 19.7%
Property/ Fire 84.1 1.5% 95.4 1.3% 105.1 1.0% 126.5 1.0% 135.5 1.0% 7.1%
Marine 169.8 3.1% 201.5 2.8% 183.2 1.8% 175.4 1.5% 204.9 1.5% 16.9%
Aviation 3.6 0.1% 5.5 0.1% 1.1 0.0% 4.8 0.04% 1.242358 0.01% (74.4)%
Energy 2.4 0.0% 0.9 0.0% 5.2 0.1% 7.6 0.1% 7.4 0.1% (2.3)%
Engineering 97.6 1.8% 122.2 1.7% 125.3 1.2% 113.9 0.9% 131.2 1.0% 15.2%
Total General
Insurance 2,873.9 51.8% 3,101.6 42.4% 3,608.4 35.8% 3,802.9 31.9% 4,470.7 33.0% 17.6%
Total Health Insurance 2,403.1 43.3% 3,750.9 51.2% 5,556.9 55.2% 7,120.0 60.6% 8,225.1 60.8% 15.5%
Total P&S Insurance 266.8 4.8% 468.2 6.4% 908.0 9.0% 876.8 7.5% 841.2 6.2% (4.1)%
Total 5,543.8 100.0% 7,320.6 100.0% 10,073.2 100.0% 11,799.7 100.0% 13,537.0 100.0%
14.7%
Table 5: Retention Ratio by Line of Business (2007 to 2011)
Retention ratios are not shown for Protection & Savings in this table as the savings element of the contract must be retained in the Saudi Arabian company, so retentions are not directly comparable with other insurance contracts.
Table 5: Retention Ratio by Line of Business
Line of Business 2007 2008 2009 2010 2011
% Change
% % % % %
A&L and Other 38.0% 40.9% 44.9% 54.439% 44.304% (18.6)%
Motor 94.1% 96.7% 96.4% 95.678% 94.603% (1.1)%
Property/ Fire 11.3% 11.9% 11.6% 13.196% 11.716% (11.2)%
Marine 31.9% 32.5% 34.9% 33.842% 32.319% (4.5)%
Aviation 2.9% 4.0% 0.6% 1.591% 0.457% (71.3)%
Energy 0.8% 0.4% 1.7% 2.305% 2.051% (11.0)%
Engineering 20.3% 17.9% 15.5% 13.105% 14.377% 9.7%
Total General Insurance 55.4% 56.2% 57.1% 56.5% 56.7% 0.2%
Total Health Insurance 78.4% 78.1% 76.2% 81.9% 84.7% 3.4%
Total 63.9% 66.4% 67.4% 70.9% 72.1% 1.8%
Table 6: Commissions Incurred by Line of Business (2007 to 2011)
Table 6: Commissions Incurred by Line of Business
Line of Business 2007 2008 2009 2010 2011
% Change SR Million % SR Million % SR Million % SR Million % SR Million %
A&L and Other 49.2 8.5% 52.8 6.9% 44.1 5.2% 41.8 4.1% 46.5 4.2% 11.3%
Motor 229.6 39.9% 281.6 36.6% 285.1 33.5% 341.4 34.5% 421.6 38.0% 23.5%
Property/ Fire 63.2 11.0% 59.5 7.7% 66.4 7.8% 74.1 7.2% 74.4 6.7% 0.4%
Marine 46.8 8.1% 54.9 7.1% 42.3 5.0% 41.6 4.1% 46.8 4.2% 12.4%
Aviation 1.9 0.3% 2.4 0.3% 2.5 0.3% 3.2 0.3% 2.4 0.2% (26.3)%
Energy 2.9 0.5% 3.0 0.4% 0.6 0.1% 7.0 0.7% 0.7 0.1% (90.4)%
Engineering 43.5 7.5% 44.3 5.8% 48.0 5.6% 56.3 5.5% 56.0 5.1% (0.5)%
Total General
Insurance 437.1 75.9% 498.7 64.8% 488.9 57.5% 565.5 56.6% 648.4 58.5% 14.7%
Total Health Insurance 129.8 22.5% 238.9 31.0% 320.7 37.7% 405.9 41.2% 430.7 38.8% 6.1%
Total P&S Insurance 9.0 1.6% 32.0 4.2% 40.4 4.7% 20.9 2.1% 29.6 2.7% 42.0%
Total 575.9 100.0% 769.6 100.0% 850.0 100.0% 992.2 100.0% 1,108.7 100.0%
11.7%
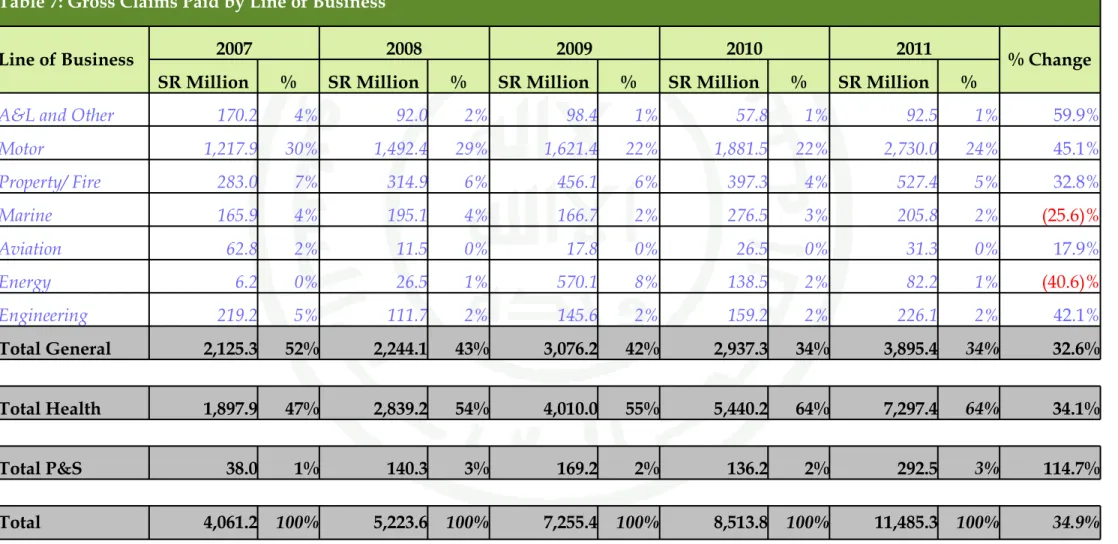
Table 7: Gross Claims Paid by Line of Business (2007 to 2011)
Table 7: Gross Claims Paid by Line of Business
Line of Business 2007 2008 2009 2010 2011
% Change SR Million % SR Million % SR Million % SR Million % SR Million %
A&L and Other 170.2 4% 92.0 2% 98.4 1% 57.8 1% 92.5 1% 59.9%
Motor 1,217.9 30% 1,492.4 29% 1,621.4 22% 1,881.5 22% 2,730.0 24% 45.1%
Property/ Fire 283.0 7% 314.9 6% 456.1 6% 397.3 4% 527.4 5% 32.8%
Marine 165.9 4% 195.1 4% 166.7 2% 276.5 3% 205.8 2% (25.6)%
Aviation 62.8 2% 11.5 0% 17.8 0% 26.5 0% 31.3 0% 17.9%
Energy 6.2 0% 26.5 1% 570.1 8% 138.5 2% 82.2 1% (40.6)%
Engineering 219.2 5% 111.7 2% 145.6 2% 159.2 2% 226.1 2% 42.1%
Total General 2,125.3 52% 2,244.1 43% 3,076.2 42% 2,937.3 34% 3,895.4 34% 32.6%
Total Health 1,897.9 47% 2,839.2 54% 4,010.0 55% 5,440.2 64% 7,297.4 64% 34.1%
Total P&S 38.0 1% 140.3 3% 169.2 2% 136.2 2% 292.5 3% 114.7%
Total 4,061.2 100% 5,223.6 100% 7,255.4 100% 8,513.8 100% 11,485.3 100% 34.9%