A meter is the length of the path traveled by light in a vacuum in a time interval of a second. The temperature T K Kelvin is a fraction of 1/273.16 of the thermodynamic temperature of the triple point of water.
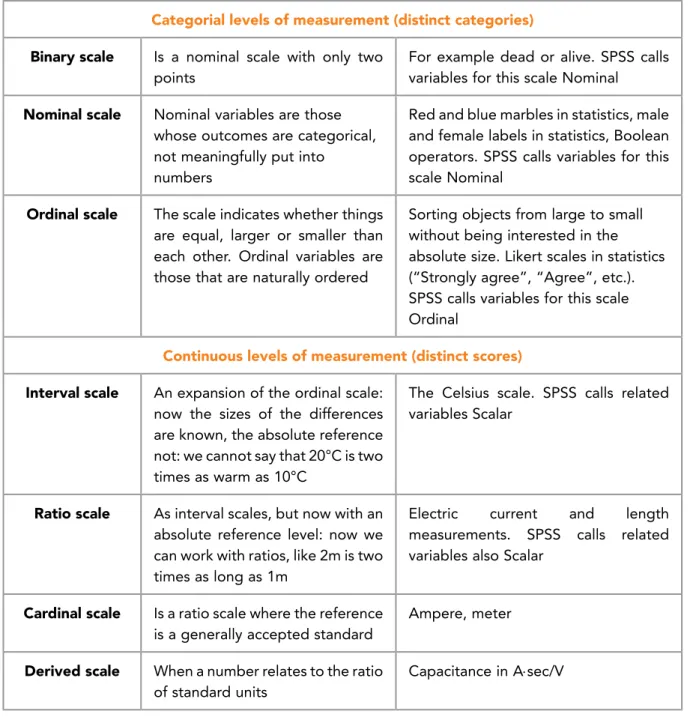
MEASUREMENT SCALES
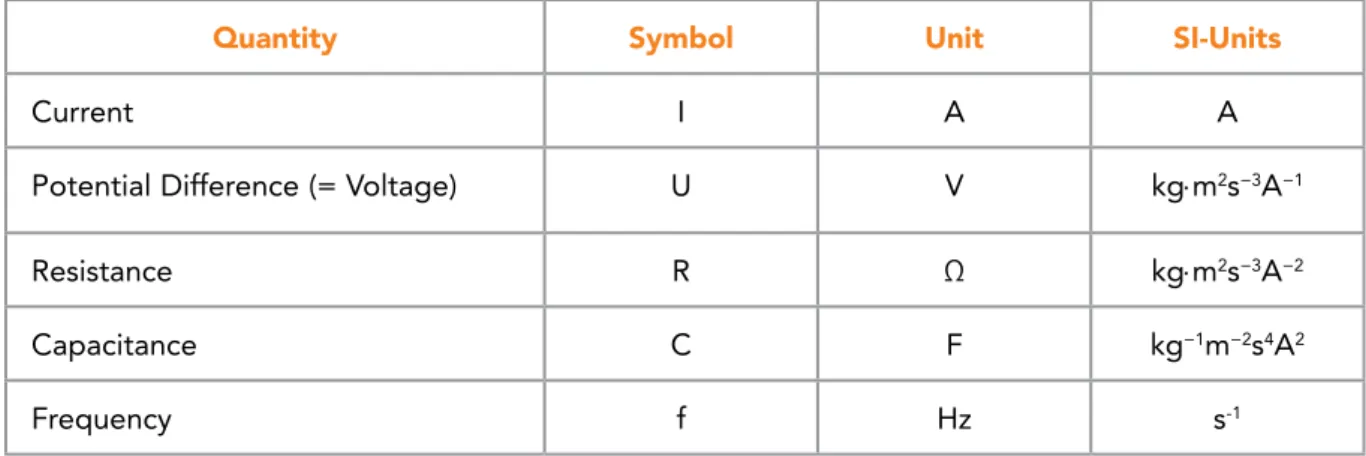
When performing calculations, it is strongly advised to use units as a second check for the correctness of the equation used. Ratio scale Like interval scale, but now with an absolute reference scale: we can now work with ratios, like 2m is twice as long as 1m.
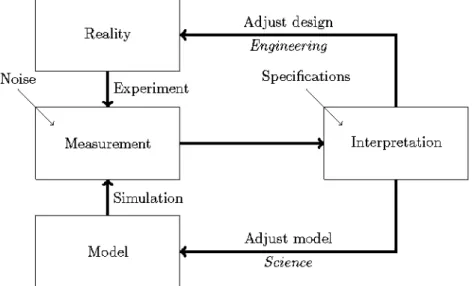
THE MEASUREMENT CHAIN
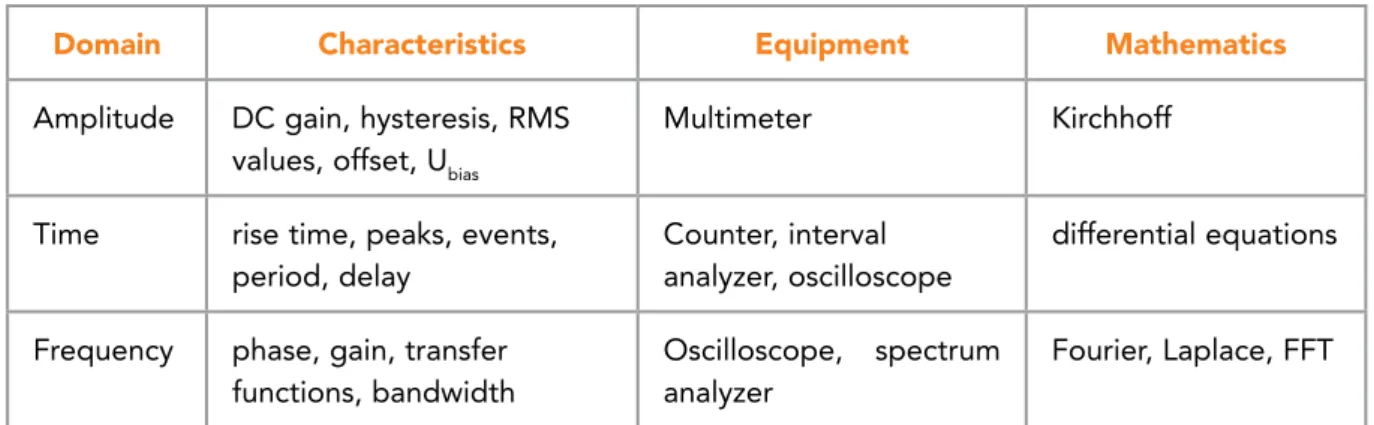
MEASUREMENT DEVICE TERMINOLOGY The terminology of Table 5 is important in measurement devices
SUMMARY, AND WHAT IS NEXT?
2 MEASUREMENT ERRORS
- TYPES OF ERRORS
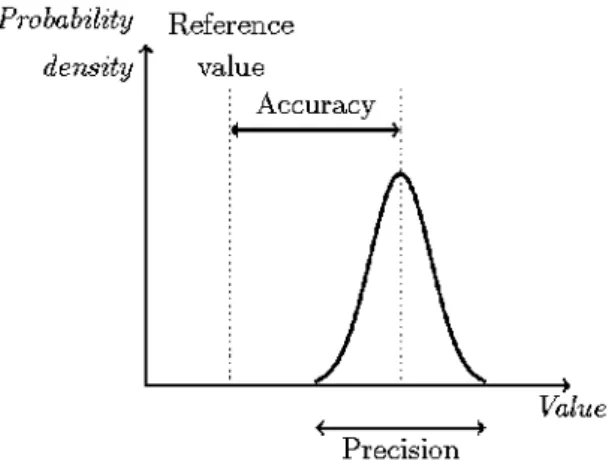
- ACCURACY AND PRECISION
- EXAMPLE
- TOLERANCE
- THE EFFECT OF TAKING MORE MEASUREMENTS
- SIGNIFICANT DIGITS
- ERROR PROPAGATION
- SUMMARY
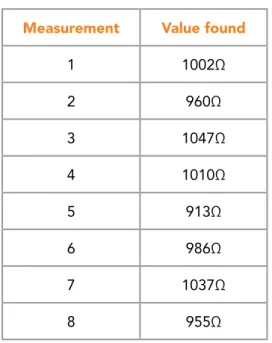
The systematic error (accuracy) is the result of the measurement tool, which was the same for all eight measurements. Once the standard deviation of the measurement V is known, it can be used to represent the number.
3 ELECTRIC CURRENTS AND POTENTIALS
ELECTRIC CURRENTS AND POTENTIALS
A consequence of Gauss's law (which is one of Maxwell's equations not explained in this book), is that there is no electric field inside an electrical conductor. This means that in an electrical wire (normally copper) there is no voltage drop, so we can connect electronic components with copper wires to supply them with supply voltages and signals.
AC AND DC SIGNALS
This expression of the phase is not completely correct according to Figure 7, where the phase is expressed as a time delay. While period and phase describe the temporal behavior of the signal, offset and amplitude define the vertical variation in volts (or amperes for a current source).
MASTER IN MANAGEMENT
VOLTAGE METERS AND CURRENT METERS
Note that voltages (potential differences) are measured across a component and currents are measured through a wire or component. The current meter must not affect the circuit and therefore must have a very low resistance (a concept introduced in the section below).
RESISTANCE
The small signal difference resistance r represents the resistance experienced to put a small voltage on top of the operational point. But taking one 1-meter step to walk up the mountain may require a 10% ascent, depending on the steepness of the mountain at that operational point.
![Figure 11: Resistors placed in series [a] and in parallel [b]](https://thumb-ap.123doks.com/thumbv2/1libvncom/9202029.0/39.892.323.566.125.396/figure-resistors-placed-series-parallel-b.webp)
SUMMARY
4 NETWORK THEORY
CLICK HERE
KIRCHHOFF’S LAWS
Substitute the constitutive equations into Kirchhoff's current laws and solve the set of equations. Substitute the constitutive equations into Kirchhoff's voltage laws and solve the set of equations.
SUPERPOSITION
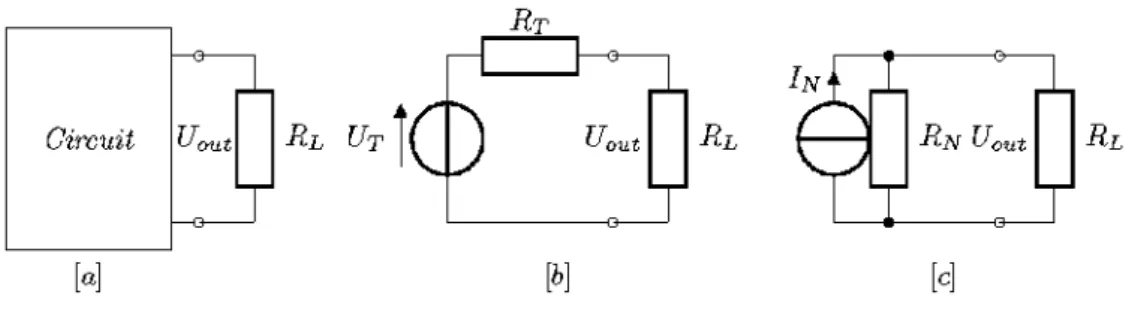
NORTON AND THÉVENIN SOURCE TRANSFORMATIONS
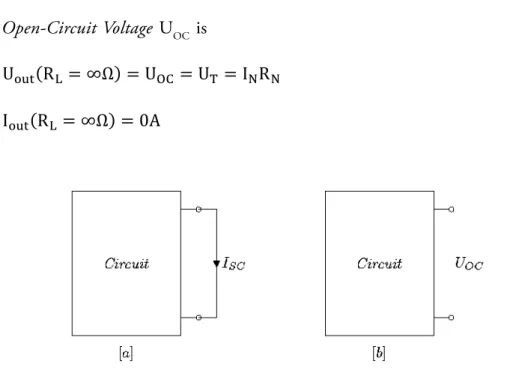
The question is how to determine the equivalent resistance and the equivalent Thévenin source (or Norton source). The equivalent resistance RT or RN is equal to the resistance of the circuit when all sources go to zero. In case the circuit is unloaded (U=∞Ω), there is no voltage drop across the resistance, and U =U.
THE WHEATSTONE BRIDGE
For other applications (like an LDR to only detect light and dark) there may be enough signal. In addition, the small variation of the output signal cannot be amplified because it would also amplify the huge offset. In some applications we can also replace R4 with a temperature sensor: in that case the response becomes an s-shape which is quite linear around R1(T)=0.
![Figure 24: The output of a voltage divider with a resistive sensor [a] and of a Wheatstone bridge with a resistive sensor [b]](https://thumb-ap.123doks.com/thumbv2/1libvncom/9202029.0/55.892.172.715.472.695/figure-output-voltage-divider-resistive-sensor-wheatstone-resistive.webp)
DIMENSIONING A VOLT METER AND CURRENT METER
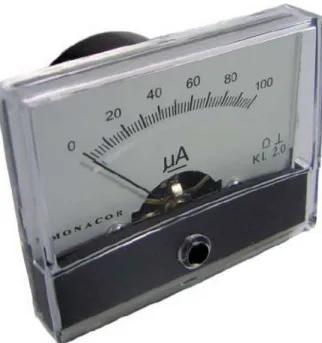
This system makes the position of the needle proportional to the applied current: in essence, this meter is therefore an ammeter. In Figure 28, the current meter becomes a custom range voltmeter when the correct series resistance Rseries is selected. In Figure 29, the ammeter becomes a practical custom ammeter when the correct parallel resistance is selected.
![Figure 26: The not-ideal voltage meter [a] and current meter [b]](https://thumb-ap.123doks.com/thumbv2/1libvncom/9202029.0/57.892.233.662.128.241/figure-ideal-voltage-meter-current-meter-b.webp)
TIME DEPENDENT CIRCUITS
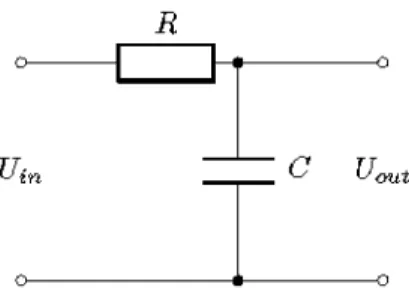
The circuit for the RC response and the transient response to a step input as found in equation (65) is illustrated in Figure 31. The result is an expression of the frequency transfer function of the RC circuit as a filter. The frequency transfer function shows for each frequency (expressed in radians Z) the modulus of the ratio of input to output, which means how much the input signal is amplified.
SUMMARY
5 BASIC SENSOR THEORY
- BACKGROUND LITERATURE
- A SENSOR IN THE MEASUREMENT CHAIN
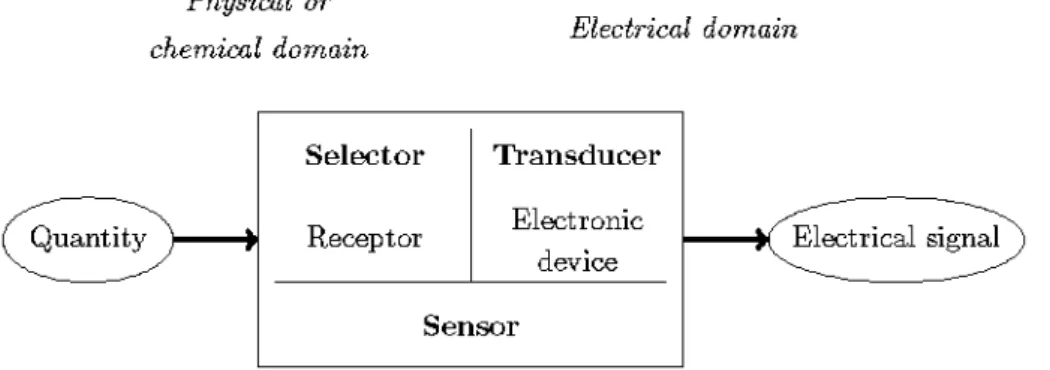
- SELECTOR PART AND TRANSDUCING PART
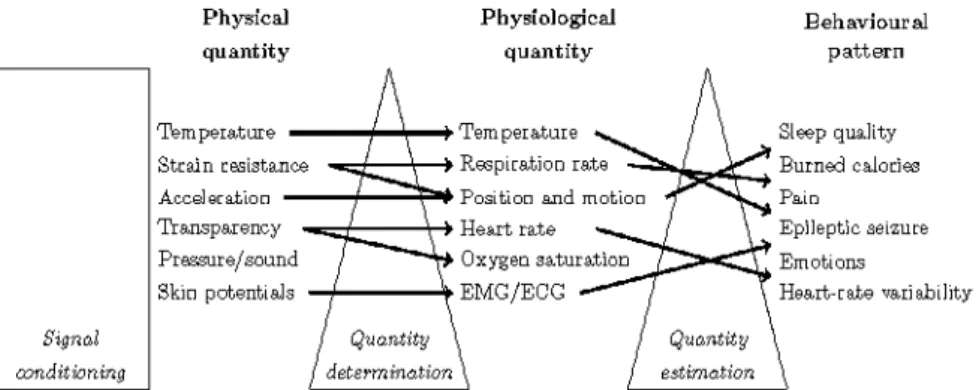
- QUANTITIES
- SELF-GENERATING VS. MODULATING SENSORS
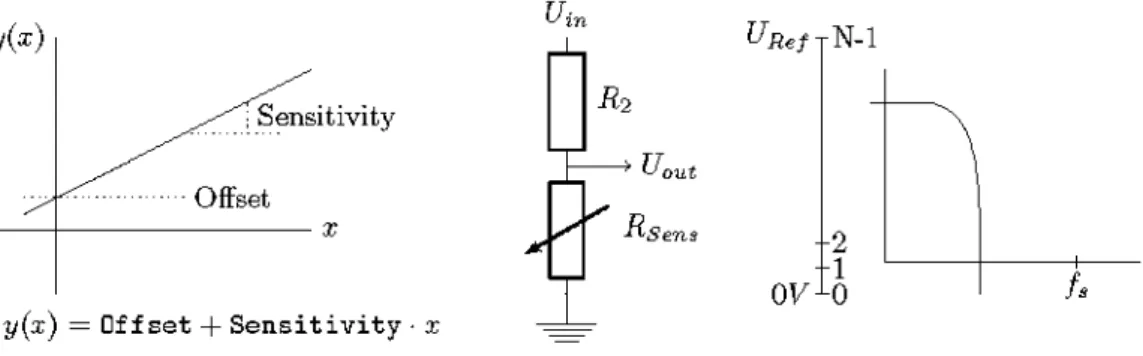
- SENSITIVITY, OFFSET AND CALIBRATION
- REFERENCE
- DRIFT AND CROSS-SENSITIVITY
- TRANSFER CURVE AND NON-LINEARITY
- MOTION ARTEFACTS
- TYPES OF SENSORS
Most quantities can be dependent or independent: the denomination depends on the system. An intensive quantity does not depend on the mass and size of the measured object, an extensive quantity does depend on its shape. The time variation of the state variables are rate variables and are called flows.
EXPERIENCE THE POWER OF FULL ENGAGEMENT…
After crossing the electrochemical barrier, we can pick up electrophysiological signals with conducting electrodes on top of the skin. It is not absolutely necessary to have a galvanic contact with the human body: a capacitive coupling may be sufficient because for electrophysiological signals we are not interested in the DC value. The principle of using an isolated electrode for capacitive measurements of electrophysiological signals was first demonstrated by Richardson (Richardson 1967).
RUN FASTER
THE SMART SENSOR
In the 1990s, the word Smart Sensor was introduced to address the next generation of sensors. Meta-data: Since the smart sensor works with digital data, we may store calibration data, an identification number, or other sensor-specific data within the sensor. Pull-out blocks behind the sensor (conversion between a high-level bus to a low-level bus) are commonly seen in industrial automation applications where we see Fieldbuses.
SUMMARY
SETASIGNThis e-book
6 SENSOR-ACTUATOR SYSTEMS
- FROM MEASURED QUANTITIES TO KNOWLEDGE
- HOW DATA FLOWS
- SENSOR/ACTUATOR NETWORK CONCEPTS
- MULTIVARIATE ANALYSIS
- NETWORK TOPOLOGIES
- TRENDS
- TRENDS ON MATERIAL AND DEVICE LEVEL
- TRENDS AT SYSTEM TOPOLOGY LEVEL
- SUMMARY
In a feedback loop the output of an actuator is measured and the sensor reading is used to evaluate the effect of the actuator. In addition to the interaction model between sensors and actuators, the topological mapping of the network must also be considered. The snow jacket called "The Hub" by O'Neill in the winter of 2004/2005 was primarily a design exercise to deal with network issues in e-textiles.
7 SIGNAL CONDITIONING AND SENSOR READ-OUT
SENSOR INTERFACES
A contact sensor that can be placed on the test subject is more invasive, but has less difficulty determining the reference. The problem may be the physical connection network of the sensor, which affects the measured quantity. The internal sensor can be a temperature sensor that monitors the temperature of the interface chip.
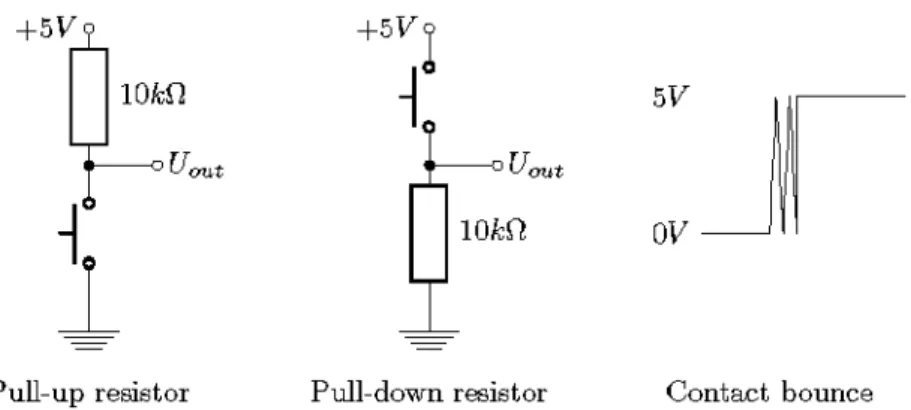
THE PUSH BUTTON
This can be a measurement system where frequency is used to find cutoff frequencies. Since using a pull-up resistor is such a common configuration, most microcontrollers have internal resistors that can be initialized in software. It can be removed by adding an RC circuit which removes the high frequency bounce. When implementing bounce in hardware, the circuit must be a low-pass filter, such as a simple RC network.
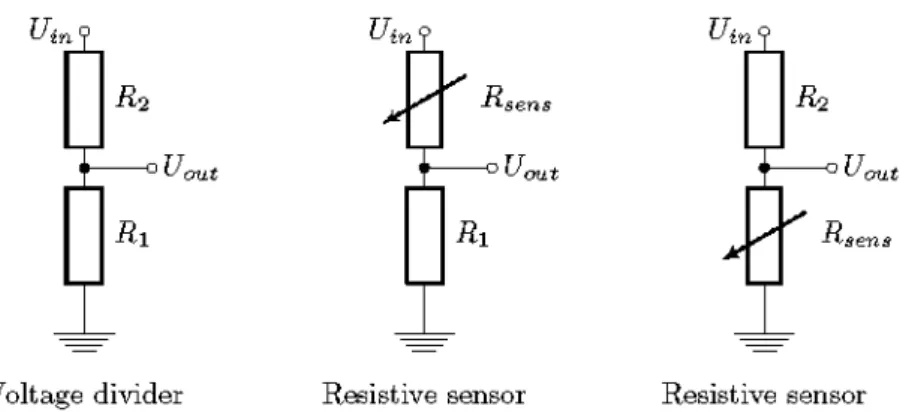
RESISTIVE SENSORS
The question is what is the sensitivity of the output voltage to changes in the resistive sensor value. The sensitivity is the same for the situation where the resistor is in the lower part of the voltage divider, only the sign will change. On the other hand, the variation ΔR of the sensor due to the sensed quantity is much smaller for most sensors.
CAPACITIVE SENSORS
Here A is the area of a plate, d the gap distance, ࣅ0 the permittivity of vacuum and ࣅr the specific permittivity of the material in the gap (ࣅr=1 for air). The easiest way for readout is to place them in a resonant circuit where the capacitor is one of the frequency determining elements. In these cases, the response time is limited by the period of the carrier signal.
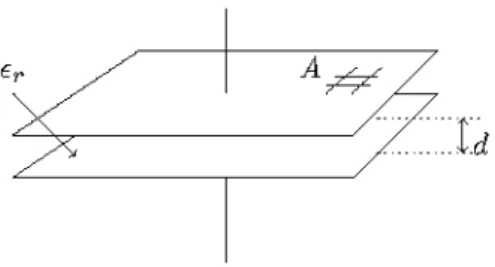
PHOTO DIODE
SIGNAL CONVERSION
Like contact bounce, one solution is to use a low-pass filter or transition detection software method. The first-order low-pass filter can be integrated with an amplifier like the inverting low-pass first-order active filter in Figure 60. Similar to the low-pass filter, we can implement an RC high-pass filter as shown in Figure 62.
BANDWIDTH
LONG WIRES
However, if the measured voltage is not the voltage across the resistor (or resistive sensing element), there will be an error in the perceived resistance. This means that the sensed voltage is almost equal to the voltage across the sensor. There is a voltage drop across the power wires, but this is irrelevant for measurement.
SUMMARY
8 ADC AND DAC
- FROM ANALOG TO DIGITAL AND BACK
- ANALOG TO DIGITAL CONVERSION
- DIGITAL TO ANALOG CONVERSION
- SUMMARY
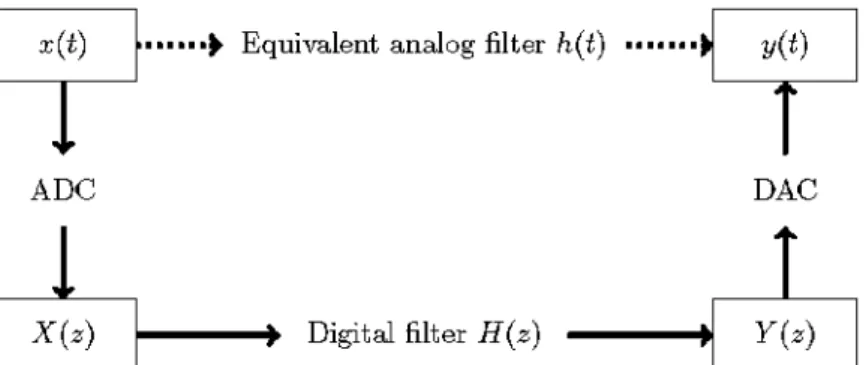
Although information is lost in the ADC due to quantization in time and amplitude, we can think of the signal y(t) as an analog filtered representation of x(t). We call T the sampling interval on the basis of which we can speak of the sampling frequency fs. The amplitude of the quantization noise is thus equal to the resolution ΔU and defined as such by the least significant bit.
9 BUS INTERFACES
- THE ADVANTAGES OF BUS INTERFACES AND NETWORKS The reasons to use a bus or bus system are
- BUSES OPTIMIZED FOR SENSOR NETWORKS
- INDUSTRIAL BUSES
- SUMMARY
In the 1970s TV sets became complex and meanwhile digital controllers were introduced. An alternative, which is similar in that it contains a clock line and a serial data line, is the Serial Peripheral Interface (SPI) as introduced by Motorola in the late 1980s. Similar to what happened in device architecture as a result of I2C, the automotive industry experienced a shift to digital buses in the late 1980s.
10 REFERENCES
A multisensor system for the non-invasive measurement of the activity of the autonomic nervous system.” Sensors and Actuators B: Chemical 27, no. ConText Contactless sensors for body monitoring embedded in textiles.” Portable '07, IEEE Conference on Portable Information Devices. The Wisdom Hierarchy: Representations of the DIKW Hierarchy.” Journal of Information and Communication Science 33, no.
APPENDIX A CIRCUITS, GRAPHS, TABLES, PICTURES AND CODE
- The electronic circuit and set-up
- Writing good code
- A good table
- A good graph
- Graph, table or just text?
Reduce the number of leading zeros, which can be done by including a multiplier of 103 in the table header. On the horizontal axis is the independent variable and on the vertical axis is the dependent variable, which intuitively corresponds to the cause and effect of the experiment. The final proof is when the straight line of the model falls within the error bars.
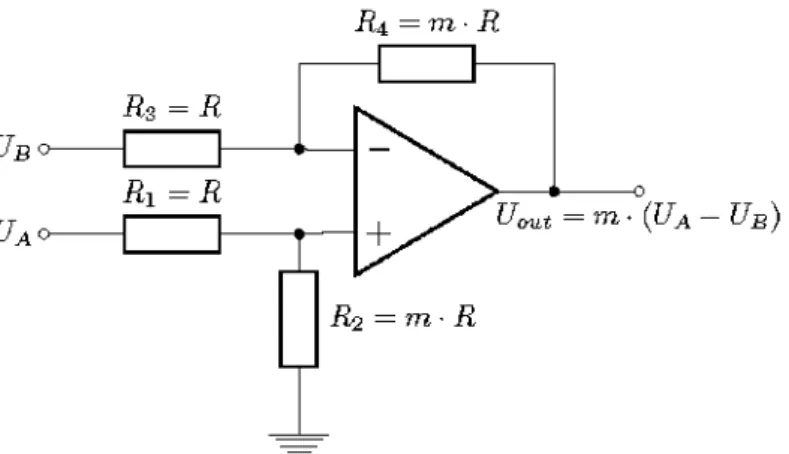
APPENDIX B: COMMON MODE REJECTION RATIO (CMRR)
We can start with superposition of the output UO due to voltages UB and UA. To simplify the problem, we start with the output UO due to voltages UA and U+:. However, we have made an assumption that the factor m in R4 is equal to the factor m in R2.
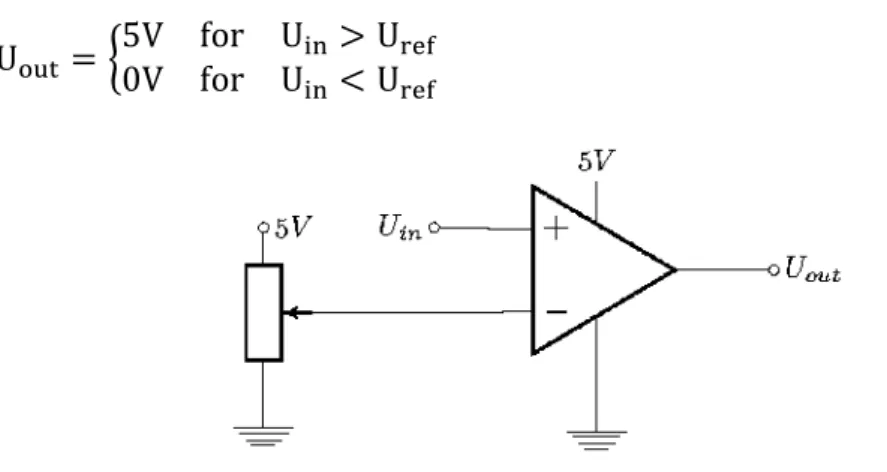
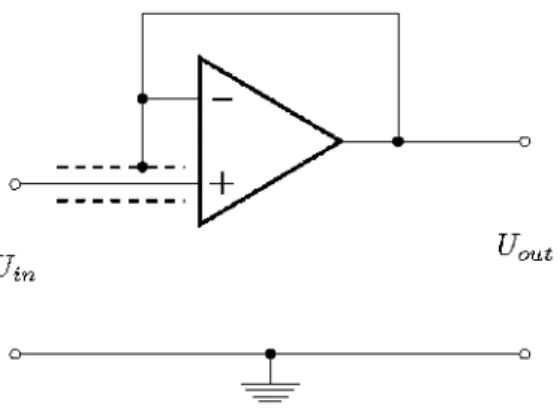
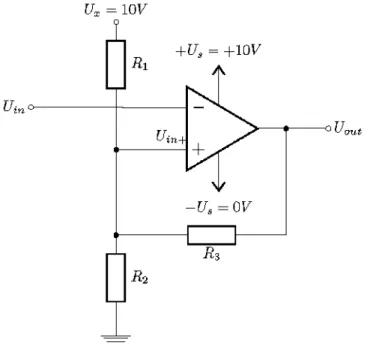
APPENDIX C: A SCHMITT TRIGGER FOR SENSOR LEVEL DETECTION
The comparator that does this is called a Schmitt Trigger and has the symbol of Figure 84. As a result, the comparator level at Uin+ is different for a high Uout than for a low Uout. In Figure 88, the effective position of the resistors is plotted for two situations: where the output is high and where the output is low.
INDEX