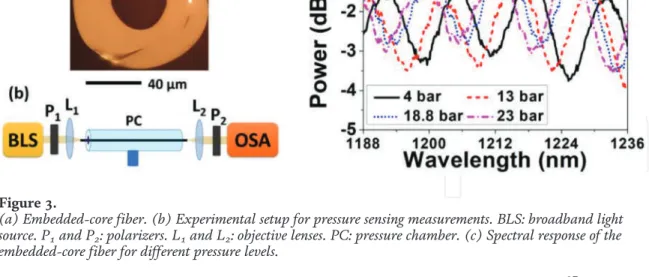
Furthermore, the off-center position of the fiber core allows the surface-core fibers to act as directional curvature sensors. Figure 3c shows the measured optical response of the embedded core fiber for different pressure conditions. In this kind of fiber, the core is located on the outer surface of the same (Figure 1c).
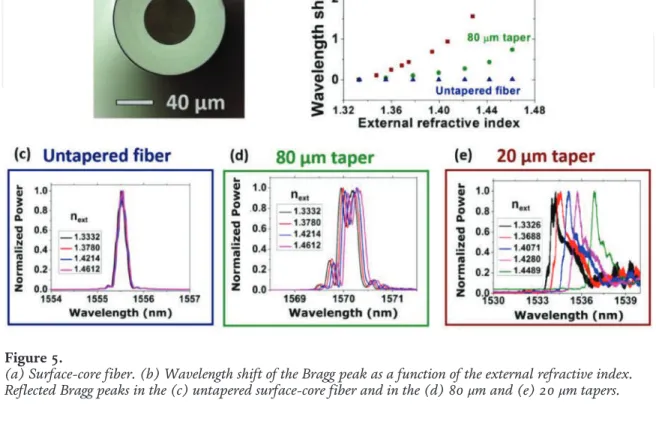
FBGs consist of refractive index modulation in the core of the fiber, which is able to couple the propagating core mode with the counter-propagating mode. Therefore, if the refractive index of the external environment changes, a shift in the spectral position of the Bragg peak is expected.
![Figure 1 shows the fiber designs we present here. In Figure 1a, a diagram of the embedded-core fiber is shown [7, 8]](https://thumb-ap.123doks.com/thumbv2/1libvncom/9201278.0/10.918.142.782.1074.1281/figure-shows-fiber-designs-present-figure-diagram-embedded.webp)
TOP 1%
Fiber Bragg gratings: an introduction
Fiber Bragg gratings (FBGs) are sensing elements based on the longitudinal modulation of the refractive index of the optical fiber core. In this way, the period of the interference pattern and the refractive index will change accordingly. The operating principle of the FBG consists of monitoring the Bragg wavelength shift (λBragg) reflected by the grating as a function of the controlled parameter.
Gait analysis: relevance and impact in an e-Health scenario
- Gait analysis: gait cycle pattern
- Gait parameters
- Gait pattern monitoring: e-Health architecture
The double support period corresponds to the percentage of the cycle when both feet are simultaneously in contact with the floor, and it describes the smooth transition between left and right single limb support [18]. During the first double stance, the heel hits the floor (heel), marking the beginning of the gait cycle. The cycle then progresses towards the support of the single period, where the foot moves down towards the floor to a foot-flat position, creating a stable base of support for the rest of the body.
The last contact of the foot with the ground is made by the big toe (hallux) at the moment of toe-off, which simultaneously marks the end of the stance phase and the beginning of the swing phase [20]. Midswing is characterized by alignment of the acceleration arm with the standing limb. During final swing, the limb decelerates as it prepares for ground contact, in heel strike at the start of a new cycle [19–21].
Based on such an analysis, it is possible to quantify the parameters involved in the movement of the lower extremities and to trace back the mechanisms that determine the movement of the human body [22]. Kinematic Quantification of movements and geometric description of the movement of the lower limbs, without reference to forces. Unlike the subjective techniques, objective gait analysis is more of a quantitative evaluation of the parameters mentioned above.
Based on that feedback, new therapeutic instructions can be given to the patient remotely, maximizing the efficiency of the healthcare delivered [31, 32].
Plantar pressure and shear analysis
- Plantar pressure sensors
- Plantar pressure and shear sensors
The study revealed that the FBG sensors have a better performance in the static moments and at lower speeds, while the piezoelectric sensors had better performance at higher speeds. a) Schematic of the shoe with the attached FBG and PZT sensors (adapted from [49]); and (b) schematic representation of an arcuate FBG pressure sensor (left) and the insole sensor schematic (right) (adapted from [50]). For the validation of the sensors, 11 participants were tested, and according to the results, the viability of the optical sensor for this kind of measurement was demonstrated. After calibrating the sensors located at point 1 (heel area), when the increasing load is applied at that point, only FBG 1 shows a Bragg wavelength shift, proportional to the applied load (Figure 6b) [12].
In more detail, in the lower graphic, it is possible to see which points of the insole are pressed more actively during the stance phase of the gait cycle. The dark blue representations in the foot correspond to the foot area that supports a higher load in the different stages of the stance phase [12, 32]. The data presented reflected the precision of the proposed system, with sensors having sensitivities of up to 19.8 pm/kPa. a) Reflectance spectra of the five FBGs multiplexed in the cork insole for three different load values; and (b) dependence of the Bragg wavelength shift on the load applied to FBG1 (adapted from [12]).
The developed sensor was able to measure the vertical stress, as well as the magnitude and direction of the shear stress on its top surface. Four of the FBGs were placed at the corners of the measurement platform and monitored the displacement motions on the x and y axes (two for the x axis and two for the y axis motion detection). Schematic representation of the FBG-based sensor cell developed in (a) silica (adapted from [56]) and (b) POF (adapted from [57]) fibers.
The authors state that an increase in temperature in a certain area of the foot presupposes that there was friction between the surface of the foot and the shoe (shear) [44, 60].
Lower limb joints monitoring
- Knee flexion-extension monitoring
- Ankle flexion and dorsi-flexion monitoring
- Tendons and ligaments monitoring
Fiber optic sensors can be easily adapted to curved surfaces and different contours of the human body, especially the knee, a joint with complex anatomy. The ideal technology to monitor limb joints should be able to measure curvature, which is useful not only for monitoring the movement of the lower limb segments. The encapsulation of the FBG is made with an applied bias so that the sensor can monitor both extension and compression deformations.
Therefore monitoring and monitoring the movement of the knee is of vital importance in the medical and physical rehabilitation field. When the bending movement of the knee starts, during walking, it results in a lengthening of the optic fiber, which induces a strain in the FBG sensor, located in the middle of the knee joint. By monitoring the wavelength shift during these movements, the patient's walking pattern could be characterized.
The kinetic strap is attached to the lower limb, starting at the quadriceps area and ending at the beginning of the tibia, with the FBG placed just a few centimeters above the knee rotation axis, as shown in Figure 13a. The purpose of the sensor is to measure the range of motion (ROM), which for the ankle joint the motion can be classified as ROM plantar flexion and ROM dorsi flexion. The rotation arm is connected to the side of the foot and its movement motivates the rotation of the correspondent disc.
In order to verify the performance of the sensor, initial tests were performed on the Achilles tendon and the results were compared with those obtained simultaneously with a stereovision sensor with two cameras.
Prosthetic and exoskeletons applications
- Prosthetic limbs
- Rehabilitation exoskeletons
The socket is the most relevant component of the artificial limb as it forms the critical interface between the amputee's stump and the amputee. The design and assembly of the plinth are also the most difficult processes, due to the particularity of each amputee's stump. This procedure intervenes in the shape of the socket and thus in the accuracy of the pressure measurements.
In the case of the F sockets, these systems provide flexibility, good sensitivity and ease of use. The device consists of FBGs embedded in a thin polymer layer of PDMS, with the minimum thickness of the sensing pad set to 2.5 mm. Due to the elasticity and ductility of the polymer, which matches human skin behavior, the system becomes a flexible 2D pressure-sensing surface.
Thus, the influence of the fiber embedment depth (middle and upper position of pad diameter), the thickness of the polymer sheet (2 and 3 mm), and the type of fiber (hydrogenated SMF-28 and non-hydrogenated GF1B) was assessed in [86]. The results obtained for the different load cycles show the suitability of the sensor to perform pressure measurements on the socket-butt interface, especially in the PT region. Schematic representation of an FBG-based system to monitor the interface pressure between the socket and the amputee (adapted from [75]). a) Representation of the maximum Bragg wavelength shift for maximum load applied (adapted from [75]);.
The difference is attributed to the thickness of the sensors, which is 3 mm in the case of FBG sensor pads and 0.2 mm in F-slot sensor pads.
Conclusion
The use of fiber Bragg grating sensors in biomechanics and rehabilitation applications: The latest and ongoing research topics. In: Proceedings of the 22nd Annual International Conference of the IEEE Engineering in Medicine and Biology Society (Cat. No.00CH37143);. In: Proceedings of the IEEE 5th International Conference on Pervasive Computing Technologies for Healthcare (PervasiveHealth) and Workshops;.
In: Proceedings of the International Conference on Intelligent Robots and Systems; 28 September-2 October 2015; Hamburg, Germany. Proceedings of the 8th ACM/IEEE International Conference on Human-Robot Interaction (MRI); March 3-6, 2013; Tokyo, Japan. The first issue is the difference in theoretical and experimental values of the ratio (R) at various temperature values.
Consequently, the temperature, strain or deformations of the fiber can be monitored by the corresponding resonant wavelength shift. The Bragg wavelength depends on strain and temperature through physical elongation or thermal change of the sensor and through changes in the refractive index of the fiber due to photoelastic and thermo-optical effects. For ultra-high temperature sensing, type II-IR gratings in silica optical fiber withstand a temperature of up to 1000°C, which are typically fabricated using a femtosecond laser with a power density near the fiber glass damage threshold.
A LPG is formed by introducing periodic modulation of the refractive index along a single-mode fiber. During the application of LPG-based voltage sensors, one of the main problems is the cross-sensitivity between voltage and the temperature [34]. Knowledge of tension, deformation and displacement of the windings is therefore central to the design of the superconducting magnet.
![Figure 8 depicts the basic principle of FBG reflection spectra and interrogation technique [12–15]](https://thumb-ap.123doks.com/thumbv2/1libvncom/9201278.0/66.918.249.668.1065.1278/figure-depicts-basic-principle-reflection-spectra-interrogation-technique.webp)
