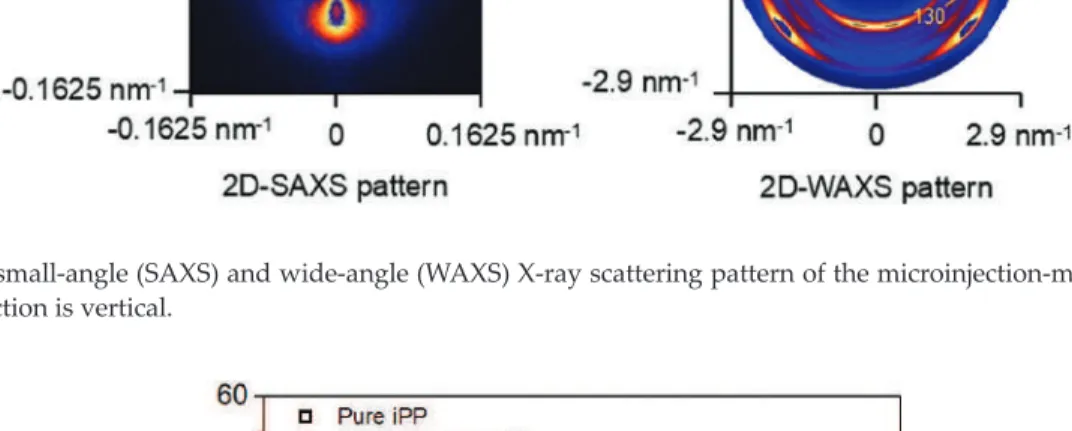
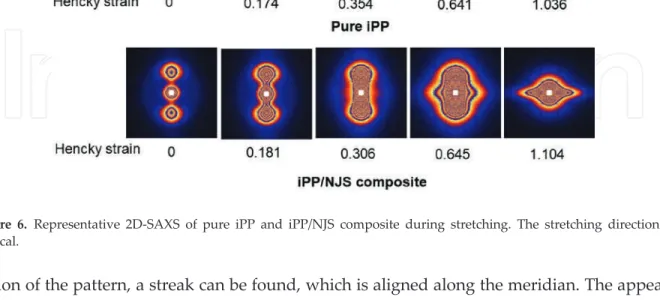
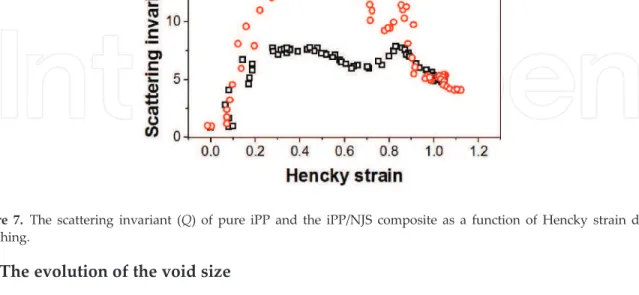
It is suggested that the formation of numerous voids is caused by the volume contraction of the film. 2D small-angle (SAXS) and wide-angle (WAXS) X-ray scattering pattern of the microinjection molded sample. As the Hencky strain is further increased, the scattering of the stripe continues to grow in the vertical direction, which is probably caused by the growth of the gap.
At an even greater strain (εH = 0.641), the scattering of the lamellae is covered by the scattering of the void. In addition, a stripe appears on the equator indicating the formation of the second group of cavities. The formation of the second group of cavities can be caused by the coalescence of the first group of cavities [41].
Conclusions
Study of cavitation in HDPE using time-resolved synchrotron X-ray scattering during tensile deformation. In situ observation of plastic deformation of polypropylene spherulites under uniaxial tension and simple shear in the scanning electron microscope. Plastic deformation of spherulitic semicrystalline polymers: An in situ AFM study of polybutene under tensile drawing.
A model dealing with tensile deformation of semicrystalline polymers: quasi-static stress-strain relationship and viscous stress determined for a sample of polyethylene.
TOP 1%
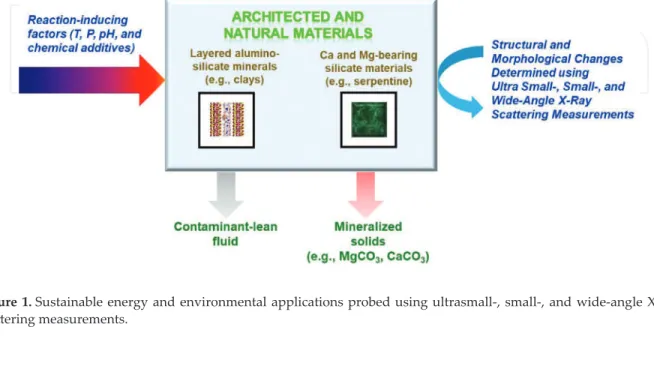
Scattering for Probing Chemo-
Morphological Coupling in Pore-to-Field and Process Scale Energy and Environmental Applications
- Introduction
- Analyses of ultrasmall and small angle scattering data for porous materials
- Determination of the volume fractions using the scattering invariant
- Determination of the morphology or roughness of solid interfaces from the porod scattering regime
- Shapes and size distributions
- Brief description of USAXS/SAXS instrumentation
- Morphological and structural changes in beidellite on heating
- Materials and methods
- Structural changes in beidellite on heating
- Morphological changes in beidellite on heating
- Morphological and structural changes in heat-treated serpentine on carbon mineralization
- Conclusions
This reduction in the interlayer basal distance corresponds to the removal of one layer of interlayer water. A progressive reduction in the intensity of the peak corresponding to the interlayer basal distance of beidellite is also noted upon heating to 1150°C. Changes in the characteristic peak corresponding to the interlayer basal spacing (d(001) peak) in beidellite (a) and the corresponding d-spacing (b) upon heating from 30 to 1150°C.
While changes in scattering contrast are noted, significant changes in the shape of the scattering curve are not apparent. The scattering length density is a function of the chemical composition and density of the phase. In the case of Beidellite, the scattering contrast factor emerges from the contrast between the solid and the intervening water at the beginning of the experiment.
The loss of water and densification of the material increases the scattering contrast factor to m−4. These results are consistent with the reduction in the intensity of the interlayer basal spacing corresponding to the porosity between the clay nanoplates as shown in Figure 2. A reduction in the porosity of heat-treated serpentine when it is converted to magnesite can potentially limit the reactivity of the material by preventing the migration of Mg.
In this context, quantifying the extent of reduction in porosity of heat-treated serpentine upon conversion to magnesium carbonate is useful. The scattering contrast factors are used to determine changes in the morphology of the materials.
Acknowledgements
The scattering contrast factors and the void size distributions with an aspect ratio of 1 are the important inputs to determine the morphological changes in these materials using the entropy maximization routine, MaxEnt [ 28 , 30 ]. The changes in the cumulative pore volume distributions of heat-treated serpentine before and after carbon mineralization are shown in Figure 6(b). A significant reduction in the voids corresponding to sizes in the range of 2-6 nm is noted.
In this chapter, we illustrated the use of combined USAXS, SAXS, and WAXS measurements to quantify response-driven microstructural and structural changes involving complex architectural and natural materials. These materials include Beidellite, a swelling clay from the smectite family of minerals, and serpentine, a layered sheet silicate belonging to the phyllosilicate family. The combined USAXS, SAXS, and WAXS techniques available in Sector 9-ID at the Advanced Photon Source at Argonne National Laboratory enable measurements spanning nearly four decades at the spatial scale.
This chapter also illustrates the need for prior knowledge about the morphological arrangement in materials to quantify the key features such as the changes in the porosity or surface area of porous materials during reaction. In this context, recent advances in electron microscopy and X-ray tomography have aided the quantitative interpretation of the X-ray scattering measurements discussed in this chapter.
Author details
A small- and ultrasmall-angle neutron scattering (SANS/USANS) study of the New Albany shale: a discussion of microporosity. Effect of dehydration on pore size, porosity and fractal parameters of shale rocks: an ultrasmall angle X-ray scattering study. Toward an understanding of microstructural and structural changes in natural hierarchical energy-harvesting materials: multiscale X-ray scattering characterization of Na- and Ca-montmorillonite in operando upon heating to 1150 °C.
In-situ angstrom-micrometer characterization of structural and microstructural changes in kaolinite upon heating using ultrasmall-angle, small-angle, and wide-angle X-ray scattering (USAXS/SAXS/WAXS). Determination of particle size distribution in small-angle scattering using the maximum entropy method. Morphological changes during increased carbonation of asbestos-containing material and its comparison with magnesium silicate minerals.
Experimental Design and Data Analysis for Accurate Estimation of Reaction Kinetics and Conversion to Coal Mineralization. Chemical and morphological changes during olivine carbonatization for CO2 storage in the presence of NaCl and NaHCO3. Verification and quantification of carbon fixation in minerals from serpentine-rich mine tailings using the Rietveld method with X-ray powder diffraction data.
Selection of our books indexed in the Book Citation Index in Web of Science™ Core Collection (BKCI).
Small-Angle Scattering Analysis of Fractals Generated by Additive Cellular Automata
Theoretical background
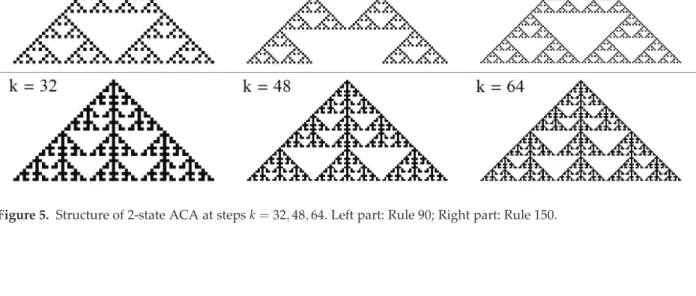
We briefly explain the mathematical description of the cellular automata and the theoretical foundations of the small-angle scattering technique. In general, an arbitrary place of the M¼pt state CA, where p is prime and t is a natural number, with the value aki at position i and step k is determined by a transitional rule and depends on the state of the place itself and states of its neighbors iþr1, iþr2,⋯iþrl at step k 1; So. In the limit of the high number of steps generated, this structure will be nothing but the well-known Sierpinski triangle fractal.
The length of the blocks should not be less than the difference in the positions of the first and last terms (neighbors) in Eq. The largest eigenvalue λ of the transition matrix gives the fractal dimension D of the ACA by using the relation [18]. It is known that if a fractal consists of two or more different subfractals, then the fractal dimension of the fractal is equal to the largest value among the fractal dimensions of the subfractals [24].
The most natural way is to consider an M-state ACA as a composition of subfractals formed by different values of the ACA sites. At large scales when leveling effect occurs, an effective way to reduce it can be achieved by a pivot point selection and the use of a non-overlapping criteria for reducing the edge effects, for computation time and for precision improvements [25]. The latter presented in Figure 2 is considered a 2-state system regardless of the value of each occupied site, which means that there are only two possible values of the site, "occupied" and "not occupied", as shown in Figure 3.
The quantity measured is the differential cross section per unit volume as a function of the scattering vector q¼ki kf. We choose here a continuous distributionDNkð Þl of fractals with different sizeslwhich gives the probability of finding a fractal of the size distribution in the rangeðl;lþdlÞ.
Results and discussion
The presence of the most pronounced minima and their periodicity in this region can say something about the fractal iteration number and scale factor. Although the behavior of the curve is different at k¼48, this stems from the fact that for M¼pt state (t∈N) ACA, the number of steps generating a complete fractal structure is equal to ¼pn [18, 22], where ∈Ni is the fractal iteration number. The fractal iteration number n can be obtained from SAS data as the number of most pronounced minima in the fractal region.
The radius of gyrationRgof ACA can be obtained from the Guinier region by performing a series expansion of the scattering intensity (Eq. The non-uniform distribution of the sites of the subgroups is the reason for their multifractal properties. The SAS spectra from Figure 6 show that the fractal dimension of the subgroups of the total coin-ede dimensions is not 4 total.
State 2-ACA has a larger fractal dimension value than state-2; therefore, it is equal to the fractal dimension of the total state 4. Unlike the arrangement shown in Figure 2, in this case the subgroups state-1 and state-3 have a more uniform and similar arrangement of places. The dimension spectrum (Figure 11, right part) shows that there is little difference in the fractal dimensions of state-1 and state-2, and due to the uniform distribution of sites, the spectra are almost constant along the interval s, which means that state-1 and state-2 are monofractal.
The arrangement of state-2 sites is the same as Figure 2, which means that the overlap of. Thus, using the value of the fractal dimension obtained from the SAS data (Figure 4) and the asymptotic values, we can find a good approximation of the number of rows k generated by ACA.
Conclusions
For self-similar fractals, the total number of scattering units in the iteration is given by [26]. The last expression shows that Eq. 20) can be extended for fractals generated by M¼pt-state cellular automata. We show how they can be implemented in the structural investigation of the fractals generated by ACA.
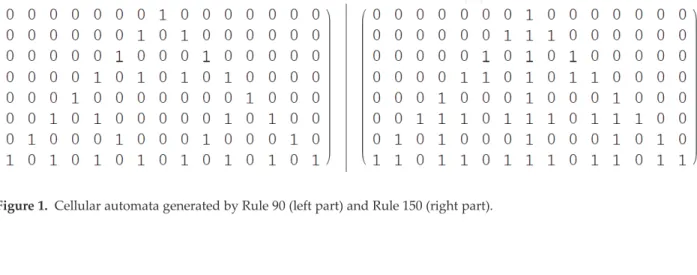
The analysis is performed using an efficient and optimized version of Pantos and the solid-mass barycentric method to calculate the small angle scattering and dimension spectra, respectively. The mathematical description of the general algorithm for the construction of the fractals using additive cellular automata (ACA) is explained. We show how to obtain the well-known Rule 90 and Rule 150 generating self-similar fractals using a deterministic algorithm.
We have shown cases when subsets of different states of 4-state ACA are mono- and multi-fractal. For each introduced M-state ACA, we calculate the scattering and the multi-fractal spectrum, and we explain how to extract the main fractal and structural properties such as the fractal dimension, the number of steps generated by ACA, the fractal iteration number, the scale factor, the overall size, the sizes of the basic units, and the system. The results obtained can be used for structural investigations of the nano-/microscale systems, modeled by cellular automata.
Small-angle scattering from the cantor surface fractal in the Koch plane and snowflake.
![Figure 2. PETRA III, the third generation of synchrotron light source at DESY Germany [31].](https://thumb-ap.123doks.com/thumbv2/1libvncom/9200781.0/5.918.133.785.244.503/figure-petra-generation-synchrotron-light-source-desy-germany.webp)