The calculation of Mie scattering ellipsometry of spherical polydisperse particles [1] was performed for the analysis of the experimental data. Evolution of the ellipsometric parameters by simulation: (a) the assumed geometric standard deviation of the size distribution is 1.4 and the assumed refractive indices are 2.3-0.35i, 2.0 and 1.7; (b) the assumed geometric standard deviation is 1.1 and the assumed refractive indices are 1.7, 1.5 and 1.4; (c) the assumed geometric standard deviations are and 1.05 and the assumed refractive index is 1.5; (d) the translation-driven log-normal size distribution on a linear size scale is assumed with the refractive index of 1.5, and the geometric mean size and geometric standard deviation are 50 nm and 2.0, respectively, for the first log-normal distribution [ 2 ].
Imaging Mie-scattering ellipsometry
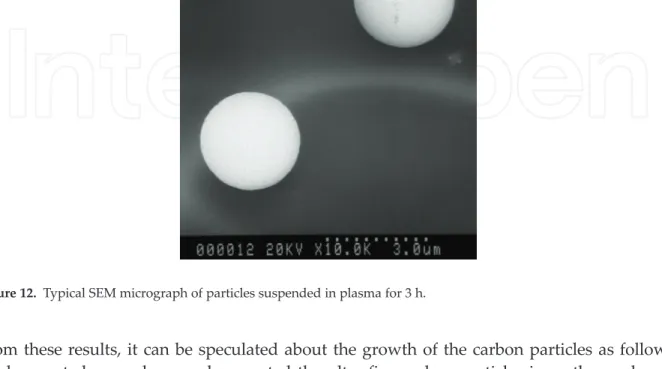
From these results, the growth of the carbon particles can be speculated as follows. From the spherical shape of the grown particles it is suggested that the particles are isotropically coated.
![Figure 13. Schematic of ellipsometry measurement with dust plasma chamber. Inserted upper and lower photos are analyzer module and polarizer module, respectively [12].](https://thumb-ap.123doks.com/thumbv2/1libvncom/9202170.0/15.918.134.817.370.496/figure-schematic-ellipsometry-measurement-inserted-analyzer-polarizer-respectively.webp)
Conclusion
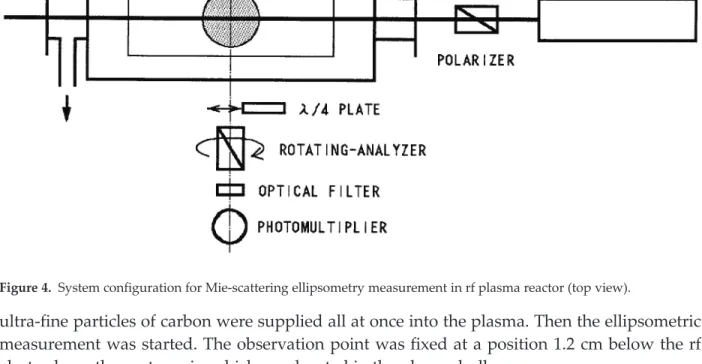
A Mie-scattering ellipsometry system, consisting of a laser, a polarizer, a rotary compensator, an analyzer and a 2D image sensor, was developed. Size dependence of optical properties and internal structure of plasma-grown carbonaceous nanoparticles studies by in situ Rayleigh-Mie scattering ellipsometry.
TOP 1%
Achromatic Ellipsometry: Theory and Applications
Introduction
The last one consists in the difference between left and right circularly polarized light, which results in the molecular asymmetry [6, 8, 9]. In this sense, emission ellipsometry (EE) is a technique that, combined with the Stokes theory, allows a complete description of the emitted light polarization states [6, 8, 9] and is thus an excellent alternative in the study of energy transfer processes, mainly in polymeric materials.
Stokes theory
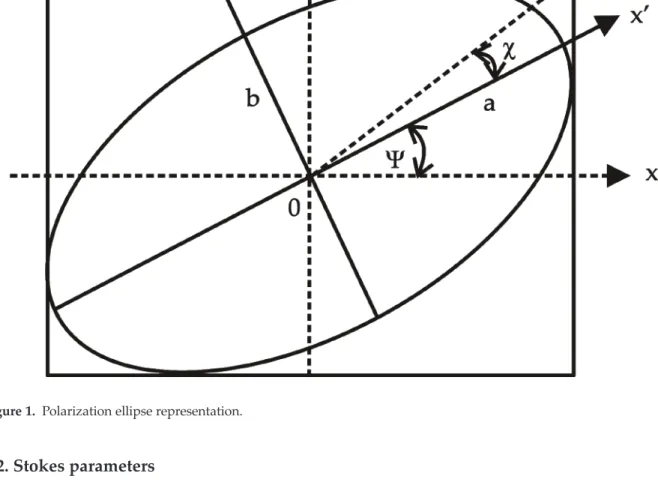
For example, studying energy transfer processes by investigating emitted polarized light can be very complicated if the polarized state is not fully described. The ellipse described by equation 3) has its axis and base rotated by an angle Ψ with respect to the reference plot xy, as seen in Figure 1. Since the Stokes parameters directly reflect the observed ones, we can represent the angle of rotation (Ψ) and ellipticity (χ) by Eqs. . 15) Finally, the degree of polarization (P) can be described by the Stokes parameters for any polarization state.
In general, these elements are polarizers and quarter-wave plates that can be arranged in various ways to obtain the Stokes parameters. These optical components can be represented mathematically as a Muller matrix [2, 12], and from the mathematical relations the Stokes parameters can be obtained (see Eq. In this matrix formalism, the effects on the light polarization of each beam due to optical components can be can also be represented mathematically by a matrix, in this case the Muller matrix [12, 14].
It may be noted, in Eq. 19), that the Stokes parameter S3 represents the difference IR IL and S0 the sum of intensities IR + IL. The exciting light in ERS is a laser source that can be decomposed into two circular polarizations: right and left.
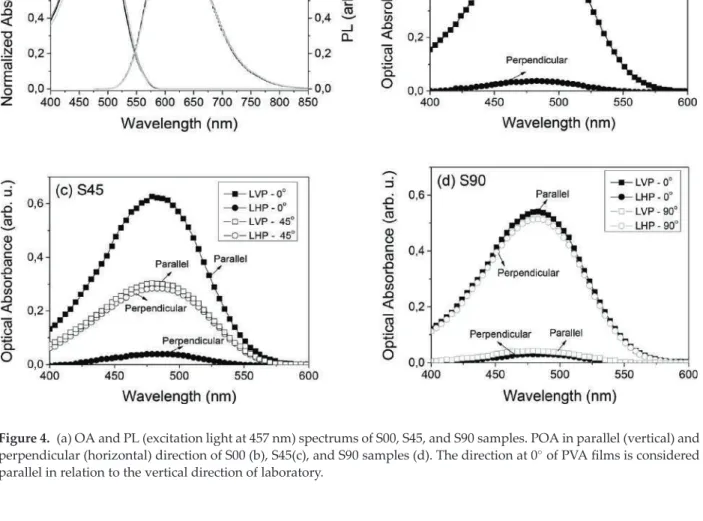
Applications
When incidence occurs first on the 45-degree face, the transmitted light has horizontal linear polarization. The incident light is vertically circularly polarized and interacts first with the 0-extension face, the transmitted light has horizontal linear polarization and a small fraction of the light is vertically circularly polarized. However, when the light interacts face first with the alignment 45, the transmitted light is linearly 45 polarized, there is still a portion of the transmitted light that has horizontal linear polarization.
When the incident light is left circularly polarized and first interacts on the face with alignment 0, the transmitted light is right circularly polarized. There is also a percentage of linear vertically polarized light for the measurement made when the light first interacts on the other side (alignment 45) of the sample. When the incident light has left circular polarization, it can be verified that the transmitted light has a significant value of linear vertical and left circular polarized light when the light first interacts on the face with 0 alignment.
When the incident light has right circular polarization, if the incident light first interacts with the 0-extension face, the transmitted light is linearly polarized +45. It is possible to observe that when the incident light first interacts with the 0-extension face, the transmitted light has a percentage of 45 linear and left circular polarized light.
Conclusion
Like the other samples, measurements on S90 were also made at a wavelength of 633 nm. If the incidence occurs first on the other face (alignment 90), the transmitted light is mainly linearly polarized +45, in which case there is still a small amount of horizontal linear polarization and right circular polarization. However, there is an inversion of the principal polarization state of light between the 0 and 90 extension face.
For the incidence performed in the other face (90 alignment), a percentage of this polarization state for the transmitted light is much smaller in relation to the incidence first achieved in the face with 0 alignment. EE and TE measurements verified complete molecular order in the doped liquid crystal cell. With TE measurements, the results allow for the presence of an effect occurring in the molecular ordering along the doped liquid crystal cell.
Emission ellipsometry used to investigate aggregation of the luminescent 2,1,3-benzothiadiazole dyes and ordering in an E7 liquid crystal matrix. Selection of our books indexed in the Book Citation Index in Web of Science™ Core Collection (BKCI).
The Development of Three-Intensity Measurement in PSA Ellipsometry and Photoelastic Modulation
Ellipsometry
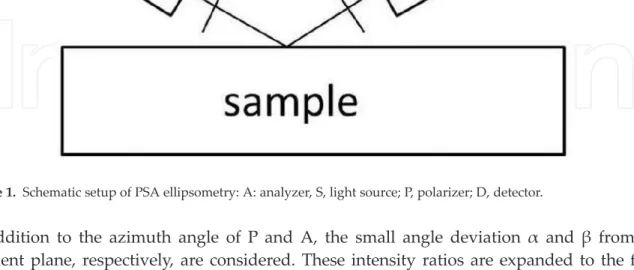
The alignment in PSA ellipsometry
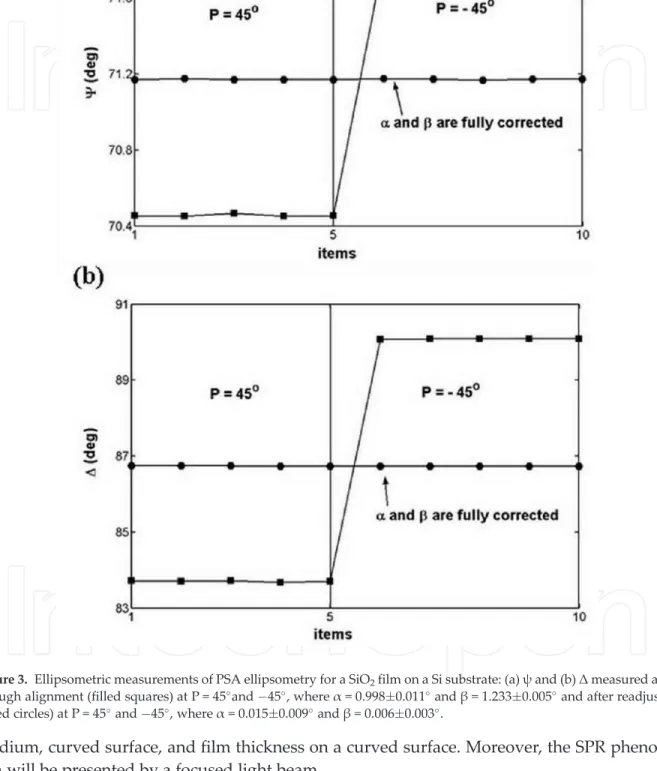
To align the azimuth angles P and A relative to the plane of incidence, the PSA configuration can be set at the desired angle of incidence (typically 70 in the IC industry). The measured reflectivity is expressed by ellipsometric parameters, Ψ,Δ, and azimuth angles P and A:. In addition to the azimuth angle P and A, small deviations of the angles α and β from the incident plane are also taken into account.
Two incidence angles [3], and fixed incidence angle by two samples and two wavelengths [6] are proposed to align the azimuth angles of polarizer and analyzer. Since there are only three unknowns, one can measure three intensities to derive the three parameters. Even there are deviations α and β for P and A respectively, one can replace those errors in the previous relations and obtain the analytical results, that is.
The most important aspect of this technique is the concept of direct determination, in contrast to setting the minimum intensity at zero ellipsometry, which not only requires a sensitive detector, but also requires a polarizer with a high extinction ratio. If the detector is a high dynamic range detector, the accuracy of this three-intensity measurement technique will be consistent with the commercial ellipsometer.
Three-intensity measurements technique in PSA ellipsometry
Knowing the refractive index profile (RIP) of this graded index structure is important not only to evaluate its performance in optical devices, but also to control the quality of products [9]. Ellipsometric imaging study of a flat GRIN lens: (a) azimuth deviation (α) of the surface. b) Measured refractive index profile (*: x-axis, ○: y-axis, solid line: RIP provided by NSG). Here, the same technique can be used to measure the RIP of dilute alcohol, as shown in Figure 7.
Tilting a plate confirms that α can be used to measure the surface normal line, as shown in Figure 8. In addition, one can rotate the tilted SiO2/Si to examine the cosines in three directions of the surface normal. The corrected Ψ and Δ are flat, from which the thickness of the coating can be subtracted.
Imaging ellipsometric study of the radius of curvature of the BK7 plano-convex lens: (a) the magnitude of the azimuth deviation (α) of the surface and (b) the derived and measured α of the lens at the center and the edge (dashed line : derived from the radius measured by the Zygo phase shift interferometer, solid line: measured by the imaging ellipsometric technique). Ellipsometric parameters and thickness profile of the cylindrical lens: (a)Ψand (b)Δmeasured when P = 45; (c)Ψand (d)Δmeasured when P =45; (e)Ψand (f)Δafter correction.
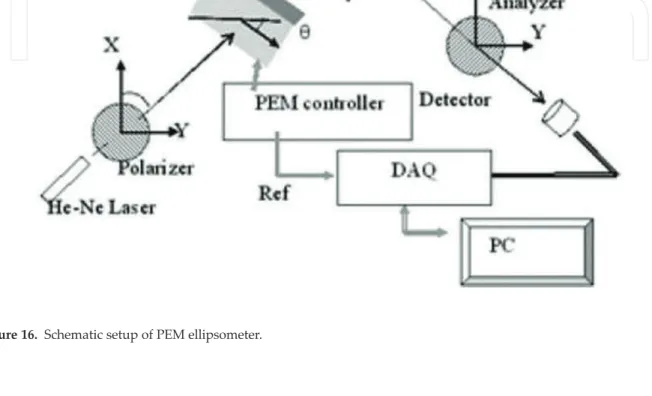
PEM ellipsometry
In this chapter, we implement two DAQ system options for strain axis alignment and PEM modulation amplitude calibration in ellipsometry: (1) lock-in amplifiers and (2) digitized oscilloscope. If the azimuth angle of the initial linearly polarized light is set to 45 and the deformation axis of the PEM deviates from the incident plane by θ, the measured intensity can be simplified by an angle. Idcð Þ ¼0 0:5I0tan2Ψ ½2þ sin 4θ (25) From this equation, the deformation axis of the PEM deviates from zero by θ, which can be measured by the direct intensity component.
The azimuth angle of A is 0 relative to the azimuth angle of the strain axis of PEM. The sample can be sandwiched between two TE coolers to maintain sample temperature uniformity. The voltage produced by the thermocouple can be obtained by one of the channels of the same data acquisition system.
Using a fixed polarizer and PEM, one can generate different polarization states (200/cycle, Hinds90) due to the harmonic oscillation property of the PEM. Using the figures 27bandc, one can conclude that the value of the average extinction coefficient and difference can be estimated from the height (H) of the dive using the parameter.
Future prospects
This work represents the power of the year-by-year analysis technique; only one cycle (20 μs Hinds PEM 90) of reflected intensity signals should be used to extract all optical parameters. Analytical solutions of polarizer and analyzer azimuthal deflection by polarizer-sample-analyzer ellipsometry. An Error Evaluation Technique for Angle of Incidence in a Rotating Element Ellipsometer Using a Quartz Crystal.
The development of tri-intensity measurements in PSA ellipsometry and photoelastic modulation ellipsometry http://dx.doi.org/10.5772/intechopen.70086 71. Development of a multi-angle phase and intensity measurement technique under surface plasmon resonance conditions. Phase-modulated ellipsometry for investigating the temperature-induced phase transition in ruthenium-doped lead zinc niobate-lead titanate single crystal.
![Figure 3. Experimental setup for the measurement of carbon particle growth [2].](https://thumb-ap.123doks.com/thumbv2/1libvncom/9202170.0/6.918.114.682.899.1205/figure-experimental-setup-measurement-carbon-particle-growth.webp)
![Figure 7. Experimental results of evolution of the ellipsometric parameters during carbon particle growth [2].](https://thumb-ap.123doks.com/thumbv2/1libvncom/9202170.0/9.918.140.782.861.1206/figure-experimental-results-evolution-ellipsometric-parameters-carbon-particle.webp)
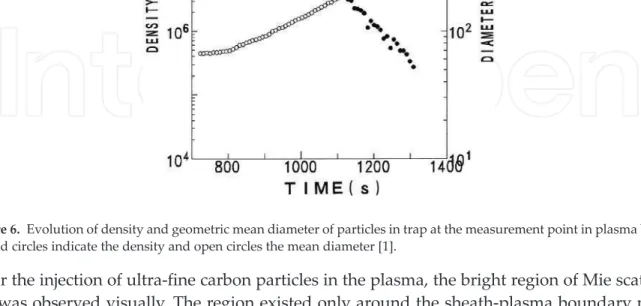
![Figure 10. Evolution of particle diameter (open circles and a broken curve) and density (closed circles and solid lines) with time [3].](https://thumb-ap.123doks.com/thumbv2/1libvncom/9202170.0/13.918.144.783.244.538/figure-evolution-particle-diameter-circles-broken-density-circles.webp)
![Figure 11. Photographs of a Coulomb crystal viewed from the side port (a) and the upper port (b) of the reactor [3].](https://thumb-ap.123doks.com/thumbv2/1libvncom/9202170.0/13.918.187.725.621.812/figure-photographs-coulomb-crystal-viewed-port-upper-reactor.webp)