In addition, by changing the optical power of the slanted DFOTs, we can change the effective spring constant on the particles encapsulated in a polyacrylamide gel compartment. Beads near the surface of the polyacrylamide gel were selected for the optical trapping experiments.
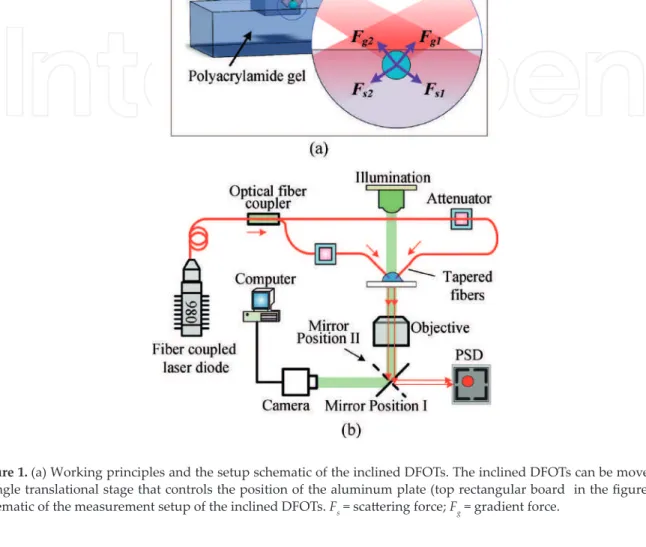
Experimental measurements of polyacrylamide gel and discussion 1. Experimental results measured by inclined DFOTs
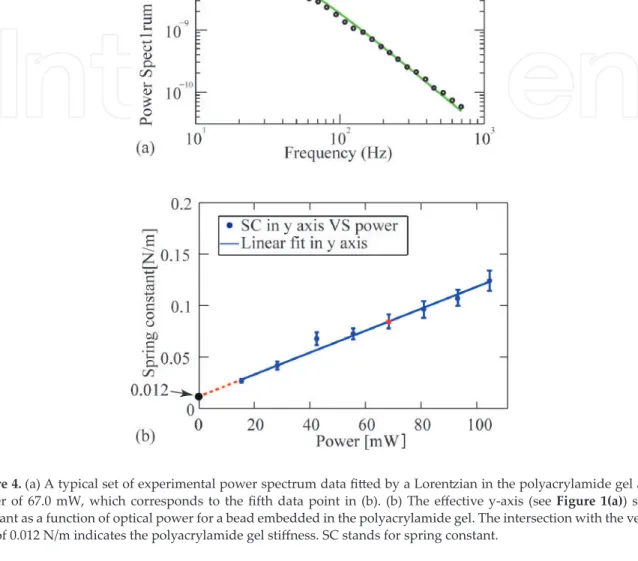
The stiffness of the polyacrylamide gel is then calculated based on the resultant displacement of the bead and the applied force. Therefore, it was important to investigate the influence of polyacrylamide gel stiffness on bead depth in the simulation.
Conclusion
When the bead is deeper than 10 µm from the surface, the variation in stiffness becomes small, as shown in Figure 6(d). The spring rate measurements allow the sloped DFOTs to directly measure forces on the bead when displacement is monitored.
Acknowledgements
The displacement field of the polyacrylamide gel is not greatly affected by the surface when the bead is far away from the surface of the polyacrylamide gel, as shown in Figure 6(c). According to the simulation results shown in Figure 6(d), we can see that the optical capture measurement of polyacrylamide gel stiffness matches the simulation results based on AFM measurements when the top surface of the bead is in the range of -1 to 2 μm above the polyacrylamide gel surface.
Author details
Quantitative analysis of the viscoelastic properties of thin sections of fibroblasts using atomic force microscopy. Fiber-based optical tweezers for simultaneous in situ force application and measurements in a 3D polyacrylamide gel compartment.
Nonlinearity-Tolerant Modulation Formats for Coherent Optical Communications
Introduction
In Section 2, we discuss the so-called X-constellation, which is an eight-dimensional (8D) code and has greater nonlinearity tolerance than the dual-polarization (DP) binary phase-shift keying (BPSK) format of the same spectral efficiency of 2 bits/4D symbols. Separate nonlinear component analysis shows that the reduction of self-phase modulation (SPM) and interphase modulation (XPM) are the main causes of the improvement with 4D constant modulus formats.
X-constellation
Instead, constant modulus 4D modulation formats (i.e., the power of the combined X and Y polarizations are constant) were proposed. One of the constant modulus 4D formats is 8PolSK-QPSK [19], in which eight polarization states in the Stokes space representation carry four different absolute phases, as shown in Figure 2.
![Figure 1. The measured Q-factor for DP-BPSK (circle) and X-constellation (triangle) following 5000 km of high density WDM propagation [4].](https://thumb-ap.123doks.com/thumbv2/1libvncom/9201385.0/23.918.136.783.247.680/figure-measured-factor-constellation-triangle-following-density-propagation.webp)
4. 4D-2A8PSK
Conclusion
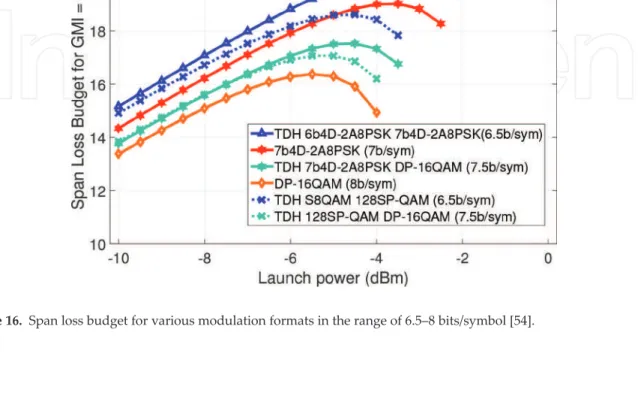
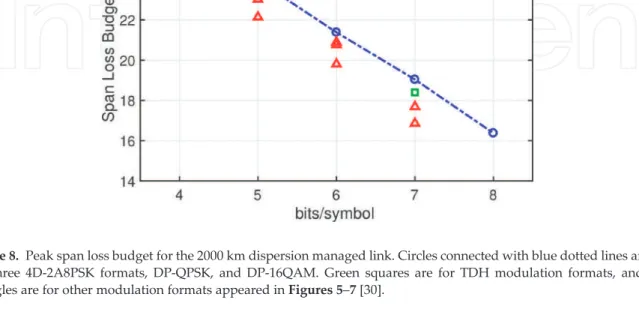
We reviewed nonlinearity-tolerant modulation formats, including the recently proposed family of 5, 6, and 7 bits/symbol 4D modulation formats based on 2A8PSK. A series of transmission simulation results show that this 2A8PSK family exhibits better nonlinear performance than conventional modulation formats at every relevant spectral efficiency, especially for dispersion-managed links known to have high fiber nonlinearity. Since these modulation formats in the 4D-2A8PSK family differ only in parity bits, they can be realized with very similar hardware with different spectral efficiencies between DP-QPSK and DP-16QAM.
Range loss budget of three modulations for the same data rate, as a function of launch force for the target normalized GMI = 0.85. Information rate achievable in non-linear WDM fiber optic systems with arbitrary modulation formats and scatter maps. Demonstration of an 8-dimensional modulation format with reduced inter-channel nonlinearities in a polarization multiplexed coherent system.
On the performance of Nyquist-WDM terabit superchannels based on PM-BPSK, PM-QPSK, PM-8QAM or PM-16QAM subcarriers. Long-distance transmission of four-dimensional 64SP-12QAM signal based on 16QAM constellation for longer distances with the same spectral efficiency as PM-8QAM. Trellis-encoded high-dimensional modulation for polarization crosstalk self-cancellation in coherent optical communications.
Fiber Laser for Phase-Sensitive Optical Time-Domain Reflectometry
Experimental results and discussion
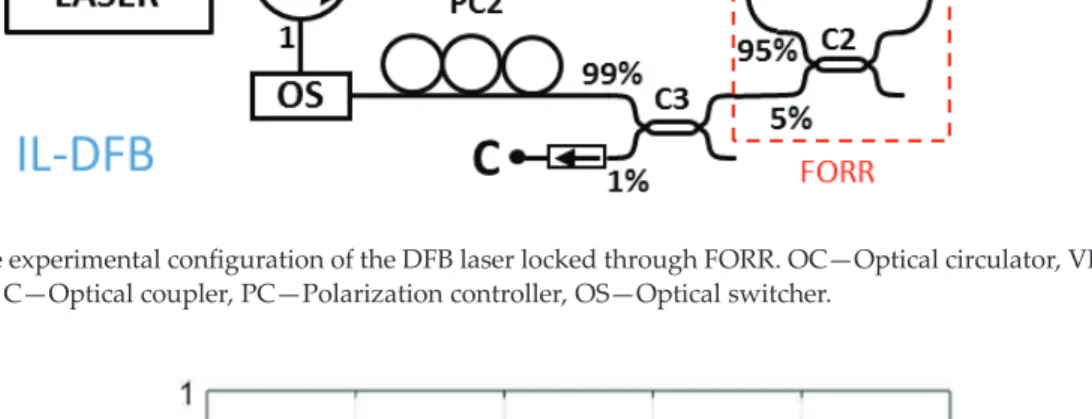
The lock-in performance strongly depends on the parameters of the VRC coupler used in the FORR. The refinement of the resonator strongly depends on the total cavity losses and the coupling coefficient. Delayed self-heterodyne spectra of an IL-DFB laser recorded with a laser stabilized for operation in the critical coupling regime.
The configuration of the w-OTDR system with the IL-DFB laser operating in the critical coupling regime is shown in Figure 9. Superposition of the absolute values of the differences between adjacent consecutive traces recorded with the IL-DFB laser. Superposition of the absolute values of the differences between the mean traces for the IL-DFB laser, m = 10 and N = 75.
The signal peak exceeds the maximum of the noise value in 2.1 times and the average noise value about 10 dB. The signal peak exceeds the maximum of the noise value in 1.4 times and the average noise value by about 8 dB. Superposition of the absolute values of differences between mean traces for IL-DFB laser, m = 23 and N = 75.
Conclusion
An autonomous measurement system for the localization of loss-induced disturbances based on transmission and reflection analysis. Transmission/Reflection Analysis for Time-Sequential Multipoint Disturbance Localization in a Distributed Fiber Optic Loss Sensor Based on Rayleigh Backscattering. 12] Bueno Escobedo JL, Spirin VV, López-Mercado CA, Lucero AM, Mégret P, Zolotovskii IO, Fotiadi AA.
The use of optical frequency domain reflectometry in remotely distributed measurements of γ-radiation dose. Optimization of a distributed fiber optic sensor system based on phase-sensitive OTDR for fault detection. 30] Spirin VV, López-Mercado CA, Kinet D, Zlobina EA, Kablukov SI, Mégret P, Zolotovskiy IO, Fotiadi AA.
32] Spirin VV, Lopez-Market C. A., Nasayaat-Escobedo JL, Bituen A. M., Zolotovskii I. O., Megret P., Fotiadi A. A.. Self-injection locking ti DFB laser babaen ti akinruar a singsing a lanot a wangawangan: kababalin ti polarisasion. 37] Lopez-Market C. A., Spirin VV, Nasayaat a Panag-scouring JL, Bituen A. M., Megret P., Zolotovskii I.O., Fotiadi A. A..
Optoelectronic Design of a Closed-Loop Depolarized IFOG with Sinusoidal Phase Modulation for
Intermediate Grade Applications
Sensor design
The PM zone of the IOC comprises two pairs of electrodes placed symmetrically with respect to the central axis of the integrated block. The two optical waves CW (clockwise) and CCW (counterclockwise) coming from the sense coil converge at the Y-junction at the input of the IOC. IOC contains two pairs of electrodes placed symmetrically with respect to the central axis of the integrated block.
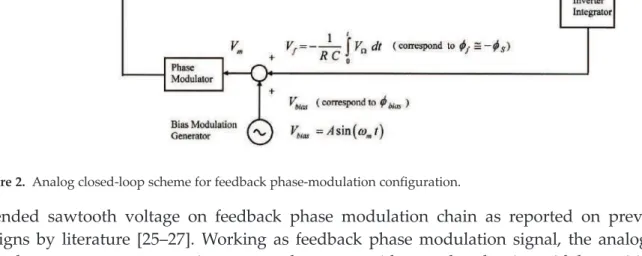
The block diagram of the electronic scheme of the phase modulation and demodulation circuit is represented in Figure 2. Here, Δϕ represents the effective phase difference of the two counter-propagating optical waves on the sensing coil. This value originates from the combined effect of the phase modulation process (ϕm ¼ϕbiasþϕf) and the Sagnac phase shift induced by the rotation speed (ϕS).
The photodetector output, in photocurrent form, is proportional to the light intensity at its optical input. The corresponding voltage signal at the output (VS) scales as a sine function of the effective Sagnac phase difference. The error signal at the output of the comparator (VεΔϕ) tends to become zero in the mean time due to the phase cancellation (the mean time of the phase modulationϕ bias of the reference bias is 0).
Calculations and estimations
In this table, the third column shows the value calculated directly by the formula, and the fourth shows the estimated results of the optical and electronic simulations. The threshold sensitivity takes into account the SNR at the photodetector optical input provided by the optical simulation, and the dynamic range and scale factor are determined by the nonlinearity of the sine function (assuming the maximum value ϕS¼ π=6). In the formulas, this is the h parameter of the optical fiber and is the average integration time.
Simulation results
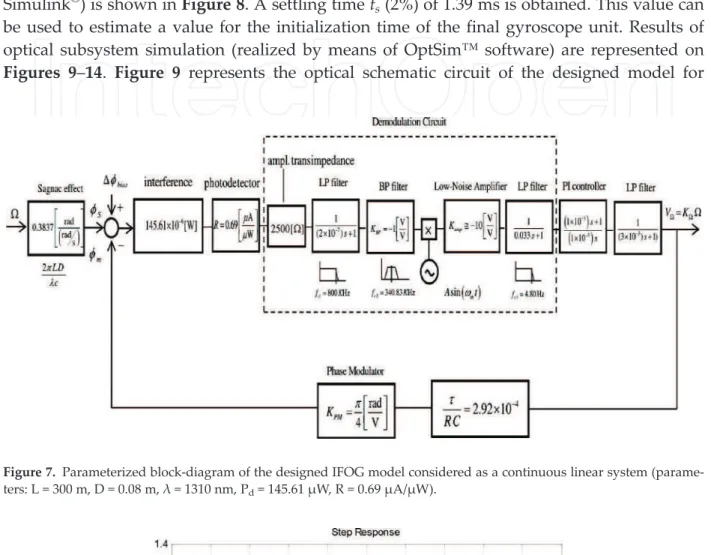
Here, the values of the parameters identified on its optical and electronic circuits are taken into account. This value can be used to estimate a value for the initialization time of the final gyroscope unit. Time response of the complete closed-loop system obtained for step-stimulus input signal (for step-stimulus input the ts2% settling time obtained is 1.39 ms).
Interferometric signal at electrical output of APD-equivalent photodetector (after electrical BP filter, fcenter= 340.83 kHz) when Ω=20/s is applied to the system. Interferometric signal at electrical output of APD-equivalent photodetector (after electrical BP filter, fcenter= 340.83 kHz) when Ω=10/s is applied to the system. Interferometric signal at electrical output of APD-equivalent photodetector (after electrical BP filter, fcenter= 340.83 kHz) when Ω=30/s is applied to the system.
After performing the appropriate calculations, taking into account the theoretical value of the SF (Scale Factor) of the gyroscope that appeared in Table 1, a linear. In this way it is possible to evaluate the linearity of this graph and then assume this value as the scale factor linearity of the IFOG model. Tables 2–4 also contain the values (VΩ)lin [mV] of the corresponding linear adjustment, the module of the difference values Δ(VΩ) [mV] and the module |Δ(VΩ)/ (VΩ)lin| of the ratio values.
Discussion of simulation results
But a very large reduction in optical power also lowers the SNR at the photodetector, so to keep it at a high level, the optical power emitted by the light source cannot be greatly reduced. The noise associated with the fiber's nonlinear Kerr effect is based on the electro-optical phenomenon consisting of changes experienced by the optical fiber's refractive index caused when it is excited by an optical wave that varies in amplitude. In the case of the gyroscopic system, this optical power variation coupled to the fiber coil causes changes in the refractive index, resulting in a phase change in the optical wave propagating along the length of the optical fiber coil.
Another important aspect is providing the light source with a thermal stabilization system to achieve a constant level of optical power. Other small sources of optical noise with less effect on the optical signal detected by the photodetector result from backscatter and reflection phenomena along the length of the sensing fiber coil. A serious drawback of this model design is that the results of optical simulation do not allow to evaluate the main sources of optical noise.
A convenient way to overcome this source of noise is to perform a selective filtering at the frequency of the desired signal and later adjust the gain of the gain stages to increase the electrical SNR at the output. In the case of the designed IFOG circuits, strict design of LPF (Low-Pass-Filter) and BPF (Band-Pass-Filter) is necessary after photo detector amplifier. It is due to the fact that it depends on the linearity of the obtained VΩversusΩ graphical representation derived from the signal demodulation process.
Conclusions
Advances in Fiber Optic Gyroscope Applications II with Emphasis on the Theory of Depolarized Gyroscopes. Establishment of all digital closed-loop interferometric fiber optic gyroscopes and scale factor comparison for open-loop and all digital closed-loop configurations.
![Figure 3. Q-factor calculated from pre-FEC BER vs. normalized GMI for four modulation formats [30].](https://thumb-ap.123doks.com/thumbv2/1libvncom/9201385.0/25.918.134.784.894.1204/figure-factor-calculated-fec-ber-normalized-modulation-formats.webp)
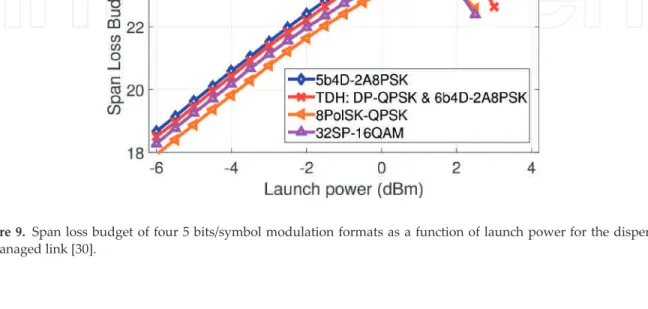
![Figure 5. Span loss budget of four 5 bits/symbol modulation formats as a function of launch power for the DM link [30].](https://thumb-ap.123doks.com/thumbv2/1libvncom/9201385.0/28.918.134.784.888.1201/figure-span-budget-symbol-modulation-formats-function-launch.webp)
![Figure 10. Generalized Q-factor as a function of OSNR with separated nonlinear effects at a launch power of 4 dBm [30].](https://thumb-ap.123doks.com/thumbv2/1libvncom/9201385.0/32.918.115.805.902.1186/figure-generalized-factor-function-separated-nonlinear-effects-launch.webp)
![Figure 11. Generalized Q-factor for 6b4D-2A8PSK and DP-Star-8QAM with separated nonlinear effects at a launch power of 4 dBm and OSNR of 15.2 dBm [30].](https://thumb-ap.123doks.com/thumbv2/1libvncom/9201385.0/33.918.141.783.244.597/figure-generalized-factor-star-separated-nonlinear-effects-launch.webp)
![Figure 15. Span loss budget for various modulation formats in the range of 4–6 bits/symbol [54].](https://thumb-ap.123doks.com/thumbv2/1libvncom/9201385.0/36.918.143.782.796.1199/figure-span-budget-various-modulation-formats-range-symbol.webp)
![Figure 14. Experimental result of (a) Q from GMI and (b) required OSNR for two types of LLR calculation: Ideal (dotted line) and the proposed in Figure 12 (solid line) [44].](https://thumb-ap.123doks.com/thumbv2/1libvncom/9201385.0/36.918.135.788.244.684/figure-experimental-result-required-calculation-ideal-proposed-figure.webp)