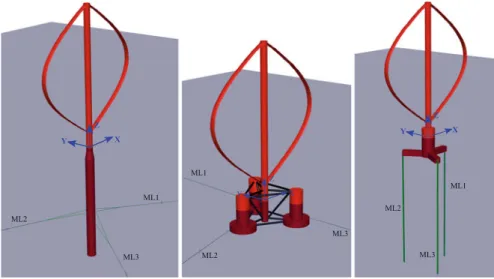
Using the HAWC2 code, Paulsen et al. 2013) performed a design optimization of the proposed DeepWind concept. Using a 5 MW two-bladed Darrieus rotor, the dynamic responses of three floating VAWT concepts ( Cheng et al. 2015a , 2015c ) are studied by fully coupled nonlinear time-domain simulations. The concepts were originally designed to support the NREL 5 MW wind turbine (Jonkman et al.2009).
Based on these two methods, Wang et al. developed two aerodynamic codes for fully coupled modeling and analysis of hovering VAWTs.
Hydrodynamics
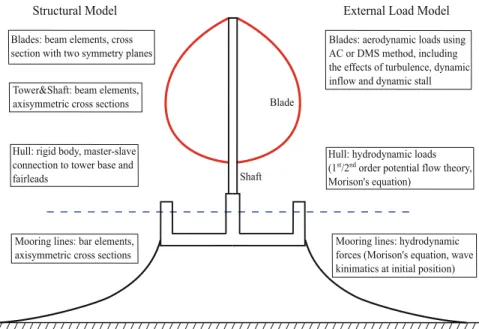
The DMS model implemented by Wang et al. 2013) accounts for the effect of variation in the Reynolds number and incorporates the effect of dynamic stall using the Beddoes-Leishman dynamic stall model. The AC model implemented in Cheng et al. 2016b) includes the effects of wind shear and turbulence, and dynamic inflow. The effect of dynamic stall is also incorporated using the Beddoes-Leishman dynamic stall model.
When the second-order wave force becomes important for structures with natural frequencies that are either very low or close to twice the wave frequency, second-order potential flow theory is used to account for mean drift, difference frequency, and sum-frequency wave forces using the Newman approximation or quadratic transfer function (QTF).
Structural Dynamics
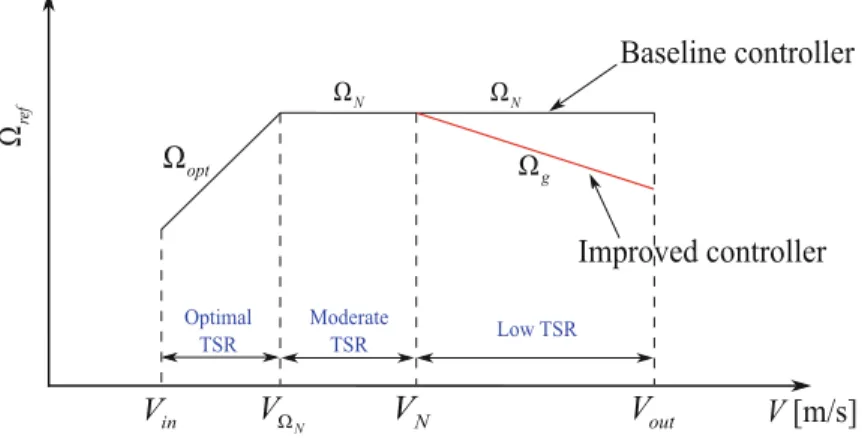
Control System
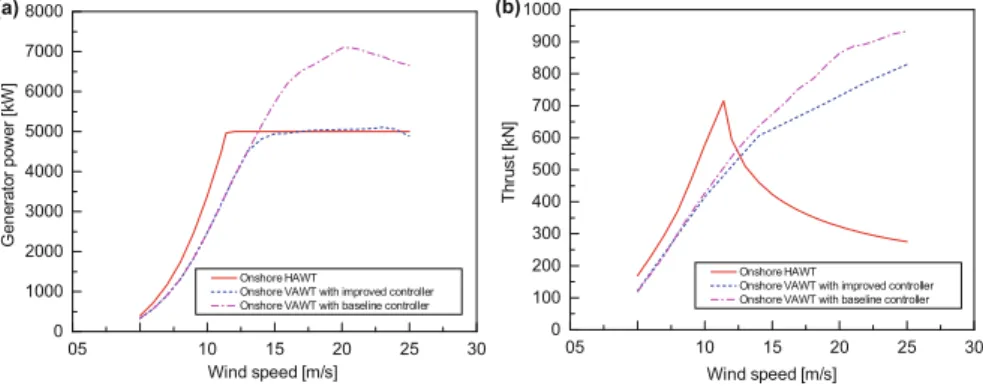
However, the control objectives in region III shift to limit the aerodynamic loads acting on the rotor by limiting the rotational speed. This baseline controller is able to maximize the power capture for wind speeds below VN and maintain the rotational speed for wind speeds above VN, while the improved controller aims to maximize the power capture for wind speeds below VN and keep the power capture approximately constant for the above. wind speeds. Figure 12.6 shows the average generator power and thrust for a 5 MW Darrieus rotor with different controller.
Above the nominal wind speed, the improved controller successfully keeps the average generator power approximately constant.
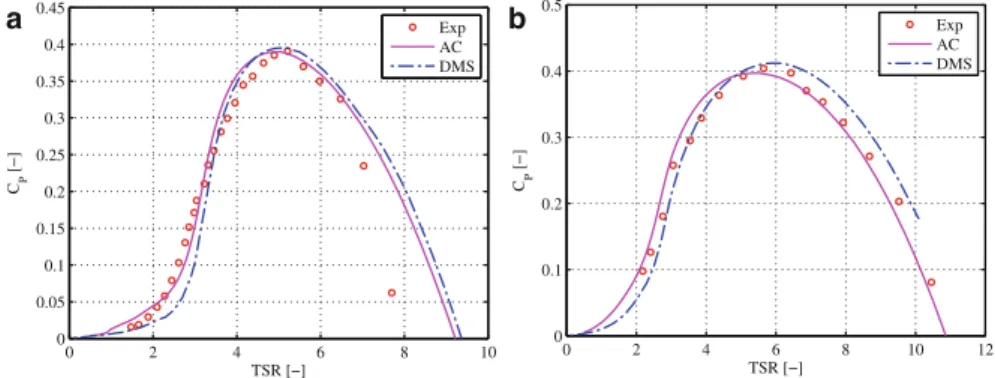
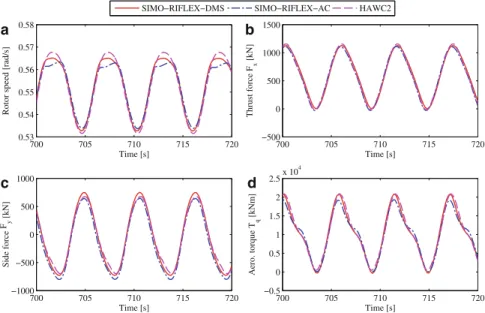
Verification of the Fully Coupled Codes
In this case, the rotor rotates at relatively low tip speed ratios and two control strategies are considered here, as illustrated in Figure 12.5. The load cases shown in these two figures correspond to a tip speed ratio of 4.39 and 2.51, which lie in regions I and II, respectively, as illustrated in Figure 12.5. The developed codes SIMO-RIFLEX-DMS and SIMO-RIFLEX-AC are accurate enough in predicting the aerodynamic loads for VAWTs on land.
It has been found that the SIMO-RIFLEX-AC code can to some extent more accurately predict dynamic responses than the SIMO-RIFLEX-DMS code.
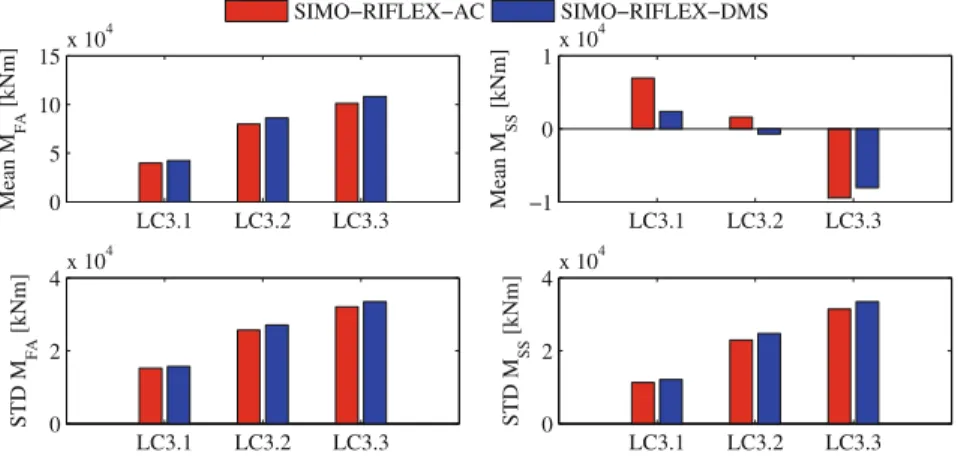
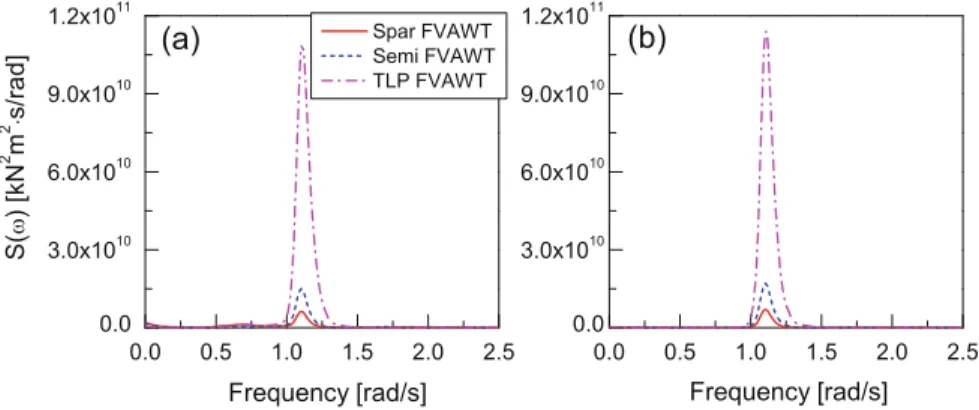
Dynamic Response Characteristics of Three Floating VAWTs
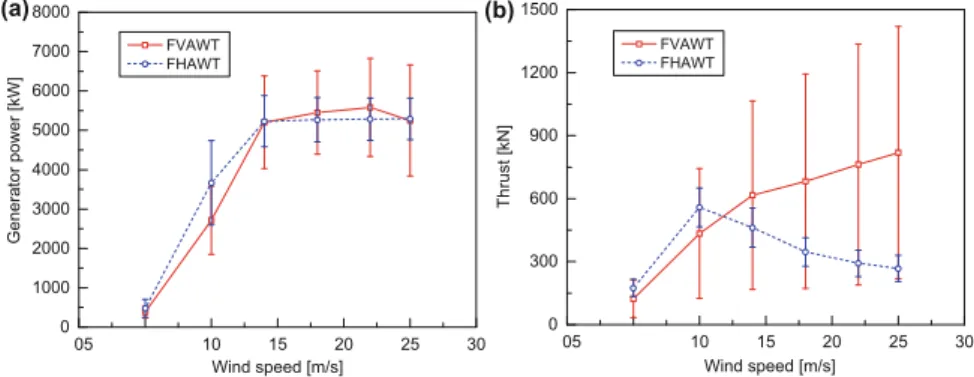
The generator power variations for the three floating VAWT concepts are also very close to each other. But the standard deviations of spar VAWT and half VAWT in pitch movements are very close to each other. In terms of yaw motion, the average yaw motions of the three floating VAWT concepts are quite close.
As a result, the standard deviations of MFA and MSS for spar VAWT and semi VAWT are smaller than for TLP VAWT.
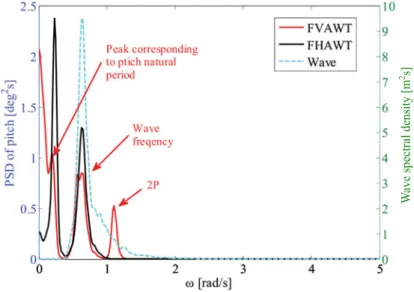
Comparative Study of Floating HAWTs and VAWTs
Semi HAWT vs. Semi VAWT
Spar HAWT vs. Spar VAWT
Figure 12.14 shows the fore-aft and side-to-side tower base bending moment power spectra for HAWT and VAWT spars in turbulent and irregular wave conditions with UwD14 m/s, HsD3.62 m, TpD10.29 s. In addition, the fore-aft tower base bending moment for the VAWT spar also includes the apparent response induced by the low-frequency turbulent wind and the wave frequency response. In relation to the HAWT spar, the fore-aft tower base bending moment consists of.
12.15 1 Hz damage equivalent fatigue loads (DEFLs) of tower base fore-aft bending moment (MFA) and side-side bending moment (MSS) for spars HAWT and VAWT.
Conclusions
Moreover, the tower base of the spar HAWT is mainly affected by the front-back bending moment, while the side-to-side bending moment can be neglected. The tower base of the spar VAWT will suffer relatively greater fatigue damage than that of the spar HAWT, as shown in Fig. The DEFL of the fore-aft bending moment for the spar VAWT above the rated wind speed is approximately twice that of the spar. HAWT.
Furthermore, the lateral bending moment DEFL for the VAWT spar is more than six times that of the HAWT spar. Stochastic dynamic response analysis reveals that 2P effects resulting from 2P aerodynamic loads are prominent in the dynamic responses of these concepts. Due to the compatible catenary, spar and semi-submersible mooring systems can help mitigate 2P effects on structural loads and mooring line tensions compared to the TLP concept, at the cost of larger rig movements.
Due to different aerodynamic load characteristics and control strategies, the VAWT results in higher average tower base bending moments and mooring line tensions above the rated wind speed. As significant 2P aerodynamic loads act on the VAWT flaps, the generator power, tower base bending moments and delta line stresses show a marked 2P variation. Acknowledgments The authors would like to acknowledge the financial support of the EU FP7 project MARE WINT (project no. 309395) and the Research Council of Norway through the Center for Ships and Ocean Structures (CeSOS) and the Center for Autonomous Maritime Operations and Systems (AMOS) at the Department of Maritime Technology Norway University of Science and Technology (NTNU), Trondheim, Norway.
Open Access This chapter is distributed under the terms of the Creative Commons Attribution-NonCommercial 4.0 International License (http://creativecommons.org/licenses/by-nc/4.0/), which permits any use, duplication, adaptation, distribution, and reproduction without -commercial in any medium or format, as long as you give the original author(s) and source proper credit, provide a link to the Creative Commons license, and indicate if changes have been made. Images or other third-party material in this chapter are included in the work's Creative Commons license, unless otherwise indicated in the credit line; if such material is not included in the Creative Commons license of the work and the corresponding action is not permitted by legal regulations, users will need to obtain permission from the license holder to copy, adapt or reproduce the material.
The TLP is not a good substructure for vertical axis wind turbines unless the cyclical variation of aerodynamic loads is significantly reduced. Borg M, Collu M, Kolios A (2014a) Offshore vertical-axis floating wind turbines, state-of-the-art dynamic modelling. Borg M, Shires A, Collu M (2014b) Offshore floating vertical axis wind turbines, state of the art dynamic modeling.
Cheng Z, Wang K, Gao Z et al (2015b) Comparative study of floating horizontal and vertical spar type wind turbines exposed to constant wind. Cheng Z, Madsen HA, Gao Z et al (2016a) Aerodynamic Modeling of Floating Vertical Axis Wind Turbines Using the Actuator Cylinder Method. Cheng Z, Madsen HA, Gao Z, Moan T (2016b) A fully coupled method for numerical modeling and dynamic analysis of floating vertical axis wind turbines.
Collu M, Borg M, Shires A et al (2013) FloVAWT: progress in the development of a coupled dynamics model for floating vertical-axis offshore wind turbines. Paulsen US, Madsen HA, Hattel JH et al (2013) Design optimization of a 5 mw floating vertical-axis offshore wind turbine. Wang K, Hansen MOL, Moan T (2014a) Dynamic analysis of a floating vertical axis wind turbine under emergency stop using a hydrodynamic brake.
Wang K, Hansen MOL, Moan T (2015b) Model improvements for evaluating the effect of tower tilt on the aerodynamics of a vertical-axis wind turbine. Wang K, Moan T, Hansen MOL (2016) Stochastic dynamic response analysis of a floating vertical-axis wind turbine with a semi-submersible driver.
Bottom Fixed Substructure Analysis, Model Testing and Design for Harsh Environment
- Introduction
- Determination of Design Wave
- Hydrodynamic Loads
- Analytical and Empirical Formulations .1 Morison Equation
- Higher Harmonic Forces
- Impulse (Slam) Forces from Breaking Waves
- Numerical Analysis
- Star CCM CC
- Results
- Stokes 5th Order
- Breaking Wave
- Conclusions
The extreme and fatigue response stresses strongly depend on the dynamic behavior of the wind turbine structure. Triangular force distribution FslamD0:5bfiI (13.4b) The parameter indicating how much of the wave crest (b[m]) is active in the impulse force is defined as the “curl factor”. Numerical analyzes within the AQUILO project were done using the commercial CFD package StarCCMCC.
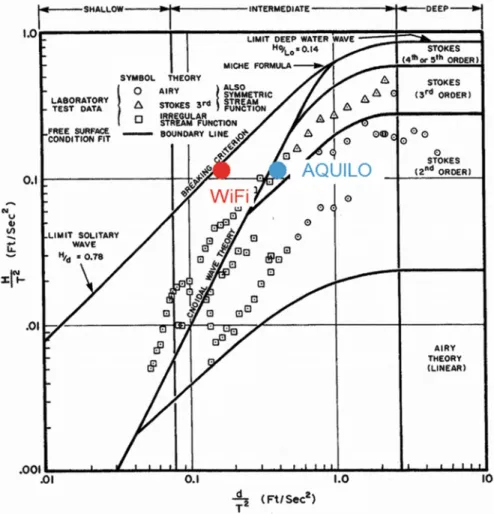
Waves investigated within the framework of AQUILO can be described as weakly non-linear, and they are well estimated by Stokes' 5th order regular wave theory (Fig.13.1). It is suggested that the initialized wave parameters are close to the characteristics of the specific wave of interest. In the "forcing" technique, the idea is to have a free zone around the structure of interest, while solutions in the rest of the domain are forced in the direction of theoretical solutions (Fig.13.7).
13.12) where is the force coefficient; is the solution of the transport equation at the given CV center of gravity; andis the value to which the solution is forced. In the framework of the AQUILO project, experimental analyzes were performed on four types of support structures: monopile, gravity-based construction, tripod with pile foundation, and gravity-tripod construction (Fig. 13.10). Due to wavemaker operation limitations, the depth of the towing tank does not match the design water depths (in a full case, the design water depth for a tripod structure is 60 m, while in CTO facilities the minimum feasible water depth was 120 m).
The location of the model relative to the free surface is then adjusted using an additional support structure mounted on the bottom of the towing tank (Fig.13.11). It is clear that the difference in water depth results in an incorrect modeling of the wave kinematics. To minimize the vertical movement of water particles near the foundation, a round flat plate was mounted under the model (Fig.13.11).
The secondment to Deltares was realized in the context of the joint industry project WiFi (Wave Impacts on Fixed Turbies).
Detection of Damage in Metallic Structures for Offshore Applications
- Introduction
- Methodology Overview
- Neutral Axis
- Damage Sensitive Feature
- Bi-Axial NA tracking
- Kalman Filter
- Structure Modelling
- DTU 10 MW RWT
- Nordtank NTK 500/41 Wind Turbine
- Numerical Simulations
- Need for KF tracking
- NA as a Damage Sensitive Feature
- Bi-axial NA tracking
- Robustness of KF
- Validation
- Need for KF Based NA Tracking
- Conclusions
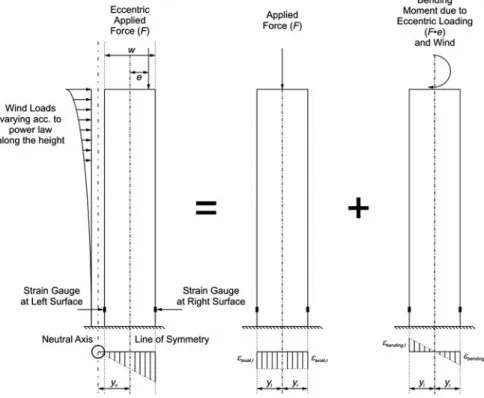
The tower structure's primary function is to support the hub and nacelle of the wind turbine. To locate the damage, you need the coordinates of the damage location along x;. With the mutually perpendicular sensor placement, the damage can be observed in the form of the sine and cosine component.
The sign of the change in the NAE of both axes determines the exact location of the damage. The power increases according to the power law along the height of the tower (Sen et al. 2012). The simulated damage was detected by comparing the NAE of the damage and the undamaged element.
The Kalman filter is a powerful tool for estimating state variables, especially in the presence of measurement noise. The NA estimation is independent of the initial NA setting, making the damage detection methodology robust. As can be seen, the lower the covariance value, the faster convergence is achieved.
Figure 14.4 shows the effect of uncertainty in strain measurements on NA estimation. In order to determine the effectiveness of both methods, strain and twist angle measurements from a Nordtank NTK 500/41 wind turbine were used to estimate NA. In addition, the KF-based estimation average is more accurate than the direct method.
In addition, current damage detection studies have been limited to reducing the flexural stiffness of a tower member.
Reliability & Preventive Maintenance of Offshore Wind Turbines