Several aspects that describe the state of the atmosphere in the North Sea region are dealt with in this chapter. In Table 5.3 these changes are presented for the end of the 21st century averaged over the Atlantic region.
Precipitation
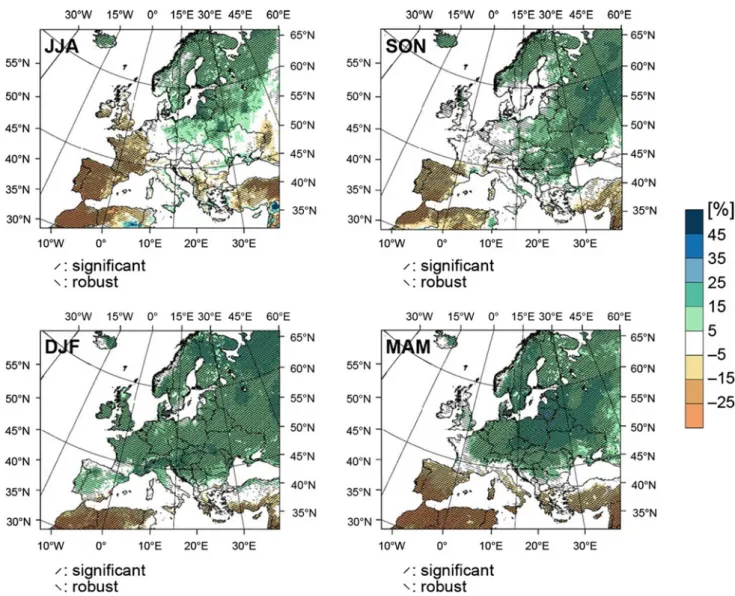
According to Brutel-Vuilmet et al. 2013) CMIP5 simulations show more snow-related changes in the mid-latitude Northern Hemisphere at the end of the 21st century. At the end of the 21st century, they found an increase in the 20-year yield rate of about 10–20% in the North Sea region for RCP8.5.
Cyclones and Winds
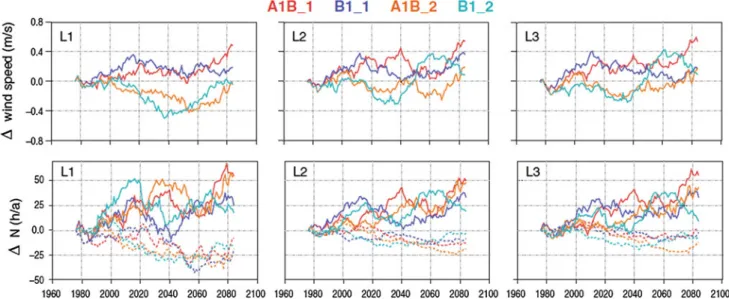
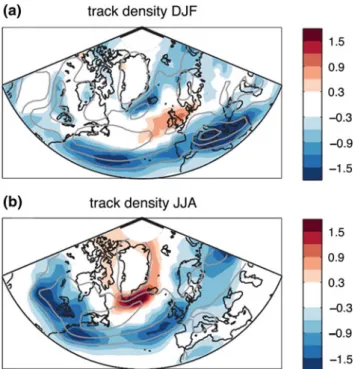
The middle group of several models showed enhanced extreme winds in the ms−1 range in the North Sea region at the end of the 21st century. 2011) analyzed predicted changes in the direction of mean winds at the global level based on CMIP3 simulations.
Radiation and Clouds
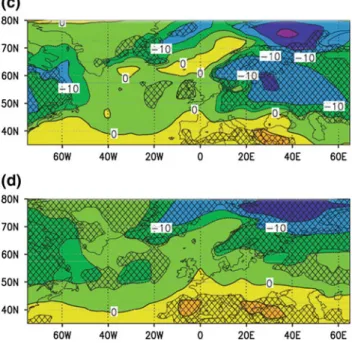
By the end of the 21st century, they found an increase in annual average cloud cover of up to 8% in the northern part of the North Sea region and a decrease of up to 8% in the southern part. Given the importance of predicted changes in cloud cover in the North Sea region, further investigations into changes in specific cloud properties, i.e.
Conclusions
Contribution of Working Group I to the Fifth Assessment Report of the Intergovernmental Panel on Climate Change. Contribution of Working Group II to the Fifth Assessment Report of the Intergovernmental Panel on Climate Change.
Introduction
Sea Level, Storm Surges and Surface Waves
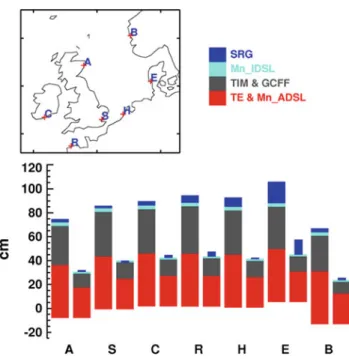
This adds further evidence that there is low confidence in the AR5 estimates of the potential contribution of ice sheets to future changes in sea level. The time series of the closest estimates, Ijmuiden in the Netherlands (which is within the NOSCCA region of interest) and Brest in France (which is outside but close to the NOSCCA region of interest) are shown in Fig.6.4. The recent study by Pickering et al. 2012) suggest that changes in the tides in the North Sea may result from altered dynamics.
Much of the progress in the Northeast Atlantic and North Sea has used the dynamic wave modeling approach. For a doubling of carbon dioxide (CO2) the wave climate responds to projected changes in wind strength and mean wave height (taken as the mean height of the highest third of waves) increases in the North Sea and north of Britain. The islands. Changes in significant mean and severe wave heights (99th percentile) within a single projection and between projections are of the same order of magnitude as the change (increase in the eastern North Sea) towards the end of the 21st century.
For the western parts of the North Sea, a decrease is suggested in more than half of the projections (Grabemann et al. 2015).
Ocean Dynamics and Hydrography .1 General Aspects and Methodology
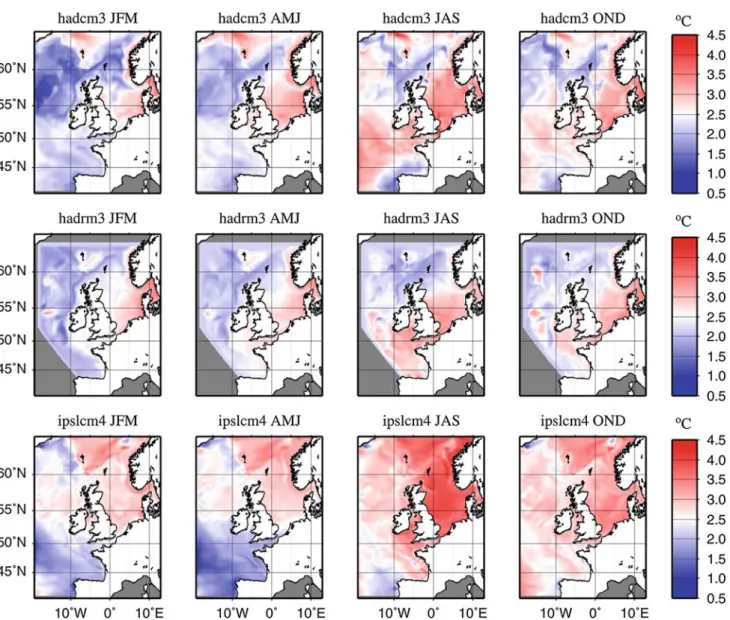
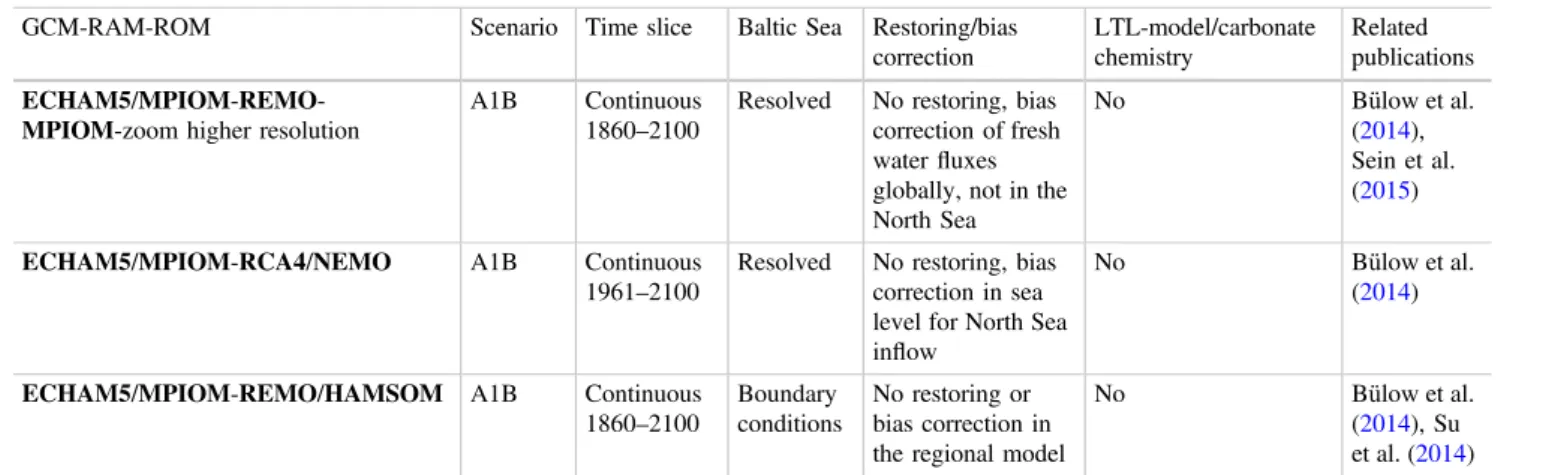
Pushpadas et al.2015) and ensemble downscaling from one GCM using different regional model systems are available for the North Sea (Bülow et al.2014). An ensemble of transient simulations 1960–2100 from all three models driven by the same GCM (ECHAM5-MPIOM) was performed for the SRES A1B scenario (Bülow et al. 2014). Exceptions are those simulated with the HAMSOM model (Mathis 2013), NORWECOM (Friocourt et al. 2012) and the coupled models (Bülow et al. 2014).
A small reduction in the intervals of the expected SST change was also evident (Pushpadas et al.2015). Pushpadas et al.2015), but the strength of the salinity decline appeared to be strongly dependent on the choice of GCM (Holt et al. Wakelin et al. This is confirmed by near-future projections: Friocourt et al. 2012) attributed to modeled near-future freshening of The North Sea partly due to decreasing winter inflow.
With a different setup (ECHAM3-RACOM-NORWECOM), Friocourt et al. 2012) simulated a decrease in inflow into the North Sea of about 5% for almost the entire seasonal cycle (exceptions in August and November) with the NORWECOM model.
Primary Production, Ocean Biogeochemistry, Ocean
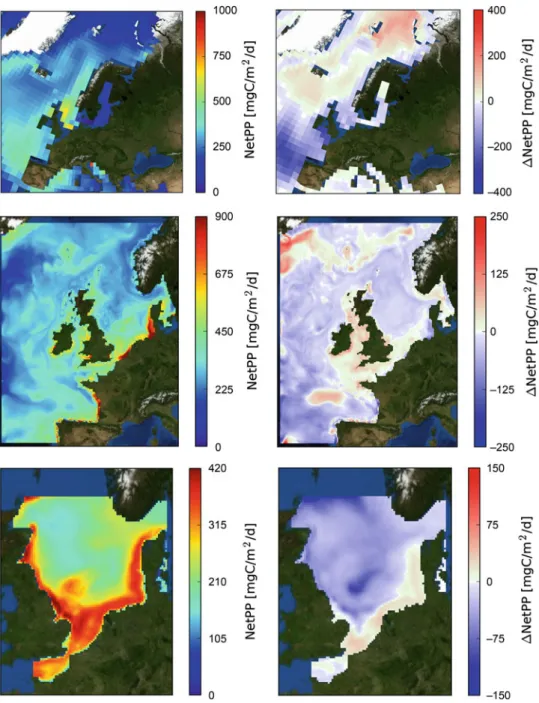
The projected decline in net PP before the end of the century was moderate for the ECOSMO (12%) and POLCOMS-ERSEM (2%) regional models, forced by the IPSL-CM4.0 ESM (Wakelin et al.). The North Sea is well mixed for almost half a year, and local stratification changes are less important and may be overshadowed by other processes (Holt et al. 2014). These regions appeared to be the most important for the nutrient supply to the entire North Sea system (Holt et al. 2012). ).
Lower, projected monthly change in netPP from the different scenarios (overlaid from Pushpadas et al.2015). considered possible by Gröger et al. Future changes in eutrophication in the North Sea as a result of climate change were investigated by means of scenario simulations with NORWECOM for the end of the century (Eilola et al. Using these indicators, Skogen et al. 2014) from one scenario to the concluded that the overall eutrophication status of the North Sea will remain unchanged under a future climate.
The POLCOMS-ERSEM results are consistent with ECOSMO model projections using the same ESM forcing (Wakelin et al.2012a).
Conclusions and Recommendations
Consideration of terrestrial impacts is critical for a shelf sea such as the North Sea and improved understanding of the coupled dynamics in the land-ocean transition zone is essential. Holt JT, James ID (2001) An S-coordinate density-evolving model of the Northwest European Continental Shelf. J Geophys Res Holt J, Wakelin S, Lowe J, Tinker J (2010) The potential impacts of climate change on the hydrography of the Northwest European Continental Shelf.
Pohlmann T (1996) Calculation of the annual cycle of vertical eddy viscosity in the North Sea with a three-dimensional baroclinic shelf sea circulation model. Rider KM, Konen GJ, Beersma J (1996) Simulation of the response of ocean waves in the North Atlantic and North Sea to a doubling of atmospheric CO2. Ryabchenko VA (2014) Eutrophication status of the North Sea, Skagerrak, Kattegat and Baltic Seas under current and future climates: a modeling study.
The combined effect of climate change and increased urbanization in some parts of the North Sea region could result in as much as a quadrupling of sewage overflow volumes.
Introduction
Early spring flooding is predicted for snow-dominated catchments, but this does not always cause an increase in peak flows; peak flows may decrease if higher spring temperatures lead to reduced snowpack. An increase in rain-fed runoff in winter and fall can change the seasonality of peak flows and floods. The proximity of a river basin to the ocean is also important; the closer the two, the greater the potential mitigation of any climate change effects.
In urban catchments, the specific characteristics of the drainage system will determine whether the net result of the impact of climate change, for example the expected increase in short-lived extreme precipitation, will dampen or amplify the impact of this change in precipitation. To assess the potential impact of climate change on river flow, climate change signals are used to change the input to hydrological models that aim to simulate the climate-driven response in the hydrological environment. River flow can be influenced by, among other things, changes in land use, groundwater extraction, hydraulic structures (such as reservoirs) along the river course and urbanization (see section 7.3.3); none are directly related to climate change.
Such characteristics mean that not all climate-driven hydrological impacts are readily detectable, so caution is needed when attributing hydrological changes to the 'impact of climate change'; see also chapter 5.
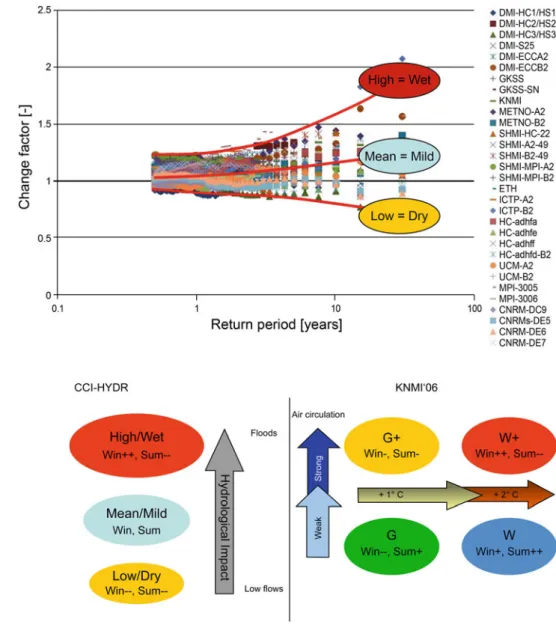
Methodology
Statistical uncertainty in estimates of large return periods (eg 100 years) can be substantial, however, especially when based on relatively short time series (typically 30 years for climate model outputs) (Brisson et al. 2015). Especially in the low and flat region of the North Sea, this will lead to higher sedimentation of sewage solids (Bates et al. 2008). Using such a model, Astaraie-Imani et al. 2012) studied the impact of climate change (and urbanization) on the receiving water quality of an urban river for dissolved oxygen and ammonium using a semi-real case study in the UK.
One way to understand changes is to evaluate longer hydrological and meteorological records with quite different changes in climate and land use (Refsgaard et al. 2014). For drought, Prudhomme et al. 2014) concluded that global hydrological models show greater uncertainty than global climate models. The uncertainty in future projections can thus be partially explained (Palmer and Räisänen 2002; Tebaldi et al. 2005; Collins 2007; Smith et al. 2009; Semenov and Stratonovitch 2010).
The use of ensemble-based probabilistic projections has been proposed, but would raise questions and problems for impact modellers (New et al.2007).
Projections .1 North Sea Region
Paying particular attention to hydrological droughts, Prudhomme et al. 2014) found a significant increase in drought frequency of more than 20% in Central and Western Europe. For 67 catchments in the Scheldt river basin in Flanders, Boukhris et al. 2008) found that extreme peak flows in rivers may increase or decrease depending on the climate scenario used. In the main river basins in France, Boé et al. 2009) found a decrease in average flow for summer and autumn.
Also for the Thames Basin, but based on more recent UKCP09 scenarios, Bell et al. Increased irrigation needs were also found for the south-east and north-west of England (Henriques et al. 2008). Smart combinations of scenarios take into account the correlation between boundary changes (Monbaliu et al. 2014; Weisse et al. 2014).
Scheldt estuary: boundary conditions are the downstream wave (North Sea) and the upstream river flows (several rivers) for which the correlation in the changes must be taken into account (Ntegeka et al.2012).
Conclusion
The impacts of climate change on the frequency and volumes of sewer overflows and floods vary widely. Arnell NW, Gosling SN (2016) The impacts of climate change on global river flood risk. Boukhris O, Willems P, Vanneuville W (2008) The impact of climate change on hydrology in highly urbanized Belgian areas.
Mark O, Svensson G, König A, Linde JJ (2008) Analyzes and adaptation of climate change impacts on urban drainage systems. Nie L, Lindholm O, Lindholm G, Syversen E (2009) Effects of climate change on urban drainage systems – a case study in Fredrikstad, Norway. Semenov MA, Stratonovitch P (2010) Use of multi-model ensembles from global climate models for assessing climate change impacts.
Willems P (2013a) Revision of design rules for urban drainage after assessing the impacts of climate change on extreme precipitation in Uccle, Belgium.
Impacts of Recent and Future Climate