One reason cited is the South African government's negative association with the brand. What is the degree of influence of various factors that contribute to male condom brand positioning among students. The brand repositioning strategy formulated by the study is designed based on data analysis.
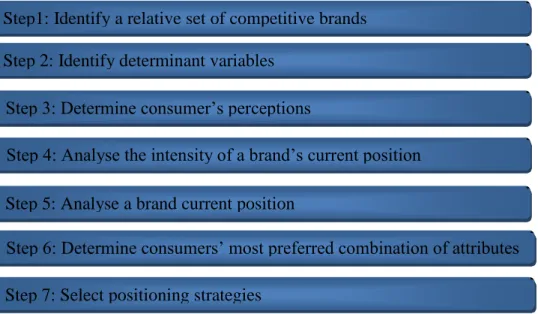
The chapter begins by stating the research objectives and the nature of the study. Identifying the factors influencing the positioning of the male condom brands among UKZN students. The content validity is ―the extent to which measurement scales provide adequate coverage of the investigative questions‖.
It was represented in the vertical axis of the orthogonal reference of the perceptual map.

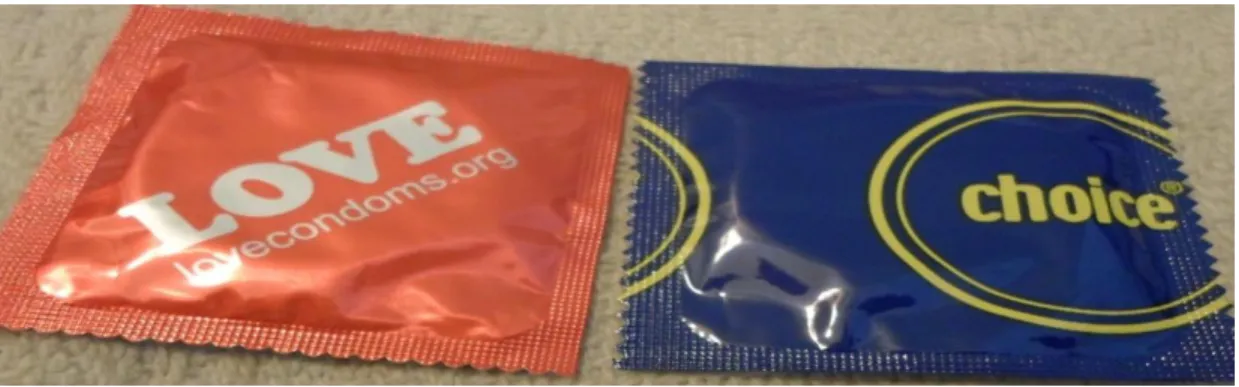
Are you able to recognise your favourite brand out of its package?
After naming his favorite condom brand, the respondent was asked whether he would be able to recognize this favorite brand among the other competing brands when they were all out of the package. The figure below shows the percentages of students who could recognize their favorite brand (yes) and those who could not. Normally people should be able to easily identify their favorite brand, but when it comes to condom brands, that doesn't seem easy as 38% of the sample cannot recognize their favorite brand from the package.
Regarding such results, Chapter 6 will discuss the improvement of the concept of brand recognition. After assessing brand recognition, students were given the opportunity to indicate which factors would help them recognize their favorite brands. The question received 90 missing values due to the fact that many students (38%) were unable to recognize their favorite brand; however, the question was useful in assessing which factors dominate the visual brand identity when the condoms are out of their packages.
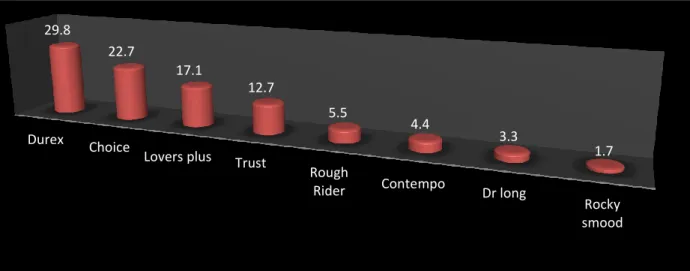
During the survey, students mentioned eight factors that help them recognize their favorite brands. In first position is the Smell factor, more than 29% of students said they would recognize their favorite brand if the package was removed. It is quite interesting to discover that scent can be part of brand identity; this shows how important taste and smell can be.
Distribution of the factors of recognition among students
Second favourite brands
We also noted that government brands improved their scores compared to the first-place favorite; the Choice brand moved from 3.8% to 14.4% as the second favorite brand. Respondents were asked about the brand they use the most; figure 22 shows the percentages for the nine brands most used by UKZN students. It has been noted that the eight preferred big brands are quite similar to the nine most used big brands with the only difference being that Dr long is missing from this list; the study will also check if there is a relationship between the preferred brand and the most used brand.
The Choice brand is used by only 9% of UKZN students; this is quite low given the high availability of Choice on campus. Although this figure gives an idea of the most used brands, it does not tell about the motivations for the choices of brand use. Out of the 42.9% of students who listed Durex as their favorite brand, only 35.2% can afford it.
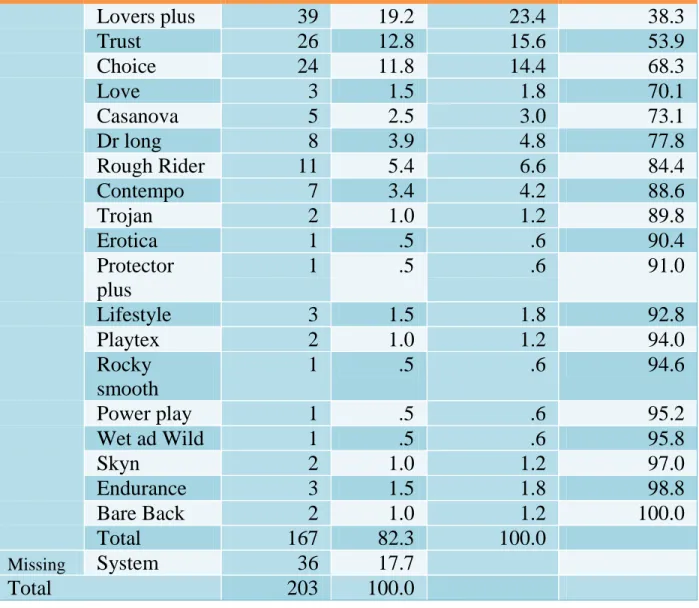
The big nine male condom brands most used by UKZN students
Nearly 10% of students consider the Trust brand their favorite brand, but over 14.8% use it as their main brand. Rough Rider was voted 7.7% favorite brand, but only 4.9% of UKZN students can afford to use it as their main brand. The government brand Choice was the favorite brand of almost 3.8%, but more than 9.3% of students actually use it; meaning 5.5% cannot afford to use their favorite commercial brand.
However, this brand positioning study will be based on experience with brands; the researcher will hypothesize that condom performance is part of the factors that may contribute to considering a brand as preferred or most used. Respondents were only allowed to answer this question after revealing the brand they use the most. According to table 14, the value range is 9/10; The average frequency of use of all the most used brands is 7/10, but about 22% of the sample said that they use their brand the most, they use 8 over 10 times, this value received the highest frequency (mode).
Looking at all these indicators, it can be concluded that UKZN students have a good level of brand loyalty in terms of the brand they use the most, as 7 times over 10 they use the same brand and only 3 times over 10 try other brands . This is a good thing because more than ¾ of the sample is aware of what they are talking about. Furthermore, the fact that 75% of students have tried the brand, but only 3.8% said it is their favorite brand, speaks volumes about the brand's poor performance among UKZN students.
From the top of mind evaluation, we noticed that the brand Love was missing; which means that Love is not yet well established in the mind of the consumer.
Have you ever use the brand Choice?
The figure below shows the number of people in the sample who used Choice; in other words, determining the number of students qualified to objectively assess Choice's performance. The male condom brand Love is the second government brand to be distributed on campus in the past four years. Among favorite brands, 0.5% of students voted for Love first and 1.5% voted second.
Love is not listed among the most commonly used brands. The researcher believes that this may be due to the fact that the Love brand is not well known among students. The red part of Figure 24 indicates the part of the sample that the Love brand has never tried; it has been experienced by some students (28%). Research needs to be done to find out why the Love brand is not known despite being on the market for over three years.
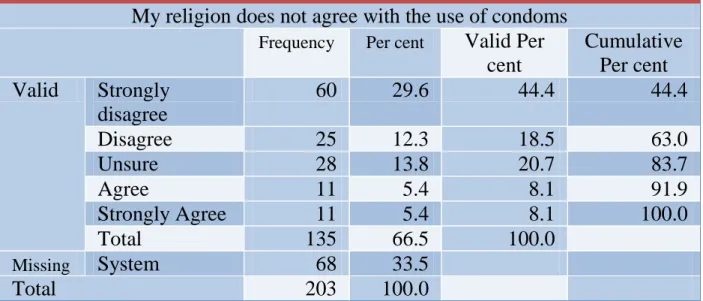
The students were invited to express their opinion about the statement: Love brand of condoms compared to Choice is of higher quality. This question was used to determine whether students perceive the government brand Love as an improved version of the Choice brand. Unfortunately, the researcher failed to introduce a screen question to select only respondents who had tried both brands.
This may be the reason that so many uncertain answers are found in the table below.
Have you ever used the brand Love?
To describe and analyse the current positioning of male condom brands among UKZN students
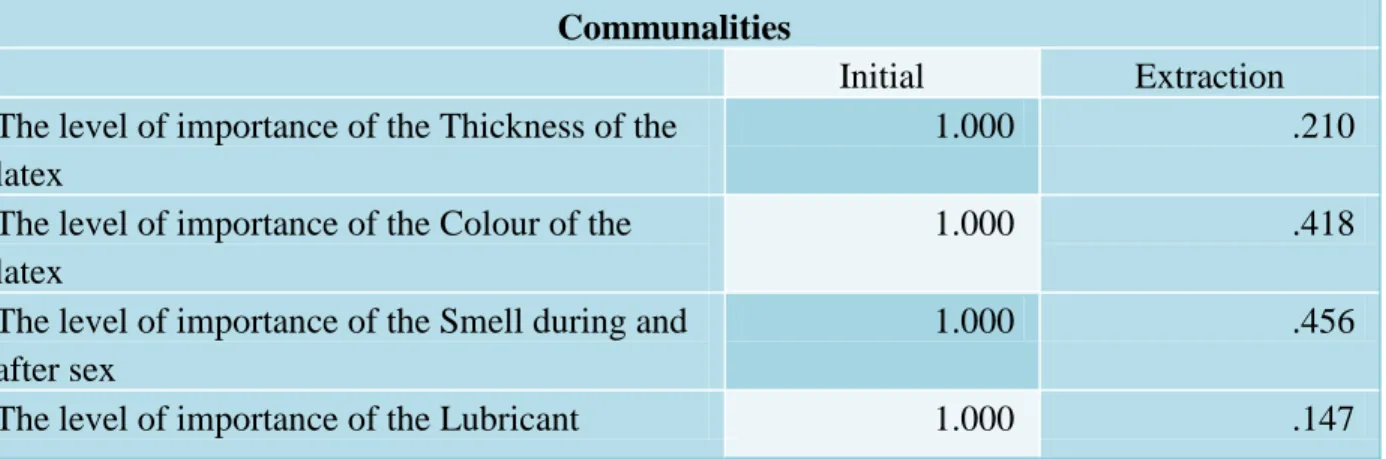
Referring to the methodology standards, three aspects need to be examined, namely: the sample size, the SME measure and the significance level of the Bartlett's test of sphericity (Pallant, 2010). According to the model (Factor Analysis), the KMO must be greater than .6 and the significance of the Bartlett's test must be lower than .05. 647 The importance of taste/smell. 595 The importance of the resistance of the.
Table 34 shows that the items smell during and after sex, scent/scent, name of the brand and design of the package are more correlated with component 1. 609 The level of importance of the Scent/scent .707 The level of importance of the Resistance of the. The table below presents the coordinates of the main competing brands (those used by at least 4 students in the sample); the brands are positioned according to our two main components which are Reliability and Cool and flavored.
Durex is also perceived as one of the most reliable brands and its slogan is "love sex"; The researcher wonders how such a tagline can be associated with brand reliability. If this perception has no connection with the tagline, then what explains the brand's association with reliability. On the map, the median shows that the distance between a brand's center and its coordinate on the Cool and Flavored axis is shorter than the distances between the brand's center and its coordinate on the Reliability axis.
Briefly, the perceptual map above provided the relative positions of competing condom brands among UKZN students.
The financial and legislative power: although the study found that the association with the South African government negatively affects the Choice brand, the financial capacity of the government is still strong. The researcher will begin by examining the major weaknesses of the state brands that students pointed out in relation to the brand choice. The level of influence of the factor "Experience with the brand" on the perception of a condom brand.
This chapter continues from the previous one with a discussion of the findings of the study. The impetus for the study stems from the fact that the studied population is located in the most contaminated and affected area in South Africa. Although this indicator does not always reflect the level of condom use consistency, it nevertheless indicates that condom use is a normal part of student sexuality.
Two main factors were identified as responsible: the brand's association with the government's reputation and the gap between the student's expectations and the benefits of using the brand. The biggest problems with the Choice brand were its smell, its lubrication and its reliability. The concept focuses only on visual elements and it does not integrate intangible elements such as smell as part of the brand's identity.
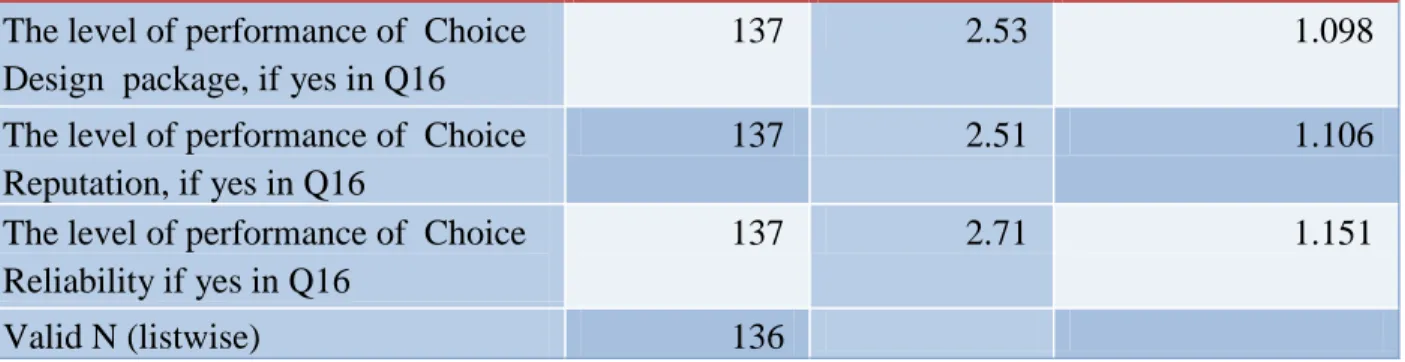
The same association exists between the most used brand and the race of the user. If you said "yes" in Q16 and you did not mention ―Choice‖ in Q.9; please evaluate the following criteria of the brand ―Choice‖. If you said "yes" in Q17 and you did not mention ―Love‖ in Q.9; please evaluate the below criteria of the brand ―Love”.