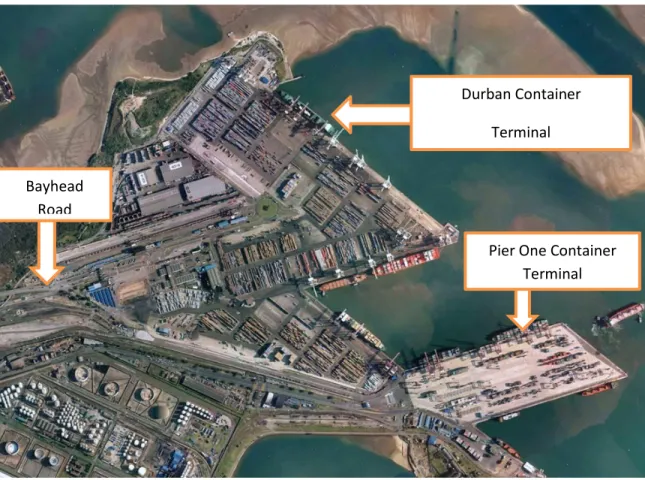
The general question studied in this research is: How can maritime services within the Port of Durban help reduce vessel turnaround times. However, there are still concerns about the operational efficiency of the port's terminals (Pier One and Durban Container Terminal). This study has clearly shown that maritime activities in the Port of Durban do not have a significant impact on the overall vessel turnaround time.
However, there are areas of improvement that can be implemented to ensure high levels of service within the port.
BACKGROUND AND RATIONALE
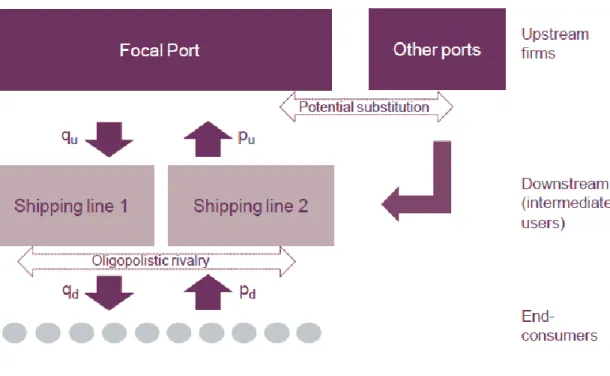
Some of the areas that container carriers have had to focus on in order to remain competitive and profitable are shown in Figure 1.1. In addition, some operational arrangements such as conference agreements had to be redefined. The real costs of trade – the transportation and other costs of international business – are important factors that determine a country's ability to participate fully in the global economy (Limao and Venables, 2001).
For the purpose of the research, the focus on ship turnaround (for container ships) will be mainly on the maritime service delivery component.
LIMITATIONS AND OVERVIEW OF THE STUDY
How Marine Services at the Port of Durban can help reduce ship handling times. A VTS service is provided by the Port of Durban to monitor shipping and assist in the management of traffic within the port itself and within designated port boundaries, including the port approaches and the roadway/anchorage. Chapter two will focus on what is meant by ship handling time and how marine services in the Port of Durban are part of this process.
Chapter five will conclude the research and the overall impact of marine operations within the port of Durban.
INTRODUCTION
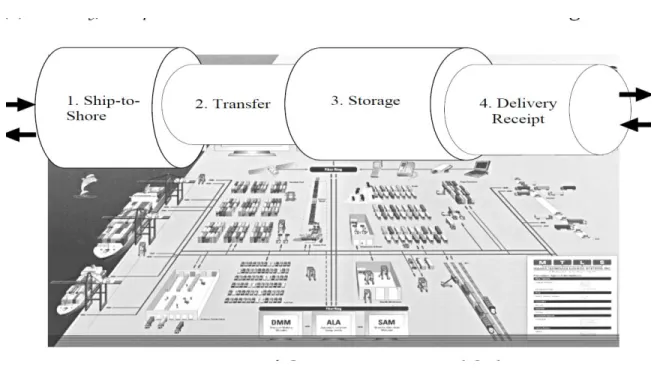
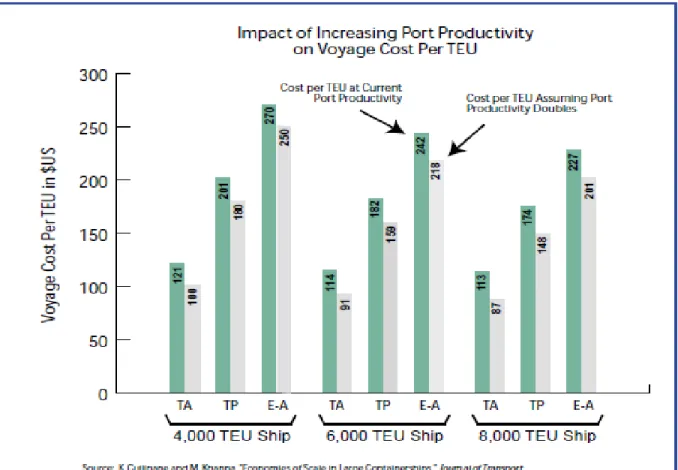
The ship must notify the port and the terminal of its arrival/departure. Normally the ship will wait at anchor when it arrives in port and then the order is given to weigh anchor and for the pilot and marine services to lay the ship down. Cullinane and Khanna, (1999) show that a cargo handling rate double that of the current rate will significantly reduce the unit cost, as the ship will be able to carry more containers in a given period.
This means that the ship spends more time at sea and earns money than next to a quay.
NOTICE OF ARRIVAL AT A PORT
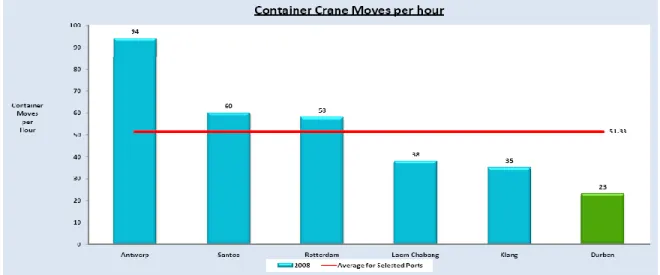
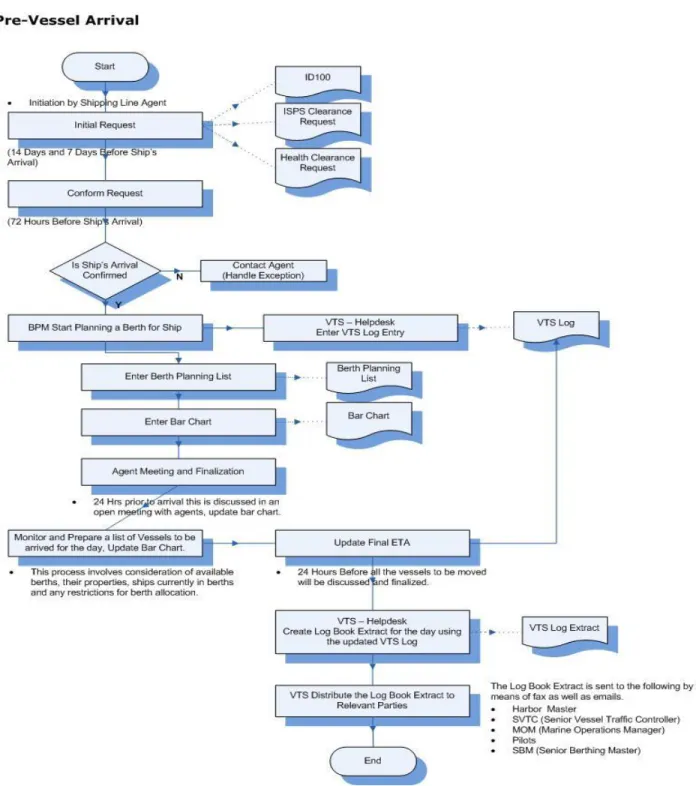
13 By increasing the handling capacity and efficiency of a terminal (see figure 2.3), the overall net effect is a reduction in the cost of travel per TEU. 15 From the pre-arrival processes (see figure 2.4) an Estimated Time of Arrival (ETA) of 14 days / 7 days is also given to allow sufficient planning and preparation of the vessel's arrival. The very beginning of the process begins at the moment when the transport agent sends a request for the allocation of a bed on a certain date.
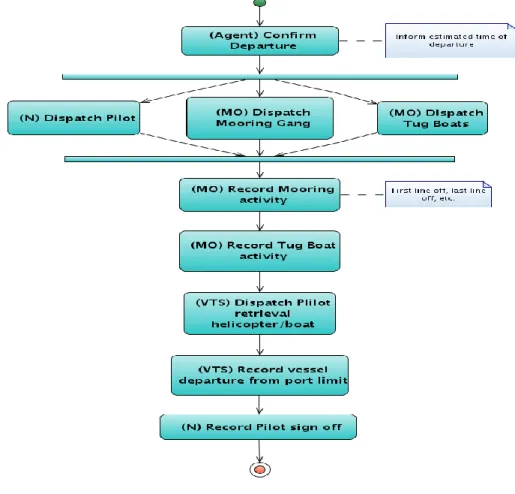
Updates are sent by shipping agents to the port in a sequence of 14 days, 7 days and to be confirmed 72 hours before the vessel's arrival. The vessel will make a request for service and the VTS center will allocate the necessary resources to ensure the safe docking of the vessel. The departure process (see figure 2.6) is almost the same as arrival, except that the terminal operator provides the departure information four hours before sailing and must confirm within two hours of the request for marine services (see Port Rules Part D Section 31 - Appendix 2).
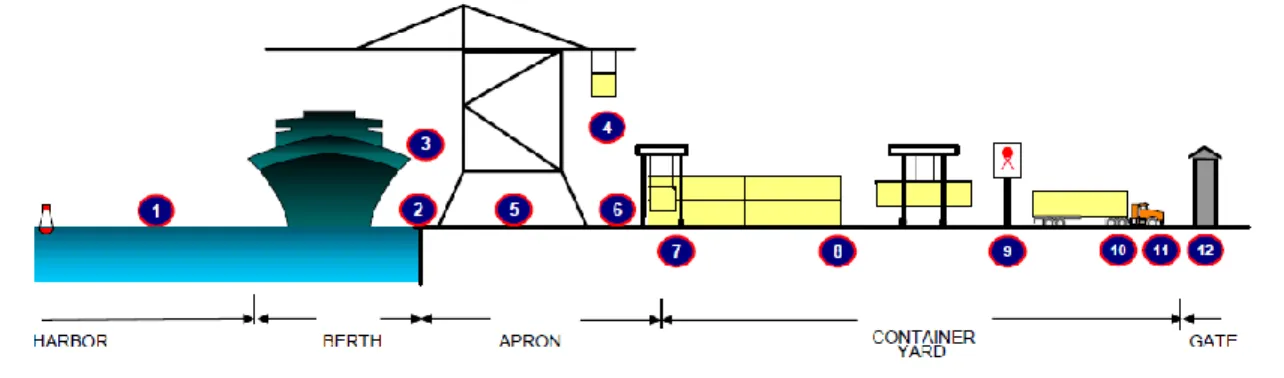
Port container terminals are an important part of logistics systems in international trade (Wong and Kozan, 2010). 20 However, this performance measure is often not a fair reflection of the performance of ports and some of the challenges they face. Terminal design (see Figure 2.9) and equipment, along with the level of training of terminal management and labor, can determine terminal efficiency.
The cargo handling efficiency of the terminal has an impact on the overall ship turnaround time as well as the cost of handling the cargo. Ship owners are constantly trying to achieve greater economies of scale, which minimize idle time and delays for a ship that affect the revenue earning capacity of the ship.
INTRODUCTION
RESEARCH APPROACH
In order to understand the nature of the complex interactions between the port and its various stakeholders, the appropriate methodology used provides a means of problem solving (Levy, 2000). However, using a critical systems approach means understanding the nature of the problem and then looking at all the factors that influence the problem in order to allow an appropriate solution (or solutions) to emerge as the analysis unfolds . On the face of it, it would appear that a hard systems approach would be more appropriate due to the process flows involved.
However, the soft systems methodology would prove to be the more dominant method to use, with the hard systems approach being subordinate. They are better suited to solving engineering problems, while a soft systems approach will address an operational problem that is considered "messy". 26 and provides general guidance for situations where one or the other approach is likely to be more appropriate to use.
A soft systems methodology has emerged as a much more appropriate approach to use due to the limitations of a hard systems approach in contexts involving several interactions. As there are several stakeholders involved who have their own views and perspectives on the problem of high vessel turnaround times in the Port of Durban, a soft systems approach is. The emergence of a possible solution from data analysis is a cornerstone of a soft systems approach (Checkland, 1985).
This study has chosen to use the brain metaphor in this scenario because of the role that the VTS center plays in managing the coordination of traffic flow within the port. The systems methodology used will be Checkland's SSM (Soft Systems Methodology) approach (Checkland, 1987) due to the wide range of stakeholders involved and their specific interests in relation to ship turnaround.
RESEARCH METHODOLOGY
27 adopted in this study, as it takes into account all the human factors involved in complex problem-solving situations. This chapter has briefly presented the basic conceptual and theoretical framework for this study. In chapter four, the study will focus on data analysis using this framework - Checkland's seven-stage model - to understand the complexities of ship turning in the Port of Durban.
INTRODUCTION
THE STAGES OF THE CONVENTIONAL SEVEN-STAGE MODEL OF SSM .1 STAGE 1
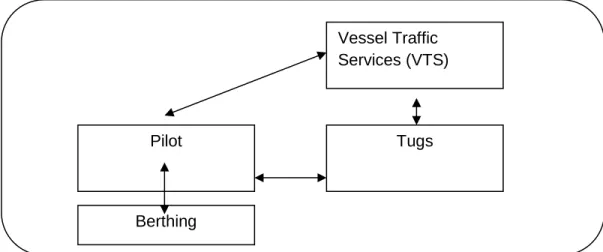
Using the research question as a guide: "How can Maritime Services within the Port of Durban assist in reducing vessel turnaround times?", it will be assumed that the main reason for vessel delays or higher turnaround times is that there is a inefficient maritime service delivery at the Port of Durban. Marine services within the port consist of pilotage, towing and mooring services. To understand the extent of the problem with the very high vessel turnaround times experienced at the Port of Durban, it would be important to assess the vessel arrival/departure to and from the port and try to understand the vessel flow/process .
It should be noted that not all ships arriving at the port limits of the Port of Durban and anchoring at the anchorage enter the port. This research also focuses only on the container ships that enter the port of Durban. 32 Table 2: Analysis of arrival/departure statistics from July-September 2010 for container ships to the Port of Durban (figures expressed in hours).
For the period under review from table 2 - July-September 2010 - there were 322 container ships that arrived at the Port of Durban. The time spent at the port is reflected in hours and it can be clearly established that the ships arriving at the port spend, on average, most of their time at anchor for the period. 34 For the period under review from table 3 - July-September 2011 - there were 234 container ships that arrived at the Durban port.
Analysis of the period 2010-2011 reveals a worrying trend that average waiting times for ships at anchor have increased significantly and time at berth has also increased significantly, despite a decrease in the number of ships calling at the port. This is partly due to the fact that much larger ships are now arriving at the port (see Figure 4.3) and, importantly, with a greater number of containers per port visit.
DELAYS 2010
STAGE 6 AND 7
It is clear from the analysis carried out that the overall delays caused by maritime operations are quite insignificant in relation to the total vessel turnaround time in the Port of Durban. However, there is room for improvement in improving services and minimizing ship time in port. The port must ensure sufficient staff to operate the tugboats, as well as adequate training programs to improve operator efficiency, for example in the area of tugboats.
Therefore, the port must be relevant in providing a range of service offerings on par with the users' expectations and requirements. The purpose of this study was to determine the impact of marine services on overall ship turnaround time and whether it contributed to delays for ships to the Durban port. This study has clearly shown that the marine operations within the port of Durban do not have a significant impact on the overall ship turnaround time.
Using Checkland's soft systems methodology, the study was able to establish that marine services at the Port of Durban were only part of a series of processes in total ship turnaround with little impact on turnaround time. 47 However, there are areas of improvement that can be implemented to ensure a high level of service in the port. Source: Lawrence et al (2012) – Reducing Supply Chain Barriers, World Economic Forum. The Global Enabling Trade Report.
This shows the mix of ships arriving at the Port of Durban over the past five years. Despite a decline in the number of ships in 2010 and 2011, the data clearly shows an increase in the average gross tonnage [see annex six] of ships arriving at the port and containers handled. The average gross tonnage of ships arriving at the Port of Durban has increased steadily over the past five years.
On July 5, 2012, the MSC SOLA docked in the port of Durban with a capacity of 11,660 teus (fully loaded).