For this purpose, the automobile industry is studied from the perspective of its export-oriented growth since the beginning of the automobile terminal. This was done in order to examine the role of the automotive terminal in the logistics value chains of the KZN automotive industry.
List of Acronyms
Chapter One
Introduction
The infrastructure of the port's management - and consequently also the terminal's management - underwent some substantial changes. The terminal is also considered the main channel of exports, and is therefore closely linked to export-oriented growth plans of the South African automotive industry.
Chapter Two
The port of Durban
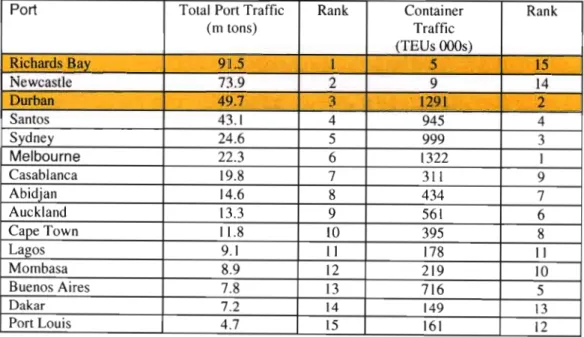
However, the trend is summed up by the increase in mega-ship tonnage, which now stands at 18.7% of world container traffic (measured in TEU or twenty-foot equivalent containers) TEU. Both terminals face constraints due to the proximity of the port's positioning in relation to the city's central business district; this proximity is easily discerned when examining the harbor scheme on page 14.
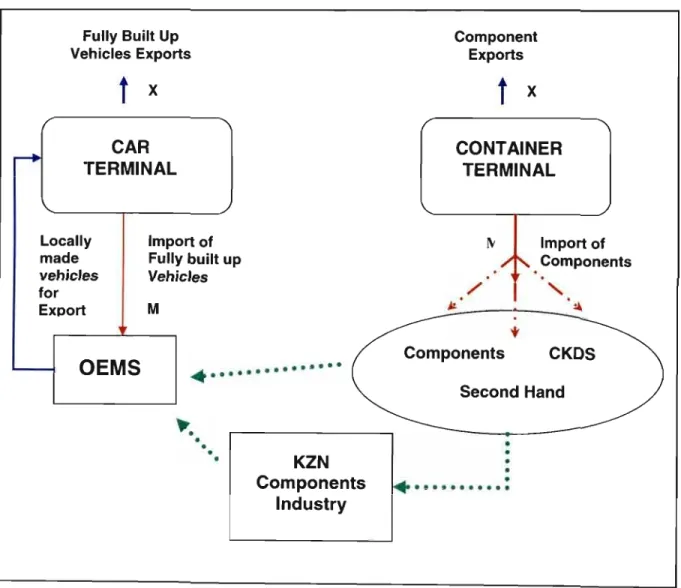
OEMS
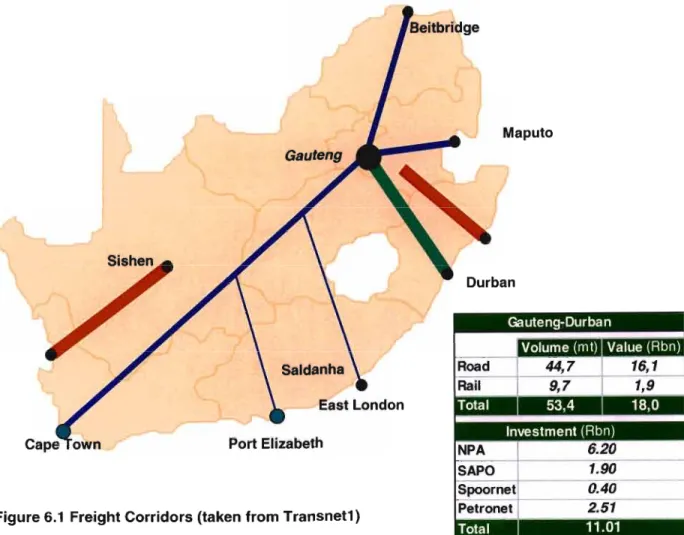
The fully built cars are then exported through the car terminal (indicated by the blue line connecting the OEMs to the car terminal). Fully manufactured vehicles are also imported through the automotive terminal, which is indicated by a red import line from the automotive terminal to the OEM box.
Historical overview of South Africa's manufacturing sector
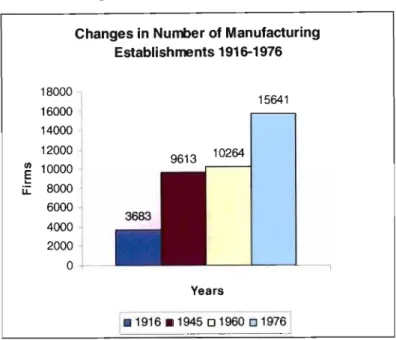
This added to the political tensions of the day, tensions that eventually resulted in the Anglo-Boer War (Houghton: 1971). As Natrass shows in Table 8.3 (reproduced in part below as Chart 3.1) the increase in the number of manufacturing establishments is substantial between 1916 and 1945, slowing in growth until 1960 and then resuming a faster rate of growth until in 1976.
Literature Review
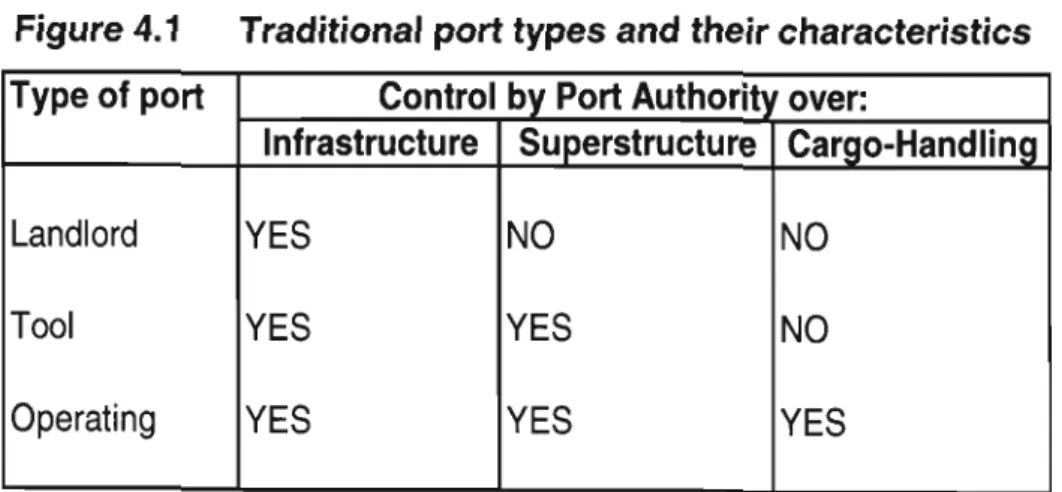
The first area of discussion of this thesis focuses on the provision of infrastructure and management of the car terminal in the port of Durban. Lessor ports have the most limited form of public sector involvement of the three. In the words of Brooks, the outcome (of port privatization in the UK) fell short of the efficient market ideal.
South African port governance has recently undergone legislative changes in the form of the National Ports Authority Bill in 2003 which was particularly. They present a case study of the integration of the Port Authority of the Port of Le Havre into the supply chain of the automaker Renault. The study examines the port's cargo handling and transportation systems and compares their efficiency with that of the manufacturer.
However, one area that has not received much attention is the final link in the value-added logistics chain between the production and assembly side of the local industry and the transport hub, the Durban Port car terminal. Port users and service providers concerned about the future efficiency of the Port of Durban believe that delaying crucial decision-making (on granting concessions to port operations) is counterproductive (Jones: 2003).
Research Methodology
Port Planning
The decision-making process around the construction of the car terminal at the Port of Durban took place at the same time as national debates on the provision of infrastructure. In the midst of negotiations for the development of the car terminal, national structures were changing. The transfer of Portnet - the maritime arm of Transnet - to NPA and SAPO has played a major role in the planning of the car terminal at the Port of Durban (Interview: 4).
Although Naamsa and NPA reached an amicable agreement, the City of Durban felt that the construction of the new terminal would be problematic according to the Ethekwini Municipality Economic Development Department (Interview 2). Spoornet and NPA are currently negotiating the redevelopment of the current rail infrastructure of the car terminal (Spoornet1: Interview 10) and NPA is to this end. The expansion of the current Toyota platform, discussed in Chapter 8, is contributing to the current terminal capacity crisis.
Vehicle dispatch logistics extends beyond the car terminal parking lot into the wider logistics network of the automotive industry. The level of interaction between the role players in the design of the terminal definitely affected the operation of the terminal.
Model Efficiency?
The logistics chain of the local automotive industry has been subjected to a large number of benchmarking efforts (Barnes. No local study has been designed to measure the role of the car terminal in the logistics chain of OEMs, it is taken for granted that it generates. This is contrary to international practice that sees the port as an integral link in the logistics chain of the car industry (Carbone & De Martino: 2003).
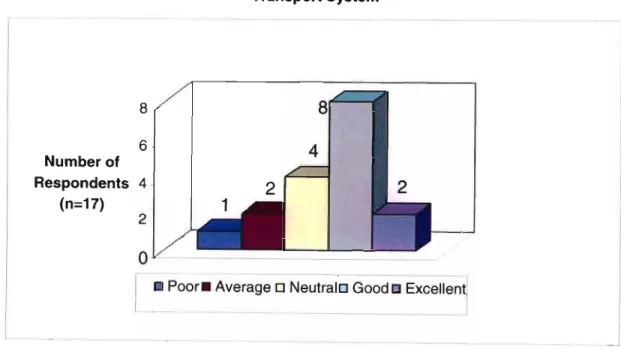
The car terminal is a member of the KwaZulu-Natal and national car industries' logistics chain, and as such is highly embedded in the. Interviewees were asked: how well do you feel the terminal compares with other components of the transport system (Le. road/rail) if 1 is poor and 5 is. Creating an efficiency model for the car terminal is critical for strategic planning for both the terminal and terminal users, as it will enable the identification of 'weak spots' before they become an economic liability for the functioning of the terminal.
As illustrated, the model' examines five specific factors that affect port efficiency: transport links (road and rail); ship turnaround; unloading and reloading); marine services; berth occupancy rate; logistics and land-based facilities. The identified factors became the basis of the model described later in this chapter.
EFFICIENCY ~
The car terminal management is currently not unduly concerned that delays in maritime services will affect the availability of open berths, as occupancy throughout the terminal is recorded at 40% (Interview: 5). Similarly, such delays will have an impact on the ability of the terminal to meet the country's logistics requirements of the shippers (Interview: 13). It refers to the links between the terminal and other modes of transport used to transport vehicles to and from the terminal.
The current routes taken by car ferries include an extended loop around the terminal to access the parking area. Transporting the vehicles on the public road network increases the congestion in the already densely occupied commercial and residential area around the terminal. If a ship is loaded with 1500 vehicles, 150 to 300 transport ship trips are required, depending on the size of the transport ship used, this is an unwieldy and lengthy exit from the terminal (interview 18).
The expected expansion of the terminal by 2007 is likely to include some sort of logistics activity area (LAP) - according to. I believe the answer is yes, as only land logistics and ship turnaround time are factors that are entirely in the hands of the terminal.
Has the Car Terminal Bolstered Growth in KZN Auto Industry?
TSAM began as a mass importer of low-cost utility vehicles (bakkies) for the local market in the 1960s. Like other GEMs based elsewhere in the country, TSAM was largely re-integrated into its global business, Toyota Motor Corporation (Singh: . 2004). TSAM's limited participation in the planning stages of the car terminal, they decided to be represented by Naamsa, although other GEM leaders participated in the negotiations themselves (Interview: 3).
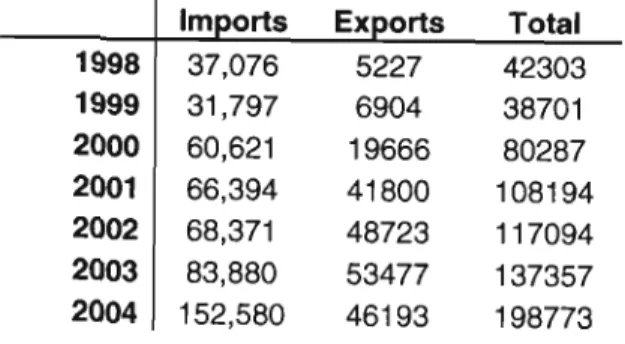
In the case study Renault - Le Havre (Carbone and de Martino: 2003) this is the port and not the. There has indeed been a limited impact on the automotive industry; no additional growth in TSAM exports has led to little growth in the automotive industry. Despite this, the KZN components industry has been remarkably stable and has experienced good growth over the past five years.
To answer the question in the title of this chapter, has the car terminal spurred growth in the KZN car industry? the short answer is no. These define the direction of future industrial development.” (emphasis in original, cited in Robbins; . 2004:8).
Conclusions
To improve access to trade, the government adopted a typical neo-structuralist focus (Martinussen: 1997) on public spending to increase it. The first of the areas examined was the provision of infrastructure for the car terminal, this was unpacked in Chapter 6, followed by a detailed analysis of terminal management and efficiency generation in Chapter 7 and finally. Despite the facilities available in the terminal, Toyota has so far failed to take advantage due to their own internal limitations (interview 7) and lack of adoption of the MIDP (interview: 3).
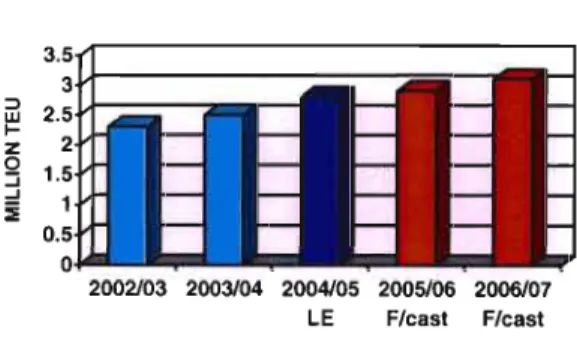
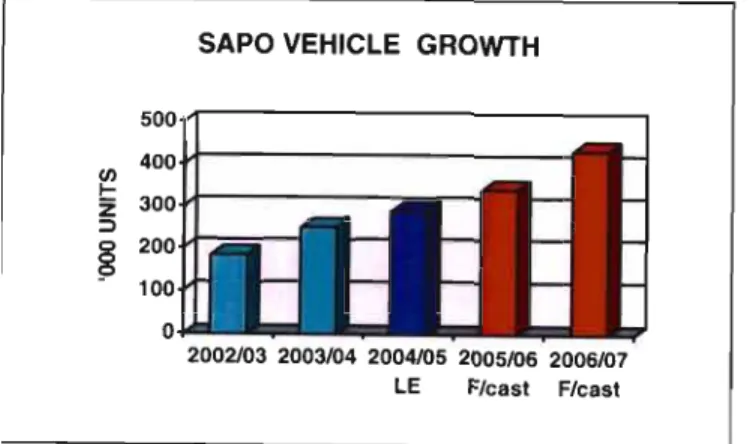
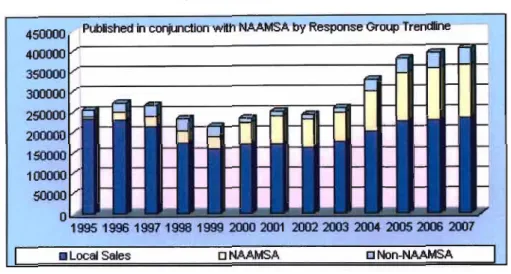
While export-oriented production increased with the advent of the MIDP (Barnes and Black: 2003), the actual vehicle trade saw significant changes in volume only when the terminal facilities were expanded and able to handle increased traffic, as discussed in Chapter 6 .However, the success of the terminal is undeniable (as can be seen from the various graphs in Chapter 8) as. A focus on the terminal's ability to operate in such a way that efficiencies are captured in the logistics chain (Robinson: 2002) and fed into national production structures (L6pez and Poole: 1998).
Until 2007, TSAM will produce only two models, the Hi-Lux and the Corolla, both produced under MIDP policy guidelines and intended for mass export. In a case study of the KZN automotive industry this happened, TSAM was unable to use the government's incentive to its advantage and.
Manufacturing in South Africa over the past decade: a review of industrial performance and policy. 2000) Globalization and the South: Some Critical Issues. 1983a) Industrial Development Before the Second World War in Coleman (ed) Economic History of South Africa. 1983b) The Development of Secondary Industry: The Second World War and After in Coleman (ed) Economic History of South Africa.
Sustainable port city development strategies in a globalizing economy: some insights from Durban, South Africa. Learning from the competitive and macro environment and the latest thinking in global management science to incorporate into a new business model for Toyota South Africa Motors.