By identifying income from poverty by defining an appropriate poverty line (Sen expresses the numerical weight of poor persons Q in the total population N. It does not allow changes in the intensity of poverty and thus remains unchanged even when it is in income received by the poor and given to the non-poor, it does not indicate the spread of poverty in the population, but always increases after a transfer of income from the poor to the non-poor.
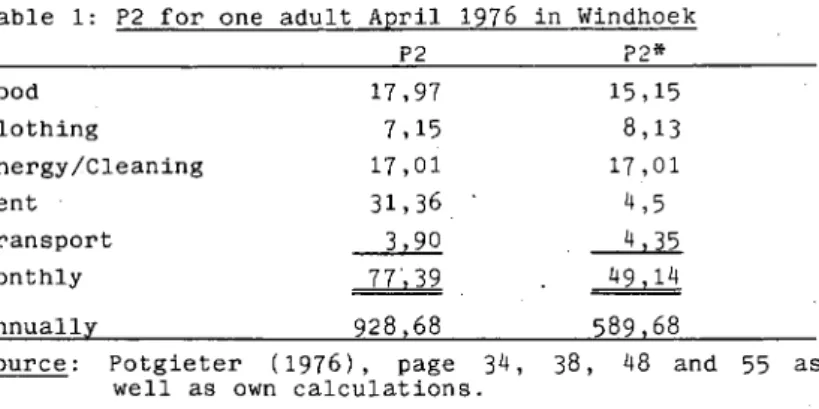
To compare prosperity in the 1970s, P2 will be slightly too low for whites and much too high for blacks. Clearly, the number of people assessed as poor will respond sensitively to changes in the above assumptions. Since the PHSL in 1976 was about 20 percent higher in Windhoek than in Cape Town, it is likely that transport and distribution costs raise the level of imported goods even higher in the northern areas.
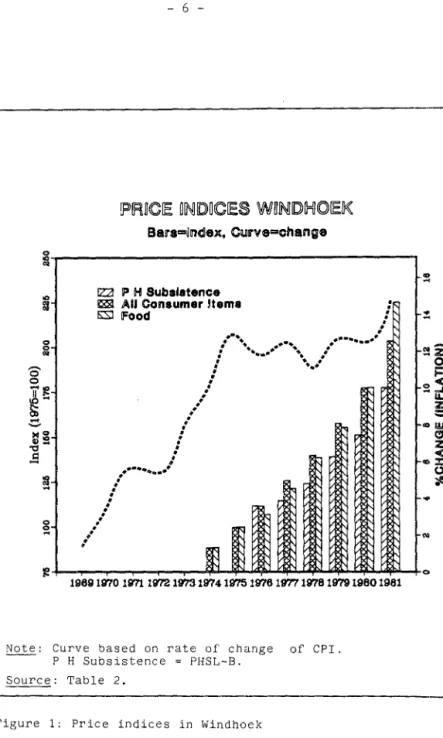
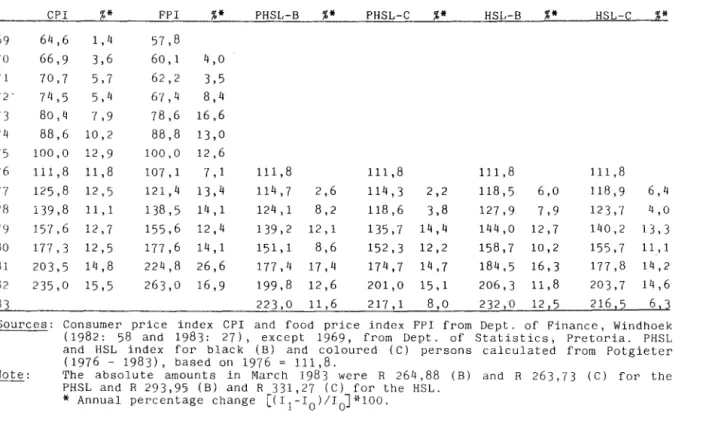
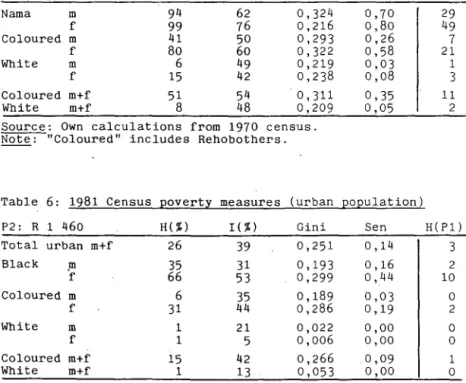
This paper assumes that the poverty lines for Windhoek are more or less appropriate for other parts of the country as well. Since food will play an important role in the consumption of poor people, one should expect the FPI to reflect basic cost development more closely than the CPI. For measures from the 1981 census, a new calculation of P2 is made based on the Planning Institute's report for that year, which appears to be virtually identical to the index-adjusted poverty line (R 1 462 versus H1477) ).
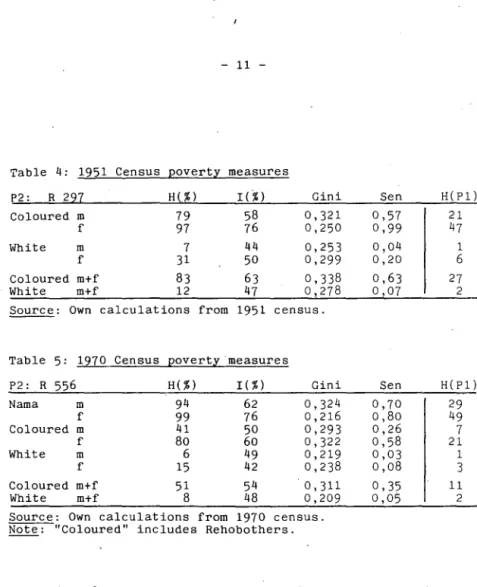
Note that the Gini estimation errors are likely to be quite large, as they are based on only three intervals (von Kleist. All four measures of poverty under P2 are presented in Table 4, while for Pl only H, the percentage of poor people in the group, is reported at the bottom of the table. In the seventies there was an increase in interest in black wages (eg Murray, 1974; Gordon, 1977), but since they were comprehensive data.
The first useful official survey of limited scope was carried out by the Department of Statistics in the "white". Fortunately, the author was able to persuade the Department of Statistics in Windhoek to make available a sample of the census. The accuracy of the estimates in Table 6 will tend to be very high as the measures were calculated from micro data (after a few miscoded cases had been corrected).
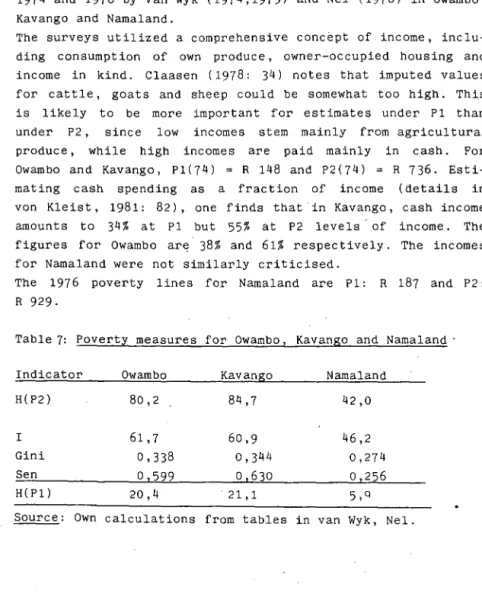
Another point worth noting is that the Owambo and Kavango surveys include an imputed monthly rent of R2 in income, which is quite similar to housing costs at P2*, while the imputed rent in the Nama survey is much higher. similar to housing costs. in P2. From P2*(74) R 467 it follows that the percentage of poor persons was 8S% for Owambo, 86% for Kavango in the traditional rural sector (ie agriculture, hunting and fishing) compared to 94% and 9S% under P2 , e which is important for income comparisons. Consequently, the H percentages are calculated only for the distribution of income from agriculture and hunting and are thus higher than those in the table.
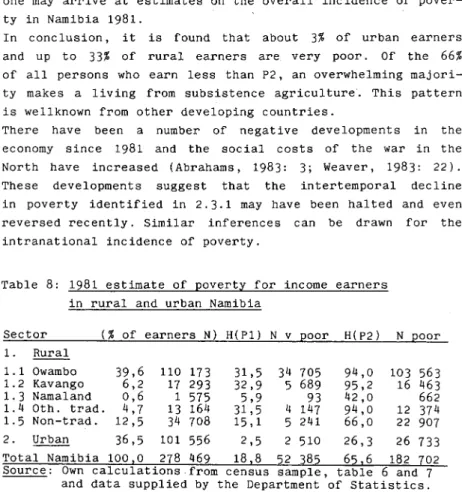
Based on these assumptions and on additional data from the Department of Statistics, Windhoek, on the total population and economically active persons in the categories in Table 8, estimates can be arrived at of the total incidence of poverty in Namibia in 1981.
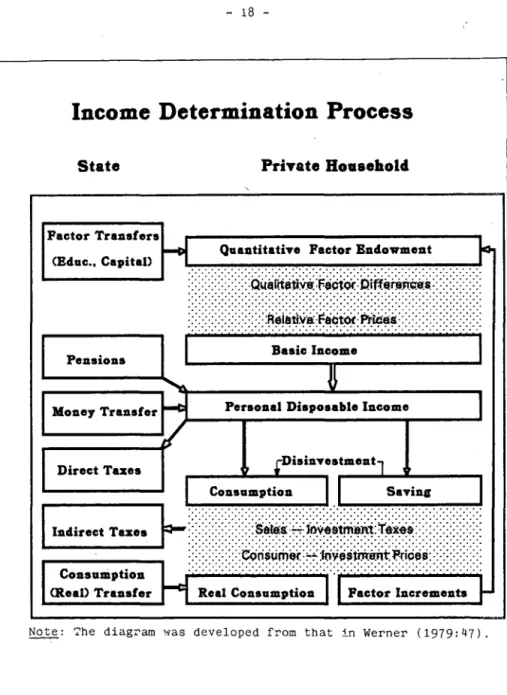
Income Determination Process
State
Private Household
In ·the White farming area, confiscatory policies would preclude securing and expanding employment for the poor. There is clear evidence from chapter 2 that the great burden of poverty in Namibia fell on the black and the female sectors of the population, a result known from other countries. This paper is of the opinion that monocausal explanations of personal poverty are clearly insufficient, but that a precise quantification of the importance of various variables is not possible at the current state of knowledge.
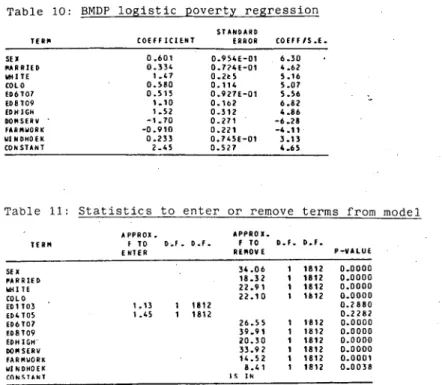
Instead, the next section estimates a model of different probabilities of poverty, controlling for the effect of education, and thus puts into perspective the size of the effects that an expansion of the current education system might have. The model also sets upper bounds on the importance of racial and sexual discrimination as determinants of poverty within the given framework of the Namibian economy. The probability of being poor is limited here to the probability of having income below P2 and the choice of explanatory variables is limited by the information collected in the census.
The probabilistic model is also chosen because it emphasizes the importance of using a complete population sample in the analysis. The occupations of farm laborer and domestic servant have shown a high proportion of poverty in the past. This is a very serious finding, as the vast majority of black pupils never take Std.
The coefficients of the model (Table 10) are fairly easy to interpret: For a married white man with Std. To the extent that education is not only the most important factor, but often also a prerequisite for the efficient use of other factors, substantial expansion (and reform) of education for the poor will be crucial. We divide the reasons for the limited success of black education into personal and systemic causes:
Research into the lack of school readiness was launched at the Ministry of National Education and pilot year-long preparatory programs resulted in significant improvements in student achievement in Owambo.). Source: van Niekerk (1982), Education Departments, Auditor General's Reports and own calculations. It is often argued that the "academic" content of the curricula encourages unrealistic aspirations in most students and that the vocational content of schooling should be strengthened.
Even if education succeeds in promoting productive skills suited to Namibia's economy, the eradication of poverty is likely to prove a slow, difficult process. 34;The Changing Tolerance for Income Inequality in the Course of Economic Development" Quarterly Journal of Economics:544-566.