ZAKAT AND POVERTY ALLEVIATION IN INDONESIA:
A PANEL ANALYSIS AT PROVINCIAL LEVEL
Evi Aninatin Ni’matul Choiriyah1, Abdul Kafi2, Irma Faikhotul Hikmah3 and Imam Wahyudi Indrawan4
1 Universitas Airlangga, Indonesia, [email protected]
2 Universitas Airlangga, Indonesia, [email protected]
3 Universitas Airlangga, Indonesia, [email protected]
4 International Islamic University Malaysia, Malaysia, [email protected]
Keywords: Indonesia, Panel analysis, Poverty alleviation, Poverty indices, Zakat.
JEL Classification: C23; I32; I38; N35.
ABSTRACT
As a pillar of Islam and an instrument for poverty alleviation, zakat is perceived as an effective tool for tackling the problem of poverty in the Muslim world. However, whether zakat is effective in improving indicators of both quantity and quality of poverty is still a question requiring empirical investigation. This study is aims to empirically investigate the role of impactful zakat in poverty alleviation as indicated by the BAZNAS prosperity index (Indeks Kesejahteraan BAZNAS or IKB), at provincial level in Indonesia. This study covers annual data from 28 provinces in Indonesia for the years 2017 and 2018. Data analysis uses a panel-data approach, with three indicators of poverty – the poverty headcount ratio (P0), poverty gap index (P1), and poverty severity index (P2) – as dependent variables. The study finds that higher BAZNAS IKB, used as a sign of impactful zakat, significantly reduces P0 but has insignificant effect on P1 and P2. The results of this study imply that zakat managers should put emphasis on the poorest section of the poor population to enable improvements in poverty indicators through zakat utilization.
Article history:
Received : October 27, 2019 Revised : August 3, 2020 Accepted : August 27, 2020 Available online : November 15, 2020 https://doi.org/10.21098/jimf.v6i4.1122
I. INTRODUCTION 1.1. Background
The distribution of household characteristics, the distribution of assets between households and the prices of these assets are determinants of poverty level, and thus identification of the structure of poverty often references these factors. However, macroeconomic factors, in particular rate of economic growth and inflation, also influence the level of poverty and inequality (Paes De Barros, Corseuil, Mendonça,
& Reis, 2000). In recent decades, various policies and programmes have been put in place to reduce poverty but, despite these, extensive poverty still persists.
Development must be carefully planned and executed if the eradication of poverty is to be achieved (Ahmed, 2008).
Although some progress has been made towards achieving this goal in several countries, there are currently many development programmes aimed at eradicating poverty that have not been successful, and so more effective programmes and methods are still needed. As part of efforts towards ending poverty in Islamic countries, zakat (payment made annually under Islamic law on certain kinds of property and used for charitable and religious purposes) is an important form of charitable funding (Ahmed, 2008).
Indonesia is a country with a Muslim majority population of 216.66 million people or 85 per cent of its total population (BAZNAS, 2018). This fact implies that zakat has promising potential for contributing to poverty reduction. Data on zakat, infaq (spending simply to please God without asking for any favour or hoping for a return) and shadaqah (voluntary charity) (ZIS) in Indonesia show that there was an increase in zakat collection from 2002 to 2018 (PUSKAS BAZNAS, 2018).
Table 1.
ZIS Collection in Indonesia (2002–2018)
Year IDR (billion) USD (million) Growth (%) GDP growth
2002 68.39 4.98 - 3.7
2003 85.28 6.21 24.70 4.1
2004 150.09 10.92 76.00 5.1
2005 295.52 21.51 96.90 5.7
2006 373.17 27.16 26.28 5.5
2007 740.00 53.86 98.30 6.3
2008 920.00 66.96 24.42 6.2
2009 1200.00 87.34 30.43 4.9
2010 1500.00 109.17 25.00 6.1
2011 1729.00 125.84 15.27 6.5
2012 2212.00 160.12 27.94 6.23
2013 2639.00 195.51 19.30 5.78
2014 3300.00 240.17 25.05 5.02
2015 3653.27 269.29 10.61 5.04
2016 5017.29 365.35 37.46 5.02
2017 6224.37 453.25 24.06 5.07
2018 8117.59 592.52 31.80 5.17
2019 10070* 735.04 19.39 5.0
Source: Badan Amil Zakat Nasional, 2019; Note: 1 USD = Rp 13,700
*Retrieved from Beik (2020)
As can be seen from Table 1, the collection of zakat has increased every year for 17 years. In 2005 and 2007 there was increase in zakat collection of almost 100 per cent due to national disasters in the country (the Aceh tsunami in 2004 and the Yogyakarta earthquake in 2006). The average growth of zakat collection in the period 2002–2019 was 34.05 per cent. Another important point that can be identified is the high growth of zakat collection compared to GDP growth (used as a benchmark for national economic growth). In 2009, there was a decline in national economic growth of 1.3 per cent as a consequence of the worldwide financial crisis. However, zakat collected in the same year increased by 6.11 per cent. The increase in average annual zakat growth between 2002 and 2019 of 34.05 per cent is higher than average GDP growth for the same period, which only reached 5.36 percent. The fact that the growth of zakat was not significantly affected by the global crisis suggests that, in the future, it has the potential to contribute to national development.
To optimize the role of zakat in the national development process, a measurement instrument is needed which can identify how zakat will affect the mustahik (people who deserve zakat) (BAZNAS, 2019). A measuring instrument of this nature will provide at least two positive measures, the first being the enabling of evaluation of zakat distribution and measurement of effectiveness of zakat programmes to ensure positive impact on the mustahik. When it comes to the application of zakat distribution, there will be various factors that influence its management and by understanding and measuring these factors zakat institutions can plan strategic management to improve their performance. Secondly, with this measurement instrument in place, the muzakki (zakat payers) can be kept well informed about the management of the zakat they pay to the institutions.
According to Asfarina, Ascarya, and Beik (2019), zakat potential can be calculated using either a classical approach or a contemporary fiqh (Islamic law) approach.
Using the classical approach, zakat potential is IDR 69.57 trillion or equivalent to 0.56% of GDP but actual zakat funding is only IDR 13.26 trillion or equal to 0.11%
of GDP. In contrast, zakat potential based on the contemporary fiqh approach is IDR 216.54 trillion or equivalent to 1.75% of GDP while actual zakat funding is IDR 74.87 trillion, or 0.60% of GDP. The muzakki should be aware that paying zakat is not only a meeting of their religious duty but that it also has a positive impact on national development.
This paper aims to empirically investigate the role of impactful zakat in poverty alleviation as indicated by the BAZNAS prosperity index (Indeks Kesejahteraan BAZNAS or IKB) at the provincial level in Indonesia. In addition, the role of zakat in reducing poverty in the provinces demands discussion in a scholarly work and in this context this study recommends that zakat is perceived as an effective tool for solving the poverty problem in Indonesia. Thus, national economic policy should include zakat in its efforts to reduce poverty and the government should also utilize zakat as a fundamental strategy for financial stability and sustainable development.
In a previous study examining the effectiveness of zakat in reducing poverty and inequality in Pakistan, researchers attempted to develop a new index using the basic needs deficiency index (BNDI) to measure the effectiveness of zakat as a form of government spending to alleviate poverty in Pakistan. The results
show that BNDI can measure the effectiveness of zakat in alleviating poverty (Abdullah, Derus, & Al-Malkawi, 2015). Zakat institutions have a a great deal of potential for contributing to poverty alleviation (Shaikh, 2016). In research by Ayuniyyah, Pramanik, Saad, and Ariffin (2018) into zakat’s ability to reduce poverty and income inequality using the CIBEST index, the deciles method and the GINI coefficient in analysing data for 1309 recipients of zakat in the province of West Java, results show that the zakat distribution programmes implemented by BAZNAS significantly alleviate poverty and reduce income inequality.
Following the recommendations of Rinia, Fatimah, and Purwanti (2020) and Sari, Beik, and Rindayati (2019), we investigate the poverty headcount ratio (P0), the poverty gap index (P1), and the poverty severity index (P2) as proxies for poverty variables. To the best of our knowledge, no paper in the current literature investigates zakat as a monetary instrument for reducing poverty.
1.2. Objective
The objective of this paper is to measure the impact of IKB on the welfare of mustahik at the provincial level in Indonesia. This study represents the impact of zakat through reference to the IKB. Based on the results of this study, BAZNAS and provincial governments will be able to map out what must be done to improve and optimize their programmes.
In the next section, we briefly discuss the background theory and recent literature on the relationship between zakat and poverty alleviation. In Section III, we introduce the data and their sources and then discuss our methodology.
Section IV summarizes our findings and empirical results, and Section V offers conclusions and recommendations and points out areas for further research.
II. LITERATURE REVIEW 2.1. Background Theory 2.1.1. Zakat and Poverty
Islam regulates the practice of income redistribution through the tool of zakat.
According to Mohsin (2013), zakat aims to eradicate usury and eliminate hardship from Muslim society at micro and macro levels via its role in the state sector. At the micro level, in fulfilling one of the five pillars of Islam, zakat funds will prevent the mustahik from financing themselves via usury to fulfil their basic needs.
Furthermore, at the macro level, zakat funds will prevent the government from taking loans containing usury from non-Moslem capitalist countries. Throughout the history of Islam, zakat has been an important tool of philanthropy in Muslim countries.
During the Caliphate of Umar bin Khattab and Umar bin Abdul Aziz, poverty was overcome through effective and efficient zakat distribution. The population reached a standard of living above the poverty line so that the distribution of zakat to the poor was not required because the population’s basic needs had been met (Mohsin, 2013; Ahmed, 2004). Thus, zakat is an economic instrument in Islam which aims to build people’s welfare, as well as being an instrument of income equality (Sarea, 2012). Eventually, the role of zakat will be able to be directed
towards helping and fostering groups living under the poverty line towards a better and more prosperous life (Hafidhuddin, 2002).
In the book Ihya Ulum Ad-din, Imam Al-Ghazali says that real poverty can be interpreted as a lack of ability to fulfil the basic needs of life, while poverty resulting from greed arose as a result of human desires not satisfied by material wealth. According to Ahmed (2008), poverty in the micro economy reflects total household income derived from constituent components in the form of consumption levels, production levels, human resource capabilities, and welfare distribution.
Poverty alleviation at the micro level uses zakat as an instrument aimed at tackling the component causes of poverty by meeting the level of consumption required for fulfilling basic needs.
Based on research by Ahmed (2008), the collection and distribution of zakat has a positive impact on reducing hardship. However, the extent of this impact depends not only on the potential and amount of zakat funds collected and distributed, but also on the macroeconomic policies established by governments.
2.1.2. Poverty from the Islamic Perspective
We perceive that Islam is not solely a faith, but also a whole way of life that God revealed to humans. According to Abbasi, Mir, and Hussain (2012), Islam was established as a practical faith to be applied in our daily lives, and as a result it covers all the aspects of human life that embody social ethics. Islam provides a solution for all the issues faced by human beings and rests on the five basic pillars of shahadah, salat, zakat, saum, and hajj.
Righteousness is not to turn your faces towards the East and the West; the righteous is he who believes in Allah, the Last Day, the angels, the Book and the Prophets; who gives of his money, in spite of loving it, to the near of kin, the orphans, the needy, the wayfarers and the beggars, and for the freeing of slaves;
who performs the prayers and pays the alms-tax. Such are those who keep their pledges once they have made them and endure patiently privation, adversity and times of fighting. (Qur’an 2: 177).
Based on this verse, Yumna and Clarke (2009) suggest that a devout Muslim is additionally a Muslim who cares for others and seeks fairness for the needy and helpless. Early in the Qur’an, help for the needy is created as the most important principle of the Moslem religion. According to Rahman (1967), the idea of equality means that the Moslem objective cannot be fulfilled until individual freedom is freed from all aspects of profiteering – social, spiritual, governmental, and economic.
At a deeper level, the Qur’an specifically links neglect of the poor with the neglect of faith, as seen in the following verse:
Have you ever observed him who denies religion? He is the one who drives away orphans and does not encourage feeding people in need (Qur’an 107: 1–3).
Thus, the importance of fulfilling basic needs is mentioned clearly in the Qur’an. Requirements for water, food and shelter must be fulfilled and connection between these things is needed. At the same time, it was established that people should work hard to acquire these necessities. The most basic fundamental of Moslem teaching in relation to economic development is fairness (Ahmed, 2008).
2.1.3. The BAZNAS Prosperity Index (Indeks Kesejahteraan BAZNAS or IKB) The IKB is an instrument used by BAZNAS through its subsidiary department PUSKAS to identify the impact of zakat distribution on the wellbeing of the mustahik. Study of the IKB allows examination of output from the distribution and utilization of zakat in terms of the level of mustahik prosperity. IKB is also formulated as a tool to measure the performance of the zakat distribution programmes conducted by BAZNAS. Meanwhile, for the community, IKB is a tool for monitoring the process of zakat distribution through BAZNAS.
According to BAZNAS, IKB has three sub-indices: the CIBEST prosperity index (Indeks Kesejahteraan CIBEST), a modification of the human development index (modified HDI), and the independency index (Indeks Kemandirian). IKB as an index has a score ranging from 0 to 1; the closer the IKB score to 1, the greater the impact and productivity of the channelling of zakat. The categories within the IKB scoring range are as follows (Table 2):
Table 2.
IKB Assessment Category
Score range Information
0.00 – 0.20 Poor
0.21 – 0.40 Deficient
0.41 – 0.60 Satisfactory
0.61 – 0.80 Good
0.81 – 1.00 Excellent
Source: The Impact of Zakat for Mustahik, 2018
2.2. Previous Studies
Poverty can be interpreted as lack of welfare revealed through several aspects of deprivation and can be explained conceptually in a number of ways. Poverty can be created by activities used to regulate the economic, political and social systems of society. The outcomes of these systems reveal the existence of interrelated processes and the creation of shortages among groups of individuals (Ben Naceur
& Zhang, 2016).
The most common ways to measure poverty are based on income or consumption of individuals or households, with the needy identified as having earnings or utilization levels below a specified poverty level. Earnings poverty may be outlined in both absolute and relative terms. Absolute poverty defines the level of hardship in terms of the personal earnings needed to obtain a basket of basic needs for products and services. This hardship level is the level of earning of
individuals based on their ability in their daily lives to meet their basic needs and is the level separating the needy from the non-needy (World Bank, 1993).
Overcoming the problem of hardship should focus on the comprehensive causes of poverty, not only on the facts and definitions of poverty. Janvry and Sadoulet (1999) explain poverty determinants as belonging to four categories namely: i) the role of per capita aggregate income growth; ii) the role of the quality of rising total earnings; iii) the role of macroeconomic performance; and iv) the role of structural context and initial conditions.
In addressing the role of per capita aggregate income growth, a combination of the 682 assessments of earnings of the poorest quintile of 108 countries carried out by Deininger and Squire (1996) found that, within the cycles of mixed development, the earnings of the needy raised in half of one mile of the cases. From state-level information, Ravallion and Datt (1996) indicate that mixed earnings growth reduced poverty in India. Furthermore, using social unit information from a combination of samples from 42 countries, Martin and Chen (1997) noticed that mixed earnings growth decreased poverty, though not differences in income. Thus, there is minimal disagreement on the overall proposition that mixed earnings growth decreases poverty, whereas there is less conclusive proof for its effect on disparity in income.
Several approaches to the impact of spatial prosperity data have been published.
As examples, studies by Psacharopoulos, Morley, Fidzbein, Lee, and Wood (1995) and Martin and Chen (1997) construct a negative relationship between per capita earnings and hardship or disparity, which might react to growth similarly as to downturn, but no attempt is made to check if the power of this relationship differs as earnings increase or decrease.
In addressing the role of aggregate earnings growth, Datt and Ravallion (1998) found that fluctuations in yields and per capita non-agricultural output prejudice poverty reduction when dominant in earnings growth. For sectoral combinations of growth, Ravallion and Datt (1996) investigated the relationship between modification in hardship and alterations in sectoral worth within the primary, secondary and tertiary sectors. Regarding exploitation in India, they found that growth within the primary and tertiary sectors had been dominant in reducing rural and concrete poverty; however, the impact of secondary sector growth was not so convincing because of the capital intensity of trade. These factors emphasize the differing roles of growth in the sectors of agriculture and services in eradicating hardship.
In considering the role of macroeconomic performance, there are many macroeconomic performance indicators that affect poverty, including inflation.
Inflation has been related to increasing hardship by Datt and Ravallion (1998) and consistently cited in analysis of the influencing factors of hardship in Latin America, particularly once a state of hyperinflation is reached (Lustig & Deutsch, 1998).
Factual research into the synergy between financial development and impoverishment reduction delivers largely inconclusive findings (Salah, Shahbaz, Arouri, & Teulon, 2014). Previous studies have examined whether financial development will substantially reduce impoverishment (Odhiambo, 2009).
The key aspect of the positive effects of financial development on the needy is
the enhancement in savings opportunities which may reduce people’s liquidity constraints and increase their physical and individual venture capital (Perez- Moreno, 2011). Additionally, the poor will acquire improving access to credit due to savings accumulation and greater credit accessibility within the financial set-up (Beck, Demirgüҫ-Kunt, & Levine, 2004). Third, the role of financial regulation and management policy is a key space for public intervention directed at enhancing the financial sector’s contribution to impoverishment reduction (Kirkpatrick, Sirageldin, & Aftab, 2001).
Attempts to apply factual data to the inter-temporal causative relationship between financial development and hardship reduction have been mostly mixed in results and inconclusive. A number of studies have tried to look at the link between monetary development and hardship reduction, such as Odhiambo (2009); Akhter, Liu and Daly (2010); Sehrawat and Giri (2016); Sehrawat and Giri (2015); Honohan (2003); Jalilian and Kirkpatrick (2001); Jeanneney and Kpodar (2008); Kappel (2010); Kirkpatrick, Sirageldin and Aftab (2001); Ben Naceur and Zhang (2016); Perez-Moreno (2011); Salah et al. (2014); and Zhuang et al. (2009).
Financial development helps the needy to a bigger share of wealth in regions with steady financial set-ups. However, there are limitations to the impact of financial development on poverty alleviation (Akhter et al., 2010). The foremost restraint is probably the fluctuation that features in financial development.
Inadequate and unstable development of financial establishments additionally undermines the arrogance of the needy within the financial services that area unit accessible (Kirkpatrick et al., 2001). The dearth of confidence means a large part of a society can be excluded from financial services and this consequently slows economic growth and increases hardship and disparity (Akhter et al., 2010).
Odhiambo (2009) identifies the causative relationship between finance, growth and hardship reduction in South Africa, employing a trivariate relationship model.
Financial development and economic growth Granger-cause hardship reduction in the Republic of South Africa, whereas Quartey (2005) finds there is a relationship between financial development, savings mobilization and hardship reduction in Ghana. Although financial development does not Granger-cause savings mobilization in Ghana, it induces hardship reduction. Jalilian and Kirkpatrick (2001) tested the connection between financial development and hardship through the expansion link. They determined that a one-unit adjustment in financial development led to a 0.4% modification in the earnings of the needy, given that there are no direct effects. Moreover, they found that financial development effects hardship reduction through a growth-enhancing impact up to a particular intensity of economic development.
In in-depth discussion concerning impoverishment, the empirical model attracts from Dollar and Kraay (2001), United Nations agency live combination impoverishment by the common per capita financial gain of the needy and indicate that it depends on real Gross Domestic Product per capita and alternative variables, that within the case of integrated financial development, and financial instability indicators. The model is calculated on an outsized sample of underdeveloped nations with panel data for 1966–2000 using the GMM estimator. Two alternative indicators of impoverishment are also used: first, headcount impoverishment is measured by the share of the population earning more than $1 per day. Second, the impoverishment gap, unlike the previous indicator, takes into consideration
the size of the difference between a person’s situation and the poverty line.
Thus, the results shows that financial development is on average positive for the needy, though their financial situation is unstable. However, this finding holds only if financial development is measured in terms of the relation of cash to GDP (liquidity percentage), which provides proof that the passage result presumption has relevancy.
In addition to these approaches, there are several quantitative studies with the same dependent variable, namely ‘poverty‘. Research by Jeanneney and Kpodar (2008) found that for a sample of underdeveloped nations between 1966 and 2000 there were benefits from the capacity of the banking system to ease transactions and provide savings opportunities, but, to some extent failure to reap the benefits of greater accessibility to debt. Moreover, financial development can occur within an environment of monetary instability, which is damaging to the needy. In the end, however, the advantages of financial development for the poor outweigh its costs. Research by Kappel (2010) found that both cross-country and panel-data regressions suggested that disparity and hardship are reduced not only through enhanced debt markets, but also through better developed stock markets. They found that ethnic diversification and the distribution of land are significant and persistent factors in financial-gain difference and in financial condition. Finally, in the literature, there is a tendency to find proof that government disbursement ends creates less financial-gain difference in high-financial-gain countries. Thus, we conclude there is no significant effect in low income countries.
Using a sample of 143 nations between 1961 to 2011, Ben Naceur and Zhang (2016) find that four of the five dimensions of financial development will considerably reduce financial-gain difference and financial condition, except for financial liberalization, which tends to exacerbate them. Thus, banking sector development tends to provide a more important impact on dynamic financial-gain distribution than securities market development. Together, these findings square measure according to the reader that political economy stability and reforms that strengthen individual rights, contract social control, and financial organization policy square measure required to confirm that financial development and easing completely backing the decrease of financial condition and gain parity.
Recent studies by Hoque et al. (2015) show that developing entrepreneurship through zakat for hardship reduction is a new approach being considered when the cause of hardship is not lack of financing and resources but lack of entrepreneurship. A previous study by Hoque et al. (2014) investigated the ways in which the Gross Domestic Product of a Region (GDPR) and the zakah index can contribute to poverty reduction.
Lastly, in relation to constitutional context and initial situations, some structural variables are identified as being elements in hardship, such as GDP in proportion to cultivation (positive on urban hardship and negative on rural hardship). Demographic options embody the proportion of urban dwellers in the population as a whole and also the natural percentage of growth of the society.
Rural–urban movement has been massive within the Latin American nations and this movement has served to distribute poverty across sectors, decreasing the poverty headcount ratio within the rural sector and raising it within the urban sector (Altimir, 1996). Education also has a role to play in poverty alleviation, as
expressed by Psacharopoulos et al. (1995), with the development of education reducing both inequalities and the incidence of hardship. Increases in higher education admission equalize the distribution of education and subsequently reduce financial-gain disparities. They facilitate reduced hardship by raising the productivity of the needy and enhancing their possibilities of access to better-paid occupations, as well as permitting vertical progression of the children of poor people. The role of education in eradicating disparity is proposed by Bourguignon and Morrisson (2002).
III. METHODOLOGY 3.1. Data
This study uses three measures of poverty officially used by Statistics Indonesia, namely i) poverty headcount ratio (P0); ii) poverty gap index (P1); and iii) poverty severity index (P2). These measures are included in the study to investigate whether the impact of zakat influences poverty both in terms of quantity (indicated by P0) and severity (quality) (indicated by P1 and P2).
With regard to their scope, each variable in the study consists of two dimensions.
The first is the cross-sectional dimension, comprising the 28 Indonesian provinces included in this study (six of the 34 Indonesian provinces having been excluded due to lack of data). The complete list of these provinces is shown in Appendix 1.
The second is the time dimension, comprising annual data for the years 2017 and 2018.
In this study, there are three dependent variables and four independent variables, as presented in Table 3.
Table 3.
Description of Variables Dependent Variable
Identifier Type Description Unit
P0 Poverty headcount ratio Number of poor people as a
percentage of total population %
P1 Poverty gap index An index measuring how far
below the poverty line a poor
person is Index
P2 Poverty severity index An index measuring the
inequality of income among
poor populations Index Independent Variable
Identifier Type Description Unit
GRP Gross regional product The sum of all goods and
services produced in a province within a certain time period
millionIDR
GINI GINI index An index that measure
inequality of income of the
whole population Index
Data for the above variables are taken from the Statistics Indonesia website (https://www.bps.go.id/), except for the IKB data which is taken from the website of the Strategic Studies Centre, Badan Amil Zakat Nasional of Indonesia (PUSKAS BAZNAS) (https://www.puskasbaznas.com). In addition, for the gross regional product (GRP) variable, the data is transformed into natural log form (LN) to allow for observation of the economic growth effect on poverty alleviation.
3.2. Model Development
Panel-data analysis is used to analyse the relationship between variables. This is appropriate given the scope of data in each variable having both cross-sectional and and time-series dimensions. There are three possible models for estimation within panel-data analysis. First, pooled ordinary least squares (pooled OLS) is used in the case of no cross-sectional effect being found in the model estimate (Park, 2011, p. 7). The pooled OLS model equations conducted in this study are shown below:
(1) (2) (3) The second model is the fixed-effects model (FEM), which adds different constants for each cross section as representations of time-invariant effects into the intercept (Asteriou & Hall, 2007; Park, 2011). The FEM equations conducted in this study are shown below:
(4) (5) (6)
Finally, the random-effects model (REM) is used. This model is similar to FEM, but the constant is added to the random error instead of the intercept (Asteriou
Table 3.
Description of Variables (Continued) Dependent Variable
Identifier Type Description Unit
Unemployment Unemployment Ratio Number of unemployed as a percentage of total labour force %
IKB BAZNAS prosperity Index An index used to measure the
impact of zakat programmes on zakat recipients (mustahik) Index
& Hall, 2007; Park, 2011). The REM equations conducted in this study are shown below:
(7) (8) (9)
In these equations, LN_GRP is the natural log of GRP; α0, β0, & γ0 are intercepts;
εit, uit & vit are error terms; λi, φi & θi are fixed/random effects; subscript i is the cross section (province), with i = 1, 2, ... 28; and subscript t is the time series (year), with t = 1, 2.
3.3. Method 3.3.1. Panel Data
Panel data or longitudinal data consist of cross-sectional and time-series data (Park, 2011). It comprises observations of the same units in different periods, and may refer to individuals, groups of companies, specific regions or countries, which are analysed by fixed-effects or random-effects models.
The use of panel data allows empirical testing of various hypotheses. With observations that include time and individuals in cross-sectional data, more information is available, enabling more efficient estimates to be made. Using panel data, heterogeneous individuals who cannot be observed or cannot be measured but do not change over time (time-invariant) can be controlled (Baltagi, 2003).
Additionally, bias problems caused by missing variables (because they are not observed) can be solved.
3.3.2. Selection of Best Model
Determination of best model from the three possible models of panel-data analysis is conducted by using three diagnostic tests. First, redundant fixed-effects testing is used to determine whether FEM differs significantly form pooled OLS. The test statistics for the redundant fixed-effects test follow F-distribution (Park, 2011). The hypotheses of this tests are as follows:
Then, the Breusch-Pagan LM test is used to determine whether REM significantly differs from pooled OLS. The test statistics for the Breusch-Pagan LM test follow chi-square distribution (Park, 2011). The hypotheses of this test are as follows:
Third, the Hausman LM test is used to determine whether REM is better compared to FEM. The test statistics for the Breusch-Pagan LM test follow chi-square distribution (Park, 2011). The hypotheses of this test are as follows:
Another robustness test, namely the cross-section dependence test based on Pesaran (2004) can be applied with the following hypotheses to be tested:
All diagnostic tests as well as significance tests within this study use 95% level of significance, which means a null hypothesis would be rejected if the p-value is less than 0.05. All data analysis in this study is conducted using EViews 9 software.
IV. RESULTS AND ANALYSIS 4.1. Descriptive Statistics
The descriptive statistics of variables utilized in this study are shown in Table 4.
Table 4.
Descriptive Statistics
Variable Mean Median Max Min Std. Dev. Obs.
P0 10.30 8.42 23.12 3.91 4.94 56
P1 1.84 1.43 7.41 0.52 1.35 56
P2 0.49 0.34 3.12 0.11 0.52 56
GRP 2,800 1,230 1,560 25 3.830 56
GINI 0.36 0.35 0.44 0.27 0.04 56
UNEMPL 4.87 4.32 9.28 1.37 1.73 56
IKB 0.70 0.7 0.95 0.3 0.13 56
Table 4 shows that from the 56 observations for 28 provinces for the years 2017 and 2018, the poverty headcount ratio (P0) ranges between 3.91% and 23.12% with an average of 10.3%. Meanwhile, the highest poverty gap index (P1) is 7.41 and the lowest is 0.52, with 1.84 as the average. For the poverty severity index (P2), the highest value is 3.12, the lowest value is 0.11 and the average is 0.49.
The GRP value ranges from IDR 25 trillion to IDR 1,560 trillion, with IDR 280 trillion as the average. The GINI index for the observed data lies between 0.27 and 0.44 with an average of 0.36. Unemployment rate lies between 1.37% and 9.28%
with 4.87% as the average. Lastly, the IKB or BAZNAS prosperity index for the observed data ranged from 0.3 to 0.95 with a 0.7 average.
4.2. Diagnostic Test Results
The summary of diagnostic tests along with the best model to be used are shown in Table 5.
Table 5.
Summary of Diagnostic Tests Results
Table 6.
Pesaran CD Test Results Summary Dependent
Variable
Redundant Fixed-Effect Test
(F-statistic)
Breusch-Pagan LM test (chi-square)
Hausman test
(chi-square) Best Model
P0 1041.425750 26.05371 23.571962 FEM
(0.0000)* (0.0000)* (0.0001)*
P1 60.256741 24.82781 7.796471 REM
(0.0000)* (0.0000)* (0.0993)
P2 27.299849 23.10247 4.974971 REM
(0.0000)* (0.0000)* (0.2899)
Note: * denotes significance at 95% level of confidence; p-value is written within the ( )
From Table 5, it is concluded that for the P0 variable, FEM is the best model as recommended by the diagnostic tests. Meanwhile, REM should be used for P1 and P2 variables.
Meanwhile, the results of the Peseran cross-section dependence (CD) test is summarized in Table 6.
Model P0 P1 P2
Pesaran CD value -0.436436 -0.436436 -0.872872
(0.6625) (0.6625) (0.3827)
Note: * denotes significance at 95% level of confidence; p-value is written within the ( )
This information indicates that none of the model are significant for the Pesaran CD statistical test. In other words, the models employed in this study are free from CD problems.
This section consists of one or more test to check the robustness of the results, to ensure that the results are robust and meaningful.
4.3. Panel Data Results
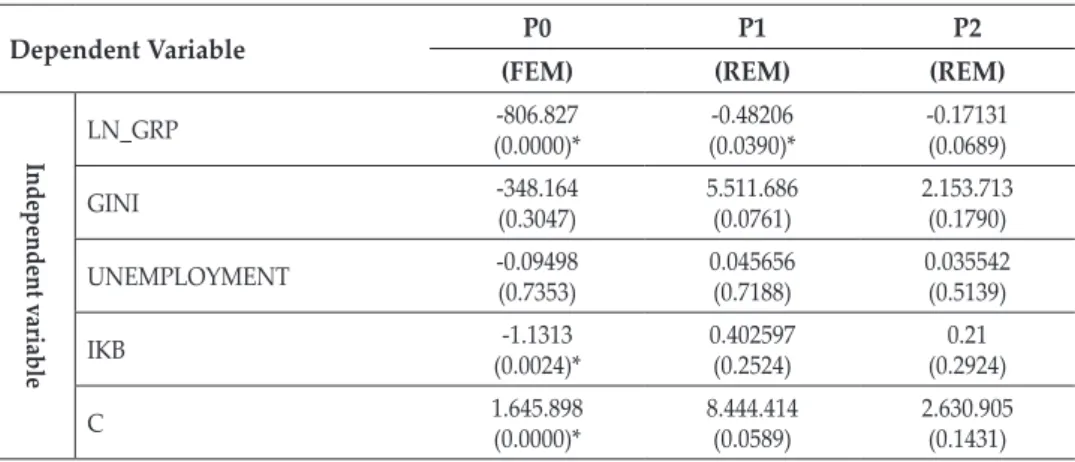
Table 7 shows the summary of models estimated in this study.
Table 7.
Summary of Estimated Models
Dependent Variable P0 P1 P2
(FEM) (REM) (REM)
Independent variable
LN_GRP -806.827
(0.0000)* -0.48206
(0.0390)* -0.17131
(0.0689)
GINI -348.164
(0.3047) 5.511.686
(0.0761) 2.153.713
(0.1790)
UNEMPLOYMENT -0.09498
(0.7353) 0.045656
(0.7188) 0.035542
(0.5139)
IKB -1.1313
(0.0024)* 0.402597
(0.2524) 0.21
(0.2924)
C 1.645.898
(0.0000)* 8.444.414
(0.0589) 2.630.905
(0.1431) Note: * denotes significance at 95% level of confidence; p-value is written within the ( )
Table 7 summarizes results from the three estimation models. For P0, there are two significant independent variables at 95% level of confidence, LN_GRP and IKB. Every 1% of economic growth in a province corresponds to reduction of P0 by 0.08%. Meanwhile, increase of IKB by 0.1 index point leads to a reduction in the poor population of 0.11%. For the P1 model, only LN_GRP shows significant impact at 95% level of confidence, so that every 1% of economic growth in a province corresponds to a reduction in the poverty gap index of 0.005. Lastly, for the P2 model, none of the independent variables show significant impact on the poverty severity index.
4.4. Analysis
The results from the model estimations indicate that more impactful zakat proxied by IKB is only significant in the reduction of P0, the poverty headcount ratio, and is insignificant for P1 and P2. This finding, particularly in relation to the P0 model, is in line with the current normative view of zakat as a tool for poverty alleviation.
However, this study finds that zakat insignificantly affects the quality of poverty in terms of the poverty gap and poverty severity indices.
Many studies have discussed the effect of zakat on poverty alleviation.
Through normative research, Jaelani (2016), Meerangani (2019), Shaikh (2016), Sarea (2012) and Hoque et al. (2015) examine the collection of zakat from muzakki and the distribution of zakat to mustahik. Jaelani (2016) points out that some philanthropy programmes focus on economic empowerment for the poor. Shaikh (2016) identifies the potential zakat collectible in 17 member countries of the Organization of Islamic Cooperation (OIC) and finds that the collected zakat to GDP ratio exceeds the poverty gap index to GDP (PGI–GDP) ratio in all but three OIC member countries. Furthermore, this paper also compared zakat to GDP
(PHCR–GDP) ratio against the poverty headcount ratio, except in five countries.
Hence, the zakat potential sufficient to eliminate poverty. Meerangani (2019) and Hoque et al. (2015) describe productive zakat for mustahik focused on the small business entrepreneur in terms of entrepreneurship development as a tool of poverty alleviation.
Another study (Sarea, 2012) determines zakat as a benchmark for evaluating economic growth, such that zakat is used as a tool to measure economic growth.
If the payment of zakat is high, economic growth will increase. The previous study examines the effectiveness of zakat in reducing poverty and inequality in Pakistan, with researchers trying to develop a new index (BNDI) to measure the effectiveness of zakat as part of government spending intended to alleviate poverty. Results show that BNDI as a new index can measure the effectiveness of zakat in alleviating poverty (Abdullah et al., 2015).
Rinia et al. (2020) explain the gap between zakat collection and distribution in 34 provinces in Indonesia. Around 27.5% of zakat is not distributed at the provincial level, despite the fact that poverty levels are high. Zakat distribution is lower than zakat funding in several regions because of the low collection of zakat data. Although some regions have zakat distribution data, they have not reported it to BAZNAS. The existence of a zakat database is helpful for representing the distribution of zakat for eradicating poverty in Indonesia. Another study related to zakat used to reduce poverty and income inequality, using the CIBEST index, the deciles method and the GINI coefficient as analysis tools for 1309 recipients of zakat in the province of West Java, was carried out by Ayuniyyah et al. (2018). The study found that the zakat distribution programmes implemented by BAZNAS significantly alleviate poverty and reduce income inequality (Ayuniyyah et al., 2018).
Based on the BAZNAS PUSKAS, the BAZNAS welfare index (IKB) is composed of three other indices: the CIBEST welfare index, a modification of the human development index (HDI), and the independence index. The IKB shows the level of impact of productive zakat distributed by zakat managers as measured by mustahik welfare analysis through the CIBEST welfare index, modified HDI, and the independence index. The CIBEST model measures aspects of both material and spiritual poverty. The material poverty aspect of the CIBEST model is based on three factors: the level of material basic needs, the poverty line standard according to BPS, and the limit of assets subject to zakat (nishab). CIBEST measures spiritual aspects for each family based on five variables: prayer, fasting, alms and donations, family environment and government policy. Modified HDI can measure the welfare of mustahik households in terms of health and education levels, while the household independence index examines whether the mustahik household has a permanent job, business and savings.
This finding also implies that zakat only benefits poor people that are already close to the poverty line, thus significantly reducing the poverty headcount ratio, i.e. reducing the size of the poor population. However, zakat does not yet affect the deepest section of the poor population, which may explain why poverty gap and poverty severity remain unaffected by stronger impacts of zakat as measured by IKB.
V. CONCLUSION AND RECOMMENDATIONS 5.1. Conclusion
The objective of this study is to investigate the significance of IKB as a measure of impactful zakat towards poverty alleviation at the provincial level in Indonesia.
IKB is a measuring instrument used by BAZNAS through PUSKAS to identify how impactful zakat distribution is for mustahik wellbeing. The BAZNAS welfare index is composed of three other indices: the CIBEST welfare index, modified HDI, and the independence index. IKB shows the level of impact of productive zakat distributed by zakat managers. The CIBEST model measures aspects of material and spiritual poverty. The material poverty aspect is based on three approaches: the level of material basic needs, the poverty line standard according to BPS, and the limit of assets subject to zakat (nishab). The spiritual aspect of CIBEST are measured for each family based on five variables: prayer, fasting, alms and donations, family environment and government policy. Modified HDI can measure the welfare of mustahik households in terms of health and education levels while the household independence index examines whether the mustahik household has a permanent job, business and savings.
The panel-data analysis in this study finds that impactful zakat as indicated by higher IKB is strongly linked with reduction of poverty headcount ratio. The findings of the study accord with the role of zakat in contributing to increasing human capital and to improving the quality of life of the poor and vulnerable.
Such improvement can include the provision of education, health facilities, and social services. In other words, zakat has already played a role in reducing the extent of the population living below the poverty line. On the other hand, the IKB is not found to significantly affect the poverty gap or poverty severity, meaning that zakat in Indonesia has not improved the quality of poverty at the provincial level.
5.2. Recommendations
From the above conclusion, recommendations for both zakat managers and future researchers can be put forward. First, zakat managers should create zakat programmes for the needy in society through which the poverty gap and poverty severity can be improved, while maintaining existing performance in reducing the size of the needy population. Second, zakat distribution policy must be based on the value of the IKB compiler indices. Furthermore, the government should give more attention to the implementation of zakat collection in Indonesia, to support increases in the beneficiaries of zakat and so that poverty alleviation can be achieved through the distribution and utilization of zakat. Provincial governments should put in place programmes that impact on poverty, such as creating ‘empowerment villages’ to enhance the independence of the poor population.
This study recommends that zakat is perceived as an effective tool for solving the poverty problem in Indonesia and that economic policy should therefore include zakat as a means of reducing poverty. In addition, the government should
include zakat as a fundamental strategy for financial stability and sustainable development. Furthermore, the support and political will of government is needed for regulation and the allocation of government budgets to enhance and optimize the role of zakat in Indonesia. Others, including stakeholders such as BAZNAS, other zakat institutions, and the government, should work together to deal with poverty and income inequality in the country more effectively and efficiently.
This study has some limitations, especially in its data coverage of only two years and some provinces not being included. Future studies should include more time series and cross sections to obtain more comprehensive observations. Future research should also include other variables that may affect poverty indicators, especially for the poverty severity index.
REFERENCES
Abbasi, A. S., Mir, G. M., & Hussain, M. (2012). Islamic Work Ethics: How it Affects Organizational Learning, Innovation, and Performance. Actual Problems of Economics, 12(138), 471–480.
Abdullah, N., Derus, A. M., & Al-Malkawi, H. A. N. (2015). The Effectiveness of Zakat in Alleviating Poverty and Inequalities: A Measurement using A Newly Developed Technique. Humanomics, 31(3), 314–329. https://doi.
org/10.1108/H-02-2014-0016
Ahmed, H. (2004). Role of Zakah and Awqaf in Poverty Alleviation. Occasional Paper No 8, The Islamic Research and Teaching Institute (IRTI). Retrieved from https://EconPapers.repec.org/RePEc:ris:irtiop:0008.
Ahmed, H. (2008). Zakah, Macroeconomic Policies, and Poverty Alleviation:
Lessons from Simulations on Bangladesh. Thoughts on Economics, 18(3), 81–105.
Akhter, S., Liu, Y., & Daly, K. (2010). Cross Country Evidence on the Linkages between Financial Development and Poverty. International Journal of Business and Management, 5(1), 3–19.
Altimir, O. (1996). Economic Development and Social Equity: A Latin American Perspective. Journal of Interamerican Studies and World Affairs, 38(2–3), 47–71.
https://doi.org/10.2307/166360
Asfarina, M., Ascarya, & Beik, I. S. (2019). Classical and Contemporary Fiqh Approaches to Re-estimating the Zakat Potential in Indonesia. Journal of Islamic Monetary Economics and Finance, 5(2), 387–418.
Ayuniyyah, Q., Pramanik, A. H., Saad, N. M., & Ariffin, M. I. (2018). Zakat for Poverty Alleviation and Income Inequality Reduction: West Java, Indonesia.
Journal of Islamic Monetary Economics and Finance, 4(1), 85–100.
Baltagi, B. H. (2003). Econometric Analysis of Panel Data 3rd Edition. Retrieved from https://doi.org/10.16309/j.cnki.issn.1007-1776.2003.03.004
BAZNAS, P. (2018). Outlook Zakat Indonesia 2018.
BAZNAS (2019). Dampak Zakat Terhadap Kesejahteraan Mustahik Evaluasi Program Zakat Produktif 2018 [The Impact of Zakat on Welfare Mustahik Evaluation of the 2018 Productive Zakat Program]. Indonesia: BAZNAS Centre of Strategic Studies.
Beck, T., Demirgüҫ-Kunt, A., & Levine, R. (2004). Finance, Inequality, and Poverty:
Cross-Country Evidence. NBER Working Paper, 10979. National Bureau of Economic Research.
Beik, I. S. (2020). Potensi Zakat Nasional 2020 [Potential of 2020 National Zakat].
Republika, 18.
Ben Naceur, S., & Zhang, R. (2016). Financial Development , Inequality and Poverty: Some International Evidence. In IMF Working Papers. https://doi.
org/10.5089/9781498359283.001.
Bourguignon, F., & Morrisson, C. (2002). Inequality Among World Citizens: 1820 – 1992. In The American Economic Review. https://doi.
org/10.1257/00028280260344443.
Datt, G., & Ravallion, M. (1998). Why have Some Indian States Done Better than Others at Reducing Rural Poverty? Economica, 65(257), 17–38.
Deininger, K., & Squire, L. (1996). A New Data Set Measuring Income Inequality.
The World Bank Economic Review, 10(3), 565–591.
Dollar, D., & Kraay, A. (2001). Growth is Good for the Poor. Policy Research Working Paper No. 2587. Washington DC: The World Bank.
Honohan, P. (2003). Financial Development, Growth and Poverty: How Close Are The Links? Washington DC: The World Bank.
Hoque, N., Khan, M. A., & Mohammad, K. D. (2015). Poverty Alleviation By Zakah in a Transitional Economy: A Small Business Entrepreneurial Framework.
Journal of Global Entrepreneurship Research, 5(7). https://doi.org/10.1186/s40497- 015-0025-8.
Hoque, N., Mamun, A., & Mohammad Ahshanul Mamun, A. (2014). Dynamics and Traits of Entrepreneurship: An Islamic Approach. World Journal of Entrepreneurship, Management and Sustainable Development, 10(2), 128–142.
https://doi.org/10.1108/wjemsd-04-2013-0027.
Jaelani, A. (2016). Zakah Management for Poverty Alleviation in Indonesia and Brunei Darussalam. Turkish Economic Review, 3(3), 495–512.
Jalilian, H., & Kirkpatrick, C. (2001). Financial Development and Poverty Reduction in Developing Countries. Working Paper No. 30, Institute for Development Policy and Management, University of Manchester, UK.
Jeanneney, S. G., & Kpodar, K. (2008). Financial Development and Poverty Reduction: Can There Be a Benefit Without a Cost? The Journal of Development Studies, 47(1), 143–163.
Kappel, V. (2010). The Effects of Financial Development on Income Inequality and Poverty. Working Paper 10/127. Zürich, Switzerland: Centre of Economic Research at ETH.
Kirkpatrick, C., Sirageldin, I., & Aftab, K. (2001). Financial Development, Economic Growth, and Poverty Reduction. The Pakistan Development Review, 39(4), 363–
Lustig, N., & Deutsch, R. (1998). The Inter-American Development Bank and Poverty 388.
Reduction: An Overview. Washington, DC: Inter-American Development Bank.
Martin, R., & Chen, S. (1997). What Can New Survey Data Tell Us about Recent Changes in Distribution and Poverty? The World Bank Economic Review, 11(2), 357–382.
Meerangani, K. A. (2019). The Effectiveness of Zakat in Developing Muslims in Malaysia. Insaniyat: Journal of Islam and Humanities, 3(2), 127–138. https://doi.
org/10.15408/insaniyat.v3i2.11315.
Mohsin, M. I. A. (2013). Potential of Zakat in Eliminating Riba and Eradicating Poverty in Muslim Countries. EJBM-Special Issue: Islamic Management and Business, 5(11), 114–126.
Odhiambo, N. M. (2009). Finance-Growth-Poverty Nexus in South Africa: A Dynamic Causality Linkage. The Journal of Socio-Economics, 38, 320–325. https://
doi.org/10.1016/j.socec.2008.12.006.
Paes De Barros, R., Corseuil, C., Mendonça, R., & Reis, M. C. (2000). Poverty, Inequality and Macroeconomic Instability (Issue 750). Brazilia, Brazil: Institute for Applied Economic Research.
Park, H. M. (2011). Practical Guides To Panel Data Modeling: A Step by Step Analysis Using Stata (Tutorial Working Paper). http://www.iuj.ac.jp/faculty/kucc625.
Perez-Moreno, S. (2011). Financial Development and Poverty in Developing Countries: A Causal Analysis. Empirical Economics, 41(1), 57–80. https://doi.
org/10.1007/s00181-010-0392-5.
Pesaran, M. H. (2004). General Diagnostic Tests for Cross Section Dependence in Panels.
Working Paper No. 1233. Munich, Germany: CESifo Group.
Psacharopoulos, G., Morley, S., Fidzbein, A., Lee, H., & Wood, W. C. (1995).
Poverty and Income Inequality in Latin Amerika During The 1980s. Review of Income and Wealth, 41(3), 245–264.
Puskas BAZNAS. (2018). Outlook Zakat Indonesia 2019. Pusat Kajian Strategis Badan Amil Zakat Nasional (BAZNAS).
Quartey, P. (2005). Financial Sector Development, Savings Mobilization and Poverty Reduction in Ghana. Working Paper 2005/71.UNU-WIDER Research Paper.
Ravallion, M., & Datt, G. (1996). How Important to India’s Poor Is the Sectoral Composition of Economic Growth? The World Bank Economic Review, 10(1), 1–25.
Rinia, R., Fatimah, F., & Purwanti, A. (2020). Zakat and Poverty: An Indonesian Experience. International Journal of Innovation, Creativity and Change, 10(11), 759–770.
Salah, G., Shahbaz, M., Arouri, M., & Teulon, F. (2014). Financial Development and Poverty Reduction Nexus: A Cointegration and Causality Analysis in Bangladesh. Economic Modelling, 36, 405–412. https://doi.org/10.1016/j.
econmod.2013.09.049.
Sarea, A. M. (2012). Zakat as a Benchmark to Evaluate Economic Growth: An Alternative Approach. International Journal of Business and Social Science, 3(18), 242–245.
Sari, D. F., Beik, I. S., & Rindayati, W. (2019). Investigating the Impact of Zakat on Poverty Alleviation: A Case from West Sumatra , Indonesia. International Journal of Zakat, 4(2), 1–12.
Sehrawat, M., & Giri, A. K. (2015). Financial development , poverty and rural- urban income inequality : evidence from South Asian countries. Quality &
Quantity, 50(2), 577–590. https://doi.org/10.1007/s11135-015-0164-6.
Sehrawat, M., & Giri, A. K. (2016). Financial Development and Poverty Reduction in India: An Empirical Investigation. International Journal of Social Economics, 43(2), 106–122.
Shaikh, S. A. (2016). Zakat Collectible in OIC Countries for Poverty Alleviation : A Primer on Empirical Estimation. International Journal of Zakat, 1(1), 17–35.
Yumna, A., & Clarke, P. M. (2009). Integrating Zakat and Islamic Charities with Microfinance Initiative in the Purpose of Poverty Alleviation in Indonesia. 8th International Conference on Islamic Economics and Finance, 1–18.
Zhuang, J., Gunatilake, H., Niimi, Y., Khan, M. E., Jiang, Y., Hasan, R., Khor, N., Lagman-Martin, A. S., Bracey, P., & Huang, B. (2009). Financial Sector Development, Economic Growth, and Poverty Reduction: A Literature Review.
Economics Working Paper Series, Asian Development Bank.
APPENDIX 1
List of Provinces Observed in the Dataset
No. Province No. Province
1 Aceh 15 Bali
2 North Sumatra Utara 16 West Nusa Tenggara
3 West Sumatra 17 East Nusa Tenggara
4 Riau 18 West Kalimantan
5 Jambi 19 Central Kalimantan
6 South Sumatra 20 South Kalimantan
7 Bengkulu 21 East Kalimantan
8 Bangka Belitung Islands 22 North Kalimantan
9 Riau Islands 23 North Sulawesi
10 West Java 24 Central Sulawesi
11 Central Java 25 Southeast Sulawesi
12 Special Region of Yogyakarta 26 Gorontalo
13 East Java 27 West Sulawesi
14 Banten 28 West Papua