An assessment of amount, distribution and use of urban green spaces in small towns of the Eastern Cape
Thesis submitted in fulfilment of the requirements for the degree of
MASTER OF SCIENCE at
RHODES UNIVERSITY by
Denis Siphosihle Radebe
June 2018
i
Table of Contents
Table of Contents ... i
List of figures…….. ... iv
List of tables ………..v
Acknowledgments ... vii
Dedication……… ... 1
Declaration……….. ... 2
Abstract……….. ... 3
CHAPTER 1: GENERAL INTRODUCTION ... 4
1.1 Introduction ... 4
1.2. Problem statement ... 6
1.3. Objectives and research questions ... 7
1.4. Structure of the thesis ... 8
CHAPTER 2: LITERATURE REVIEW ... 9
2.1. Introduction ... 9
2.2. Urbanisation ... 9
2.3. Significance and the meaning of urban green space ... 11
2.4. Classification of urban green spaces ... 12
2.5. Benefits of urban green spaces ... 16
2.5.1 Social benefits ... 17
2.5.2 Cultural benefits ... 17
2.5.3. Health benefits ... 18
2.5.4. Economic benefits ... 18
2.5.5. Environmental benefits ... 19
2.6. Disadvantages of urban green spaces ... 20
2.7. Challenges facing urban green spaces ... 21
2.8. Policies, enforcement and governance of urban green space ... 22
2.9. Urban planning in South Africa ... 23
CHAPTER 3: STUDY SITES AND RESEARCH METHODS ... 26
3.2. Background and geographical settings of the Eastern Cape ... 26
3.3. Climate and vegetation ... 28
3.4. Methodology ... 30
3.4.1. Research approach ... 30
3.4.2. Research design ... 31
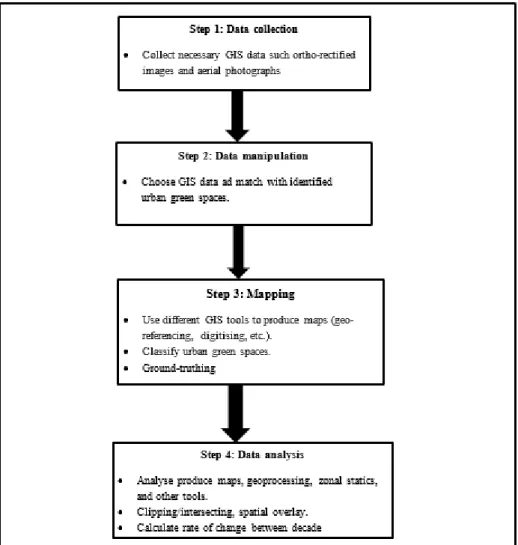
3.4.3. GIS mapping ... 33
ii
3.4.4. Households surveys ... 34
3.4.5. Focus group discussions ... 35
3.5. Ethical considerations ... 35
3.6. Data analysis ... 36
CHAPTER 4: A spatial analysis of urban green spaces in small towns of the Eastern Cape, South Africa ………38
4.1. INTRODUCTION ... 38
4.2. METHODS ... 40
4.3. RESULTS... 40
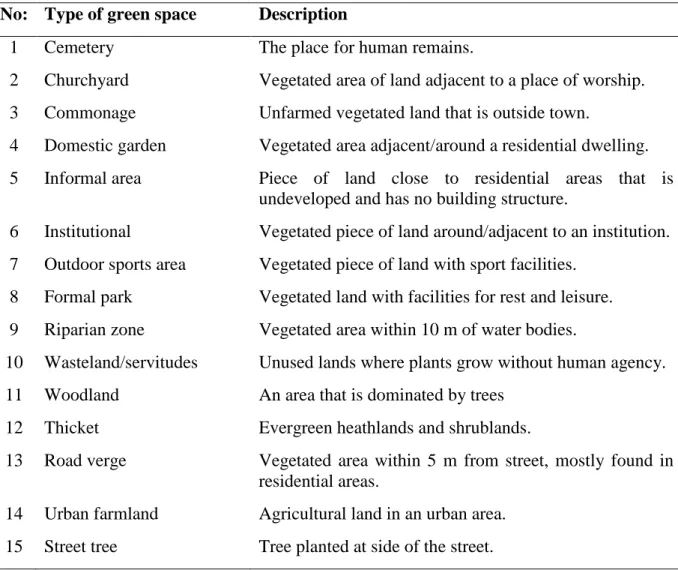
4.3.1.Types of green spaces ... 40
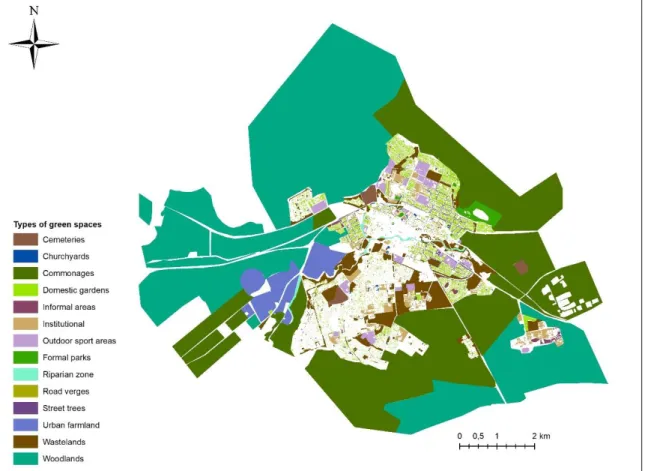
4.3.2. Distribution of green spaces in small towns ... 40
4.3.3. Distribution of urban green spaces within towns ... 45
4.3.4. Rate of change in green space area ... 48
4.3.5. Mapping accuracy ... 48
4.4. DISSCUSION ... 50
4.4.1. Classification of urban green spaces ... 50
4.4.2. Amount and distribution of green spaces... 50
4.4.3. Rate of change ... 52
4.5. CONCLUSION ... 53
CHAPTER 5: Uses, benefits, preferences and perceptions of urban green spaces by residents in poorer suburbs ... 54
5.1. INTRODUCTION ... 54
5.2. METHODS ... 55
5.3. RESULTS... 56
5.3.1.Profile of respondents ... 56
5.3.2. Use of urban green spaces ... 57
5.3.3. Access to urban green space ... 65
5.3.5. Benefits of urban green spaces ... 69
5.3.6. Respondent perceptions of green spaces ... 69
5.4. DISCUSSION ... 76
5.4.1. Perceptions of urban green spaces by urban residents ... 76
5.4.2. Use of and access to urban green spaces ... 77
5.5. CONCLUSION ... 79
CHAPTER 6: Synthesis, conclusions and recommendations ... 81
6.1. Introduction ... 81
6.2. Summary of the results and key research findings in relation to the objectives ... 82
iii
6.2.1. To determine the location, amount and types of urban green spaces ... 82
6.2.2. To understand how urban green spaces are appreciated, preferred and used by urban residents ... 84
6.3. Conclusion ... 85
6.4. Limitations of the study ... 87
6.5. Policy implications and recommendation... 88
References…………. ... 89
Appendices……….. ... 108
iv
List of figures
Figure 2.1: A model of the benefits of urban green spaces Figure 3.1: Location of the study towns
Figure 3.2: The biomes of the Eastern Cape Figure 3.3: Summary of research design Figure 3.4: GIS steps followed
Figure 4.1: Types of green spaces that can be found in small towns Figure 4.2: Distribution of green spaces in slow growing towns Figure 4.3: Distribution of green spaces in fast growing towns Figure 5.1: Uses of green spaces at homes
Figure 5.2: Features that attract people to green spaces Figure 5.3: Deterrents to use green space
Figure 5.4: Changes observed by respondents in green spaces overtime
v
List of tables
Table 2.1 Uses for urban green spaces through history Table 2.2: Types of urban green spaces
Table 3.1: A comprehensive typology Table 3.1: Population growth in study towns
Table 3.2: Summary of vegetation, attitudes, mean annual rainfall and temperature Table 4.1: Types of green spaces identified in the study towns
Table 4.2: Percentage coverage of different green spaces in eight Eastern Cape small towns Table 4.3: Green space per capita in eight small towns
Table 4.4: Proportion (%) of urban green space per suburb in slow growing towns Table 4.5: Proportion (%) of urban green space per suburb in fast growing towns Table 4.5: Rate of change in urban green space area in eight Eastern Cape small towns Table 4.6: Ground-truthing accuracy assessment
Table 5.1: Demographic profile of respondents
Table 5.2: Respondents who have green spaces at home Table 5.3: Green space usage
Table 5.4: Types of activities performed in different green spaces
Table 5.5: Exploring the use of green spaces between female and male respondents Table 5.6: Green space usage by township and RDP residents
Table 5.7: Frequency of green space usage Table 5.8: Visiting times of green spaces Table 5.9: Company to types of green spaces Table 5.10: Length of stay in the green space
vi
Table 5.11: Estimated travel distance from home to different green spaces Table 5.12: Means of access to different types of green spaces
Table 5.13: Choices of most desirable green spaces Table 5.14: Benefits of green spaces
Table 5.15: Conceptualisation of green spaces
Table 5.16: Types of green spaces respondents considered to be green spaces within towns and RDP suburbs
Table 5.17: Respondents’ perceptions of green spaces within their suburbs Table 5.18 : Gender’s perceptions of green spaces within their suburbs.
Table 5.19: Suggested improvements of green spaces
vii
Acknowledgments
I would like to express my gratitude and appreciation for the support offered by the following people:
My supervisor, Prof Charlie Shackleton, for his patience, understanding, guidance and professional input. Thank you for believing in my capabilities and contributing so much to help shape this work.
My co-supervisor, Prof Michelle Cocks, thank you for your guidance and your constructive criticism. Thank you for pushing the boundaries to ensure performance.
Your funding from NRF provided for the running costs of this project, without your funding this project would not have been a success.
Prof Valerie Møller, thank you for providing financial assistance.
David Gwapedza and Aidan Gouws, thank you for your GIS assistance. The advice you gave me helped to clarify what needed to be done.
My office mates and urban realities team especially Amanda Manyani, thank you for your moral support.
I would like to extend my gratitude to my research assistant, Bulelani Booi, thank you very much for your help and making data collection easier.
Nqabisa Booi, thank you for your help with field work logistics.
Individuals, who participated in the study, thank for your valuable time.
My friends especially Ntokozo Zondi, Sibusiso Khuzwayo and Ndunduzo Cele, thank you for the moral support through this path.
To my mom, Aunt Lilian and siblings, for showing faith in me and giving me liberty to choose what I desired. I consider myself the luckiest in the world to have such a supportive family, standing behind me with their love and support.
To my God, you deserve the glory.
Any opinion, finding, conclusion or recommendation expressed in this material is that of the authors and the NRF does not accept any liability in this regard.
1
Dedication
This thesis is dedicated to a lovely memory of two important people in my life who sadly did not live to see this work, my father Mr P.A. Radebe and brother V.Z. Radebe for their impact and influence in my life within a short time.
2
Declaration
I, Denis Siphosihle Radebe, hereby declare that the work described in this thesis was carried out in the Department of Environmental Science, Rhodes University under the supervision of Prof. Charlie Shackleton and Prof Michelle Cocks. The various components of the thesis comprise original work by the author and have not been submitted to any other university.
Denis Siphosihle Radebe Date: 26/06/2018
3
Abstract
Most regions of the developing world are experiencing large-scale urbanisation, with urban population growth outstripping rural growth. This is most marked in small and medium-sized towns as opposed to megacities. Urbanisation is associated with numerous changes in social, economic and ecological states and dynamics. A key one, of interest in this study, is the sustainability and liveability of the growing towns and cities. The retention, provision and maintenance of multifunctional urban green infrastructure are a core strategy in this regard.
This study therefore sought to assess the amount, distribution and use of urban green spaces within South Africa using small towns of the Eastern Cape. The primary research included sixteen aerial images of which eight were historical aerial photographs and another eight were the latest aerial images of the selected study towns. Historical and latest aerial images were digitised to classify the types and calculate the amount of urban green space. GIS mapping, interviews and focus group discussions were conducted with urban residents to understand how these green spaces are used. The analytical tools in this study derived from social science included household surveys of 180 randomly selected respondents in small towns. Fifteen types of green spaces were identified in the sample towns. The study further revealed that green spaces are not distributed equally in different suburbs of small towns, generally being less green spaces, especially formal parks and recreation areas, in poorer areas. The results indicated a decline of green spaces with urbanisation, and most marked in fast growing towns. The results suggested that urban residents frequently visited urban green spaces, with most respondents favouring the use of green spaces for social and cultural benefits. How use of different spaces was strongly gender related, with males favouring less developed green space types (such as commonages and woodlands) and females for formal areas such domestic and institutional gardens and churchyards. Respondents also identified various challenges associated with using and accessing urban green spaces, with pollution, crime and lack of maintenance in particular. The study shows the importance of GIS as a mapping tool that can be used to provide information for ecological planning in rapidly changing urban environment. The research process generated several lessons that need to be taken into consideration when designing urban landscapes, most importantly relating to the diversity, quantity, quality and maintenance of urban green spaces.
Keywords: GIS, small towns, urban green spaces and uses
4
CHAPTER 1: GENERAL INTRODUCTION
1.1 Introduction
Over the past three decades the world has experienced an urban revolution, with several reports noting that for the first time in human history the majority of the world’s population live in urban areas (UN-Habitat, 2015). The level of urbanisation is expected to increase in all major areas of the developing world, with rates of urban growth being highest in Africa and Asia (United Nations, 2008). However, Potts (2009) argues that urbanisation rates are not so high in Africa as most scholars are claiming. Obeng-Odoom (2010) adds that rural development strategies and urban hash conditions will force rural residents to stay in rural areas. As urbanisation is an on-going process the need for urban green spaces is becoming important to support the quality of life for urban residents (Haaland and van der Bosch, 2015).
It is estimated that by 2050 approximately 1.2 billion people in Africa will be living in cities and towns (UN-Habitat, 2008). Approximately 62 % of the population in South Africa live in urban areas (Turok, 2012), and it is increasing. Although the more economically developed provinces and larger cities attract the most migrants from rural areas, poorer provinces, such as the Eastern Cape, and smaller towns are also experiencing urban growth (Todes et al, 2010). Statistics South Africa (2015) expected that approximately 189 975 people will come to the Eastern Cape between 2011 to 2016. This is because “In the new South Africa, people would choose not to be labour migrants but rather would migrate and settle permanently at the places where they work” (Posel, 2004:277). However, this surge in urbanisation after the demise of apartheid laws and restriction has posed challenges, with urban planners authorities being unable to keep up, consequently, in many towns and cities the legacy of the apartheid separations and underdevelopment are still evident today, and even reproduced (Geyer et al., 2012). For example, residential areas with high urban growth and low incomes usually have insufficient infrastructure, housing and urban green spaces (McConnachie and Shackleton, 2010). Obeng-Odoom (2010) mentioned that urbanisation might lead to ‘abnormal’
urbanisation trajectory. For example migration of farm workers might have a negative impact on food production (Obeng-Odoom, 2010).
5
Indeed, urban green spaces and other sustainability measures are amongst the last aspects to be considered by planners and authorities (Ruwanza and Shackleton, 2016). This perpetuates the frequent environmental injustices encountered during the apartheid era (Maas et al., 2006). Planners and local stakeholders need to understand and cater for long terms urban sustainability, which includes implementing urban green space projects that are shaped by the needs, concerns and desires of urban residents (Wolch et al., 2014). Internationally, green spaces are seen as important components of urban design because they contribute to urban health, and make the urban environment more pleasant and liveable to urban residents (Gairola and Noresh, 2010). It is now widely recognised that protection and management of urban green spaces is important for sustainable development and sustainability of urban areas (Cilliers et al, 2014).
The majority of the urbanisation and urban sustainability literature deals with large cities.
This overlooks that numerically there are many more small towns than large cities and that the combined population of those living in all small towns can match or exceed that in the large cities (Freire et al., 2014). In South Africa, according to Department of Housing (1997) a small town can be defined as a town with a population of less than 100 000 people.
However, different countries define small towns differently, for the example European Union (2011) defines a small town as one with a population between 10 000 and 50 000. In many countries scholars and policy-makers have neglected to address the problems that are facing small towns (Hoogendroorn and Visser, 2016), overlooking that small towns are also economic hubs at a finer scale and many play a crucial role in the agricultural, mining and tourism sectors (Baker and Cleason, 1990). Inadequate information about the dynamics and sustainability needs of small towns can lead to negative impact on the lives of the residents (White, 2004).
The complexity and constant changing of urban landscapes require detailed inventories that will provide a reliable data for planning and policy decisions (Antrop, 2004). Geographic information systems (GIS) are ideal for multi-disciplinary data sets and perform accurate analysis (Al-Ballaa et al., 2012). GIS can receive, store, manipulate and retrieve large data sets (Balram and Dragi´cevi´, 2005). GIS is a computer-based system for the input, storage, analysis and display of spatial information (Steinberg and Steinberg, 2015). GIS has been used to answer different research questions pertaining to urban green spaces (Al-Ballaa et al., 2012). For example, McConnachie and Shackleton (2010) used GIS to determine the distribution of urban green spaces in small towns of the Eastern Cape, South Africa, whilst
6
Al-Ballaa et al. (2012) did the same in Al-Medinah, Saudi Arabia. Both studies showed that there were inequalities in the distribution of urban green spaces. In Montreal Island (Canada), Balram and Dragi´cevi´ (2005) used GIS to understand attitudes of urban residents towards urban green spaces. They revealed that community members were interested in participating in policy development and plans for green spaces. It is further mentioned by Balram and Dragi´cevi´ (2005) that GIS can provide up to date and correct information for environmental planning.
In this study GIS was used together with household surveys and focus group discussions to assess urban green spaces in small towns of the Eastern Cape. The study examined types of urban green spaces, the amount and changes in green spaces over time, the relationship between the distribution of urban green spaces and how urban residents use, benefit and appreciate urban green spaces in small towns of the Eastern Cape. There is considerable literature on the benefits of urban green spaces; however, very little is from small towns in the developing (Shackleton, 2006) and the knowledge on the distribution of these urban green spaces is limited (Roy et al., 2012).
1.2. Problem statement
International literature and developmental theory shows that small towns are generally ignored by development theorists and urban researchers (Donaldson and Marais, 2012, Turok 2012). This is further emphasised by White (2004) who state that what is missing in the discussion on small towns and rural urban linkages is solid empirical research on what is found and what is happening in small towns and developing countries. Some of the reasons for the lack of interest in small towns is because they are in rural areas and generally underdeveloped areas (UN-Habitat, 2008), and are deemed to play little role in national economies (White, 2004). The literature on urban planning has put more emphasis on urban migration and its consequences for large urban areas (UN-Habitat, 2008). This neglect of the nature, dynamics and challenges of small towns is likely to have negative impacts on the lives of the people living in small towns or in the immediate surrounding region (White, 2004).
Additionally, given the legacy of apartheid in South Africa there are few studies that have been done in towns that were once reserved for black South Africans, i.e. in the former homelands (Hoogendoorn and Visser, 2015). This is true for urban studies generally, and in terms of the subject of this thesis, especially true regarding urban sustainability and the role
7
of urban greens spaces in such. In South Africa most studies focusing on urban green spaces have been in larger cities such as Cape Town, Johannesburg and Durban (Brown-Luthango et al., 2012; Pillay and Pahlad, 2014). Therefore, the study of urban green spaces in small towns is relevant.
Irrespective of town or city size, much emphasis regarding urban development in the developing world relates to the provision of basic services and infrastructure, namely housing, transport, energy and water provision, education and health services. This is typically done with little regard to the impacts that urban development might have on natural ecosystems (UN-Habitat, 2012; Ruwanza and Shackleton, 2016). The same applies in much of South Africa, as the growth in urban populations exacerbates pressure on resources and services, and in so doing creates pressures on land and natural ecosystems (Cilliers et al, 2012). Since it seems fairly clear there has been comparatively little research on green spaces in the small towns of many developing countries, it can be argued that the need to identify the range, diversity and basic attributes of their green spaces is even greater. There is a gap in understanding how urban green spaces are distributed and used in developing countries.
1.3. Objectives and research questions
With the context outlined above, and the more detailed literature in Chapter 2 this study explicitly sought to meet and answer the following objectives and questions regarding small towns in the Eastern Cape:
(i) To determine the location, amount and types of urban green spaces.
(a) What types of urban green spaces are present?
(b) How are they distributed?
(c) Has the amount and composition of urban green spaces changed over time?
(ii) To understand how urban green spaces are appreciated, valued and used by urban residents.
(a) How are the urban green spaces used?
(b) What benefits do the users derive from urban green spaces?
(c) What are the perceptions and preferences of urban residents towards urban green spaces?
8 1.4. Structure of the thesis
This thesis is divided into six chapters. The present chapter briefly outlines the importance of urban green space research, the problem statement and leads to the aims and objectives of the present study. Chapter 2 provides a review of the literature on urban green spaces, which includes urbanisation and sustainability of towns, urbanisation and planning in South Africa.
It also considers the classification of urban green spaces, activities and reasons for visiting them, benefits obtained, disadvantages, challenges and governance of green spaces. Chapter 3 describes the study sites as well as the methodology and how data was gathered to address the key questions. Chapter 4 presents the spatial analysis of green spaces in the sample towns, while Chapter 5 describes and analyses the current use patterns of the different types of green spaces in the small towns. Chapter 6 provides a synthesis along with recommendations for future research and a general conclusion.
9
CHAPTER 2: LITERATURE REVIEW
2.1. Introduction
This chapter will consider the contribution of urban green spaces to urban sustainability and liveability, as well as the government policy interventions that have historically shaped the urban green spaces in South Africa. The literature review tackles several topics. The first is urbanisation, in terms of drivers, rates and consequences, globally and in South Africa. This is followed by a section defining green spaces and thematic areas of classification, and the benefits and challenges are discussed. Throughout there is an eye to policy and governance issues of green spaces that help in contextualising the study.
2.2. Urbanisation
Urbanisation is defined differently according to different disciplines. Gottdiener and Budd (2005) define urbanisation as the process that occurs when the number of people who are living in towns and cities increases leading to urban expansion. However, Parnell and Walawege (2014) define urbanisation as the process where there is a movement of people from rural to urban areas and people become concentrated in one area. From these definitions, it can be noted that urbanisation involves development, expansion and migration of people to towns and cities. Furthermore, it is predicted that the natural population growth within cities in Africa will exceed migration into towns and cities by 2050 (Parnell and Walawege, 2014).
Natural urban population growth and in-migration have been recognised as the primary drivers of urbanisation in Africa (Turok, 2010). In Africa, the natural population growth is particularly high as there is a high fertility rate compared to other continents (UN-Habitat, 2008). For example, in 2007 the fertility rate was 4.7% compared to a global average of 2.5
% (UN-Habitat, 2008). International migration is when people leave their country of origin to move to another country (Gottdiener and Budd, 2005). UN-Habitat (2008) reported that South Africa is experiencing high migration from African countries, Asia and India. Push factors such as land degradation, civil war and unemployment are the main drivers of international migration (Todes et al, 2010). Between 2000 and 2010 and annual net immigration of 247 000 was reported in South Africa (Statistics South Africa, 2015).
10
Todes et al (2010) state that in South Africa urbanisation was constrained by apartheid and capitalism policies. These policies were made to control movement of people from rural to urban areas, and the location and nature of urban spaces reserved for black South Africans (Tissington, 2010). The apartheid system separated South Africans according to race and social class. Apartheid spatial planning through the Group Areas Act was pronounced in this period and designated black, coloured and Indians to specific urban areas and rural homelands (Tissington, 2010). The Group Areas Act of 1950 can be linked with allocation/distribution of urban green spaces in urban planning. The repeal and breakdown of these policies in the early 1990s resulted in an influx of rural people moving to urban areas to look for job opportunities and better services and livelihoods (Todes et al., 2010). The expansion of towns and cities resulted in conversion of rural and peri-urban farm land to urban areas (Benton-Short and Short, 2008). In this period there were job opportunities in the mining sector and there was an expansion of industries in the coastal areas (Turok, 2010).
After the 1994 democratic elections, there was a movement of black South Africans to look for employment and a better quality of life in towns and cities (Todes et al., 2010). The new democratic government aimed to ensure that the standard of living for the previously marginalized was improved (Møller, 2007). The national government came up with a slogan which stated, “A better life for all” (South Africa, 1994). This aimed to narrow the gap that was formed by the apartheid government among the different race groups. This was reflected in quality of life studies, with township dwellers noticing real changes in their lives and their standard of living after 1995 (Møller, 1998). They could afford more material goods, they were provided with better schools and other basic needs.
The management or guiding of urbanisation benefits from proper urban planning (Turok, 2012). Urban planning is a framework and approach that is designed to allocate and help city planners and developers to use land sustainably and involve stakeholders in planning (UN- Habitat, 2013). Rydin (2010) suggests that sustainable development needs to be integrated into urban planning. Urban planning also looks at improving infrastructure and quality of life in cities and towns (Short and Short, 2008). Gottdiener and Budd (2005) used the term sustainable urbanisation to emphasise that urban planning needs to look at social, economic and environmental aspects so that the current and future generation can benefit. Urban planning, urban regulations and urban financial strategies are important for sustainable urbanisation (UN-Habitat, 2015).
11
The UN-Habitat (2009) argues that climate change, food insecurity, resource depletion and economic instability will increasingly affect towns and cities in developed and developing countries, and it will be more noticeable in areas with limited planning and policies to support sustainable cities. The natural disasters such as tropical cyclones, sea level rise, droughts and flooding will affect urban areas, especially informal settlements (UN-Habitat, 2015). For example, in 2011 most urban areas in Ibadan (Nigeria) were affected by the floods and more than 100 families were homeless (Agbonkhese, 2014). The increase in environmental problems of urban areas has forced governments to include sustainability in planning approaches (UN-Habitat, 2008). Urban sustainability refers to an urban area that meets the needs of urban residents without destroying natural resources so that the next generation will benefit (Benton-Short and Short, 2008). The main purpose of sustainability is to decrease ecological footprints and improve the quality of life in urban areas (UN-Habitat, 2009). This goes hand in hand with urban resilience, which deals with adaptability to shocks and challenges, and prevents any increase in the vulnerability of urban residents resulting from any shocks. Urban green infrastructure is seen as a crucial, and often more cost-effective, means of promoting resilience (Hansen and Pauleit, 2014; Shackleton et al. 2018), and urban green spaces are a core component of urban green infrastructure (Tzoulas et al., 2007).
Urban ecosystem services need to be seen as the part of urban sustainability (Benton-Short and Short, 2008), along social justice, political participation and ecological regeneration (UN- Habitat, 2015). Parnell and Walawege (2014) point out that weak management of cities and towns will have negative impacts in the environment and the supply of urban ecosystem services. UN-Habitat (2015) suggests that Local Agenda 21, smart growth and environmental justice need to be considered in sustainable cities and towns. UN-Habitat (2009) emphasise that there is a need to balance the brown and green agendas in urban areas.
2.3. Significance and the meaning of urban green space
Mensah (2014a) defined urban green space as the area that is covered by natural or human made vegetation in an urban area, which for some commentators is analogous to urban green infrastructure (Tzoulas et al., 2007). Parks, reserves, sport fields, river banks, trails, street trees, greenways, nature conservation areas, streams and green walls are the examples of urban green spaces (Wolch et al., 2014). The World Planners Congress and UN-Habitat
12
forum that took place in June 2006 in Vancouver played a major role in thinking about the future of towns and cities, especially in developing countries (Watson, 2009). The importance of incorporating urban green spaces in urban planning has been emphasised by planning concepts such as garden cities, green belts, green fingers, and greenways (Mensah, 2014a).
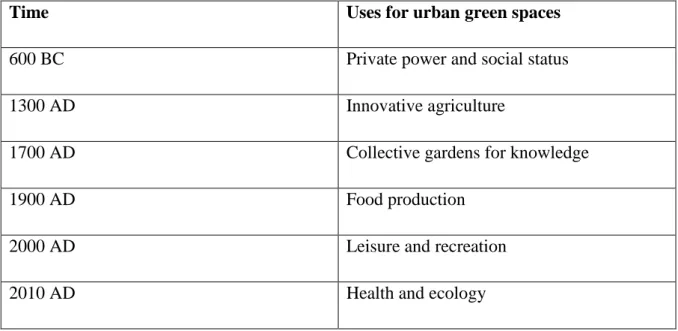
Today urban green spaces are recognised as common features of urban ecosystems (Gairola and Noresah, 2010). Scholars have argued that the integration of urban green spaces into urban landscapes can play a major role in urban sustainability, because urban residents can obtain various benefits (Gairola and Noresah, 2010) and improve living conditions (Mensah, 2014a). This relationship is optimised when urban green spaces distribution and nature are designed to meet the needs of local residents and users (Jim, 2006). This is particularly important as the underlying needs and motivations for urban green evolve through time (Table 2.1). Additionally, these needs may be spatially variable, with different needs in different parts of the cities as expressed through resident desires.
Table 2.1 Uses for urban greenspaces through history (van Leeuwen et al, 2010: 21)
Time Uses for urban green spaces
600 BC Private power and social status
1300 AD Innovative agriculture
1700 AD Collective gardens for knowledge
1900 AD Food production
2000 AD Leisure and recreation
2010 AD Health and ecology
2.4. Classification of urban green spaces
The classification systems of urban green spaces have become increasingly important when evaluating and managing urban green space systems (van Leeuwen et al., 2010). A classification of urban green spaces helps urban planners and policy makers to understand
13
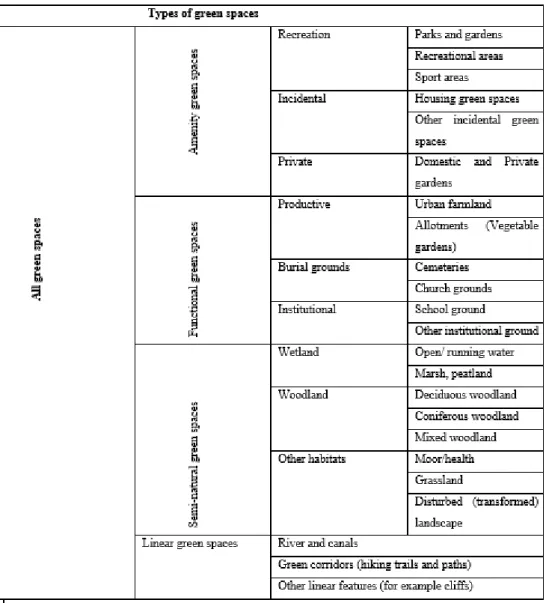
and recognise various services and functions that different green spaces provide (Rakhshandehroo and Yusof, 2014), emphasising the their multi functionality, which is a cornerstone of the urban green infrastructure concept (Hansen and Pauleit, 2014). Different factors such as location, usage, size, and composition of biodiversity, historical origin, intended functions and other characteristics play a major role in classification of urban green spaces (van Leeuwen et al, 2010). Rakhshandehroo and Yusof (2014) point out that benefit derived from ecosystem services need to be represented in an effective typology. Swanwick et al. (2003) proposed a classification of the different green spaces that may be found in an urban area (Table 2.2). Different types of urban green spaces fulfil different functions of urban resident’s needs. As noted by Swanwick et al. (2003) that an urban area with various green spaces indicates healthy environments for residents and wildlife.
14
Table 2.2: Types of urban green spaces (Source: Swanwick et al., 2003).
Bell et al (2007) expanded the typology with nine types of green spaces in the United Kingdom. This classification was developed with the need of community (Table 2.3)
15
Table 1.3: A comprehensive typology that was developed in the United Kingdom to classify urban green spaces (Source: Bell et al., 2007)
Primary search level Secondary search level
Parks and gardens All parks and gardens: urban parks and gardens, private gardens, country parks
Natural and semi-natural spaces All natural and semi-natural spaces: water and wetlands, woodland, remnant, vacant land and green belts and wedges post-industrial land Green corridors All green corridors: tree belts and woodland,
linear green spaces, canal and riverbanks, disused railways
Outdoor sports facilities All outdoor sports facilities: school playing fields, other playing fields and pitches, other sports
Amenity green spaces All amenity green spaces: housing green space, informal recreation areas, other amenity green space
Provision for children and young people All provision for children and young people;
children’s play facilities for special activities such as skateboarding, facilities for young people
Allotments, community gardens and urban farms
All allotments, community gardens and urban farms: allotments, community gardens, city farms, urban agriculture
Cemeteries, disused churchyards and other burial grounds
All cemeteries, disused churchyards and other burial grounds
16
Public space All public space: streets, residential roads, civic squares, seafronts and promenades, market places, shopping precincts, settings for public heritage buildings, other hard surfaced places
2.5. Benefits of urban green spaces
Different scholars have shown that urban green spaces provide many benefits to human well- being. For example, Wolf (2004) mentions that understandings of urban green space benefits need to include social, economic and environmental benefits. Schipperijn (2010) used a model to categorise the benefits of urban green spaces (Figure 2.1). The bottom section of the model indicates the elements that affect the use of urban green spaces and user (individual elements such as gender, age and preferences) while urban green space characteristics relate at features such as size and distance to urban green space. The middle section of the model indicates what can be found in the urban green spaces (UGS) and different activities that can take place. The top section of the model indicates different benefits that urban green spaces provide.
17
Figure 2.1: A model for the benefits of urban green space. Source: Schipperijn (2010).
2.5.1 Social benefits
Social benefits are the intangible and tangible benefits that humans obtain from contact with nature (Comber et al., 2008). Urban green spaces can promote social cohesion (Wolch, 2014), for instance, research carried out in five urban parks in The Netherlands revealed that people use urban green spaces for social interactions (Peter et al., 2010). Urban residents use urban green spaces for recreational purposes; for example, Haq (2011) revealed that 97% of urban residents in Helsinki were using urban green spaces for recreational activities in Finland.
Cocks et al. (2012) revealed that Xhosa women go in groups to collect firewood in urban green spaces such as commonages and they use it as a chance to talk to each other. It is further mentioned by Roy et al. (2012) that urban green spaces can be used to teach children about nature and urban residents view trees for learning and child’s play (Shackleton et al., 2015). Okunlola (2013) argues that informal education (family visits to urban green spaces) and formal education (school fieldtrips) are common in urban green spaces. In South Africa botanical gardens are used for educational purposes such as greening of school projects (Ward et al., 2010). Urban green spaces make the environment to be attractive which increases satisfaction and work performance (Sanesi and Chiarello, 2006).
2.5.2 Cultural benefits
Urban green spaces also represent important places for certain cultural and religious practices (Ormsby and Bhagwat, 2010). In the Western Ghats region, southern India, sacred urban forests are used for ceremonies and religious practices (Ormsby and Bhagwat, 2010). In South Africa, many amaXhosa believe that certain animals convey messages from the ancestors and some of these animals can be found in urban green spaces areas (Cocks et al., 2012). Medicinal plants that are used during rituals can be found in urban green space (Cocks et al., 2012). During traditional ceremonies firewood can be collected from urban green spaces and used for cooking (Cocks et al., 2012); for example, wood from Ptaeroxylon obliquum and Olea europaea subsp. africana are used as plates for sacrificed animal carcasses during traditional ceremonies in the Eastern Cape (Cocks and Wiersum, 2003).
Tyrväinen et al. (2005) mentioned that trees in the urban green spaces have cultural meanings to individuals and communities. For instance, in Tzaneen (South Africa) trees are preserved for cultural heritage (Shackleton et al., 2015).
18 2.5.3. Health benefits
Health is another important component of peoples’ quality of life (QOL) in many countries (Lora, 2008). Urban green spaces provide health benefits (Wolch, 2014). For example, Nufu (1999) in Tyrväinen et al. (2005) noted that sitting under a tree can reduce ultraviolent light which helps to reduce skin cancer. According to the Institute of Public Health (2006) urban residents who do not have access to urban green spaces have a higher risk of obesity and chronic diseases. Maas et al. (2006) showed that 90% of urban residents living near urban green spaces in The Netherlands were healthy and 84.5% of urban residents who were living far from urban green spaces were unhealthy. These results corroborate Tyrväinen et al.
(2005) who revealed that many people use urban green spaces to exercise. Hospital patients who have window views of urban green space recover faster and use less medication than those who have windows overlooking buildings (Wolf, 2004). Kuo and Taylor (2004) showed that urban green space can reduce Attention-deficit/hyperactivity disorder (ADHD).
The symptoms of ADHD were reduced in children exposed to nature while children who remained indoors ADHD symptoms remained constant (Kuo and Tylor, 2004). It is frequently argued that people need nature to meet emotional, spiritual and psychological needs (Roy et al., 2012). In addition, medicinal plants that are obtained from urban green spaces can be used for livestock treatment and self-medication (Cocks and Wiersum, 2003).
2.5.4. Economic benefits
The economic benefits of urban green spaces include tangible and intangible benefits (Tyrväinen et al., 2005). Urban green spaces can attract tourists to visit and increase the economy of surrounding areas (Roy et al., 2012). For instance, Nicolae Romanescue Park in Romania is an example of a tourism destination (Cianga, 2013). Tourists can come for historic and aesthetic visits (Cianga, 2013). In West Africa raw materials can be collected by local people to make handcrafts and some of handcrafts are sold in tourism destinations (Mpofu, 2013). Firewood and wild fruits may be collected and sold to other areas (Shackleton et al., 2015). For example, in the poorer suburbs of South African towns the collection and use of wood and fruits from urban greens spaces saves household considerable sums of money (Kaoma and Shackleton, 2014).
19
The findings of Tyrväinen et al. (2005) about urban residents who used urban green spaces for exercise can be linked with the findings of Wolf (2004) who mentioned that people who exercise usually spend less money on medical expenses. The presence of urban green spaces can reduce pollutants that enter rivers, streams and coastal waters and therefore decrease the costs of water purification (Duncan, 2012). Heinze (2011) revealed that approximately $22 million per year would be spent on medical expenses, sick leave and investigation of the contamination if urban green spaces do not exist. Haq (2011) revealed that in Chicago the total energy for heating and cooling was reduced by 5-10% in the city by urban green spaces.
Property values near urban green spaces are frequently higher than properties further away, which results in higher levies and taxes paid to urban authorities (Haq, 2011). In Guangzhou (China) investors and residents were most interested in buying houses that have a view of urban green space (Jim et al., 2006).
2.5.5. Environmental benefits
Environmental benefits are the ecological services provided by urban green spaces to urban residents (Wolf, 2004). For example, most towns and cities are characterised by environmental pollution (Fuwape and Onyekwelu, 2011). Vegetation in the urban green space can improve air quality by absorbing pollutants and carbon dioxide and releasing oxygen (Mpofu, 2013). Heinze (2011) noted that in the United States oxygen produced by an 18-hole golf course can support 4 000-7 000 people. Trees can reduce air pollution by absorbing dangerous pollutants through their stomata (Tyrväinen et al., 2005). According to Heinze (2011) approximately 12 million tons of dust, soil and particulate matter can be trapped and purified annually in a well maintained green space. Urban green spaces play a crucial role in water purification by trapping and removing pollutants (Heinze, 2011).
Vegetation roots and soil microbes capture and breakdown pollutants (Heinze, 2011).
Urban green spaces have the potential to mitigate urban floods by balancing water flow (Demuzere et al., 2014). For example, well-drained urban green spaces allow water to infiltrate into the soil and reduce the speed of water run-off (Mpofu, 2013). In Beijing (China), Zhang et al. (2012) used rainwater runoff coefficients and economic evaluation methods to assess the role of urban green spaces in reducing rainwater runoff. They found that urban green spaces can store 154 million cubic metres and 2 494 cubic metres of runoff was reduced per hectare of green space. Heinze (2011) mentions that urban green spaces play
20
a major role in protecting and stabilizing soil against water and wind erosion. The presence of forest cover on a steep slope in West Africa prevented development of gully erosion (Fuwape and Onyekwelu, 2011). Such protection is especially important in risk prone areas characterised by steep slopes and shallow soils, as the vegetation reduces the threat of mudslides which could impact local houses and significant financial losses (Dalu et al., 2018). In addition, urban green spaces are habitat for animals such as birds, bats, rodents, lizards, amphibians and invertebrates (Roy et al., 2012).
Urban green spaces can reduce the heat of urban areas and give shade to urban residents (Demuzere et al., 2014). Vegetation reduces temperatures by the process of transpiration and the moister soils under the canopy of trees (Tyrväinen et al., 2005). Tzaneen and Bela urban residents who were living in RDP houses and informal settlements mentioned that trees reduced temperature by providing shade (Shackleton et al., 2015). In Bulawayo, Zimbabwe, Ngulani (2017) found that the midday temperatures in green spaces were up to 6.1 °C cooler than surrounding built up area, and that the cooling effects extended up to 1.7 km beyond the green space. Greens spaces and vegetated linear features serve as a wind break and noise buffer (Mullaney et al., 2015).
2.6. Disadvantages of urban green spaces
Although there is considerable literature on the benefits of urban green spaces in breaking down social barriers, there is also some that indicates that urban green spaces can act as a boundary by separating neighbours from each other (Roy et al., 2012). Additionally perceptions of higher crime rates in densely vegetated area is a pervasive fear throughout the world (Roy et al., 2012), even if empirical studies show that green spaces and vegetation are not riskier areas than built up areas of cities, and some suggests they are safer area (Bogar and Beyer, 2015). In Tzaneen and Bela Bela in Limpopo Province participants felt that urban green spaces are not safe (Shackleton et al., 2015). Mpofu (2013) adds that drug dealers and other crimes may take place in these green areas, especially those which are not well maintained. Another disadvantage of green spaces is that some trees are associated with diseases and allergies, which cause discomfort to some urban residents and may result in costs for such individuals to get treatment (Roy et al., 2012). For instance, people with allergies can be affected with wind pollinated plants (Lyytimaki and Sipila, 2009). One of the most common concerns with green spaces and trees in urban environments is the leaves and
21
other debris that fall on or are blown into streets and then into runoff gutters where they may accumulate and cause blockages leading to flooding during heavy rains (Keatomh, 2014) Thus, city authorities must pay for the regular clearance of such debris. Larger debris may cause damage to vehicles or infrastructure when it falls. Intact vegetation may also be a problem when it blocks signs or interferes with overhead or underground wires and pipelines
2.7. Challenges facing urban green spaces
Management and conservation of urban green spaces face major challenges (Mensah, 2014).
As mentioned above, rapid urbanisation is one of the major threats to urban green spaces (Cobbinnah and Darkwah, 2016), as existing green spaces are taken over to provide housing and other developments. This may be through formal rezoning by urban authorities, or it might be through development of informal housing and shelters in vacant areas by new urban migrants. For instance, people may build in sensitive areas such as riversides, swamps, steep mountains and other sensitive areas (Cobbinnah and Darkwah, 2016). Mpofu (2013) noted that rapid urbanisation in Addis-Ababa (Ethopia) depleted urban green spaces.
In many areas green spaces and urban trees have not been prioritised in the development plans, budgets and programs of towns and cities (Mensah, 2014, Chishaleshale et al., 2015).
For example, in many developing countries there is lack of political will, skilled employees and funding which limit the development and maintenance of urban green spaces (Mpofu, 2013; Chishaleshale et al., 2015). Gwedla and Shackleton (2015) mention that some municipalities, especially in small towns, do not have enough funds for maintenance. For example, in the 2012 financial year one Eastern Cape municipality allocated only R21 000 to parks, green spaces and cemetery department (Gwedla and Shackleton, 2015). Gwedla and Shackleton (2015) revealed that some of municipal officials do not have the necessary qualifications and experience to allow them to perform their duties (Gwedla and Shackleton, 2015) with respect to green space planning and maintenance.
Urban poverty can be a major challenge to urban green spaces in some regions, especially in Africa (Mensah, 2014). Poor urban residents may target green spaces for building houses and to collect firewood and edible species from urban green spaces and also medical plants for selling (Mensah, 2014). In themselves these activities may not necessarily be detrimental to
22
green space integrity and function, but if the number of people seeking such provisioning uses is high relative to the area of green spaces available, then the structure and integrity may be vastly altered and comprise other benefits such as biodiversity and recreational uses. Often linked to poverty is the issue of urban green spaces may not be accessible to all residents as there are frequently inequalities (Kuta et al., 2014). As the unemployed and the poor usually have time but lack the financial means to access these facilities as compared to the those that are financially rich but do not have the time to access these facilities (Lloyd and Auld, 2003).
As an extreme, civil strife is another problem that may affect greens spaces in some regions (Mensah, 2014a). For example, the civil war that took place in 1988-1990 and civil strife (1994-1997) destroyed urban green spaces in Somalia (Candle for Health, Education and Environment, 2006).
2.8. Policies, enforcement and governance of urban green space
In most societies social ills are addressed by legislation, this being a plethora of documents ranging from policies and bills to acts. With regards to the present study, it is important to highlight some of the relevant environmental legislation and policies that influence urban green space provision and planning in South Africa. Section 24 of the Constitution (No. 108 of 1996) advocates for human rights and section 25 for the protection of the environment in which residents of South Africa live and their responsibility to conserve it as it directly and indirectly affects human well-being (South Africa, 1996). Although historically neglected, there is a growing collection of regulations, policies and other legislation which are a guideline for the sustainable use of environmental resources and sustainable environmental management, capturing all areas of significance in the environment- particularly those pertaining to resources vital for human life (DEAT, 2006; Ruwanza and Shackleton, 2016).
Institutions such as local government, private sector, sport, health and education play a major role in shaping urban green space policies and practices. The South African Constitution, the National Environmental Management Act (NEMA), the Environment Conservation Act (ECA) and the Integrated Development Planning processes play a major role in governing urban green spaces.
The South African Constitution (No. 108 of 1996) serves as the primary legislation informing the legal framework, section 24 stipulates that all citizens have a right to an environment that
23
will pose no harm to their health and welfare. Another important piece of legislation is the National Environmental Management Act (NEMA) (No. 107 0f 1998) (South Africa, 1996).
NEMA was implemented in 1998 to support and ensure that environment is incorporated.
Additional policies and legislations are enacted at the provincial and local levels (Chishaleshale 2013). However, there is very varied knowledge about and implementation of the relevant legislation, policies and bylaws by local municipal officials (Chishaleshale et al., 2015; Gwedla and Shackleton, 2015).
2.9. Urban planning in South Africa
Todes et al. (2014) commented that the increase in urbanisation has placed pressure on urban planners and developers to find solutions to reduce in the attendant challenges of poverty, social segregation, unemployment, insufficient shelter and pollution (Fuwape and Onyekwelu, 2011). UN-Habitat (2008) noted that in Africa between 1990 and 2000 informal settlements increased by 4.5%, and that poverty and environmental degradation are more prevalent in low income residential areas (UN-Habitat, 2009), in contrast to high income residential areas (Benton-Short and Short, 2008). The rate of population growth in urban areas in many regions has exceeded the ability to create jobs (UN-Habitat, 2015) and pollution can be seen as a significant challenge in low income urban areas because many are often close to industries (UN-Habitat, 2009).
The new democratically elected South African government has promised a better life for all after the 1994 political transition (Møller, 2007). The new government devised policies and strategies to ensure that all South Africans have more opportunities and to close the economic gap among different race groups by empowering them and improving the delivery of basic services to all (Tissington, 2010). The African National Congress government introduced the Reconstruction and Development Programme (RDP) (Huchzermeyer, 2001). The aim of the RDP was to address the social injustices of the apartheid era (Tissington, 2010).
Huchzermeyer (2001) highlights that the RDP emphasises that housing is a human right for everyone, especially poor communities. The housing policy was supported by the South African constitution which highlights that every citizen has the right to live in a place that is safe and decent (Huchzermeyer, 2001; Tissington, 2010). Almost two million of South Africans were supplied with electricity in the first decade, and three and a half million were supplied with water (Møller, 2001). Yet, the rapid growth of urban centres has challenged
24
the South African government to build more houses and associated infrastructure, but progress has been constrained by a lack of funds (Turok, 2010).
In addressing the injustice of apartheid planning, South Africa’s democratic government devised policies to promote development of urban areas (Tissington, 2016). Nel (2016) mentions that these policies include the development facilitation act (63 of 1997) and the urban development framework and the current planning act known as the spatial planning and land use management act (SPLUMA, 16 of 2013). Nel (2016) points out that community participation, equity and sustainable development are the main pillars of SPLUMA (Nel, 2016). The SPLUMA works together with municipal bylaws and provincial legalisations (Department of Rural Development and Land Reform, 2012). The SPLUMA is given effect through the Integrated Development Planning processes which each local municipality must conduct every five years and which are founded on community consultation and participation (Atkinson, 2002; Todes, 2004). This also includes public approval of spatial planning, which includes green spaces.
Spatial planning, land use management and policy can be combined in the spatial planning system in government (Nel, 2016). However, many municipalities still rely on using bylaws because they strongly believe that they are suitable for their municipalities (Department of Rural Development and Land Reform, 2013). Nel (2016) mentions that SPLUMA tries to address spatial inequalities by including low income residential areas. However, it is difficult to use land in informal settlements because in most cases land ownership of these areas is not clear or registered (Department of Rural Development and Land Reform, 2013).
In addition, urban planning depends on land use (Department of Rural Development and Land Reform, 2012). Land use can be defined as the land cover (mountains, vegetation, forestry, and rivers) changes resulting from human activities (Kumar, 2009). Land cover changes play a major role in how ecosystem goods and services are generated and used (Leper et al., 2005). Land use patterns can be seen as an indicator of how humans associate and use natural resources in particular areas and can indicate the likely state of the area for future developments (Benton-Short and Short 2008; Kumar, 2009). Booth (2009) adds that changes in natural land cover to built environments can affect services that are provided by urban ecosystems and green infrastructure. Human population growth is the main driver of land use change in urban areas (Booth, 2009), and much land use change contributes to
25
climate change, biodiversity loss and sedimentation water of bodies. These environmental issues can have negative impacts on human well-being in urban areas (Kumar, 2009).
Not only are SPLUMA and land use important to urban planning but also cultural needs should be considered (Sirayi, 2008). Cultural planning can be described as the planning that looks at history, sense of place, community relationships, identity and common memories (Saco et al., 2009). Cultural planning can play a major role in community development and form a positive relationship between developers and communities (La Rosa et al., 2009).
Sirayi (2008) states that cultural planning helps municipalities to address racism, social exclusion, xenophobia and cultural identity
26
CHAPTER 3: STUDY SITES AND RESEARCH METHODS
3.1. Introduction
In this chapter the study sites and research methodology that were employed to execute the research are described. Different methods are separated into themes to help address the research objectives. The chapter is divided into five sections namely study sites, research approach, research design, ethical considerations and data analysis.
3.2. Background and geographical settings of the Eastern Cape
The study towns are all located in the Eastern Cape province of South Africa. It shares borders with KwaZulu-Natal, Free-State, Western Cape, Northern Cape, Lesotho and the Indian Ocean (Department of Economic Affairs, Environment and Tourism, 2004). It is the second largest province in South Africa with an area of 169 580 km², representing 13.8% of South Africa’s total land area (Department of Economic Affairs, Environment and Tourism, 2004).
The population of the Eastern Cape is approximately 6.9 million, representing 14 % of the total South African population, making the region the third most populous province in South Africa (Statistics South Africa, 2016). According to Census 2011 approximately 40% of the population live in urban areas (Statistics South Africa, 2011). The Census 2011 data reported dominant population groups in the region as black Africans (86.3%), Coloureds (8.3%), Whites (4.7%) and Indians/Asians (0.4%) and other 0.3% (Statistics South Africa, 2011). The Eastern Cape is dominated by Xhosa speaking people (Eastern Cape provincial government, 2012). Statistics South Africa (2016) reported that the number of households in the Eastern Cape have increased from 1.3 million in 1996 to 1.8 million in 2015 of which about 386 802 are low cost government subsidised houses, locally known as RDP houses, after the Reconstruction and Development Programme which saw the building of millions of low costs homes nationwide.
The province remains one of the poorest provinces in South Africa (Statistics South Africa, 2016). Based on the Census 2011 the poverty percentage was 60.8%. (Statistics South Africa, 2011). The main sources of income are crop production, livestock, agro-industries, migrant labour and eco-tourism (Department of Economic Affairs, Environment and Tourism, 2004).
27
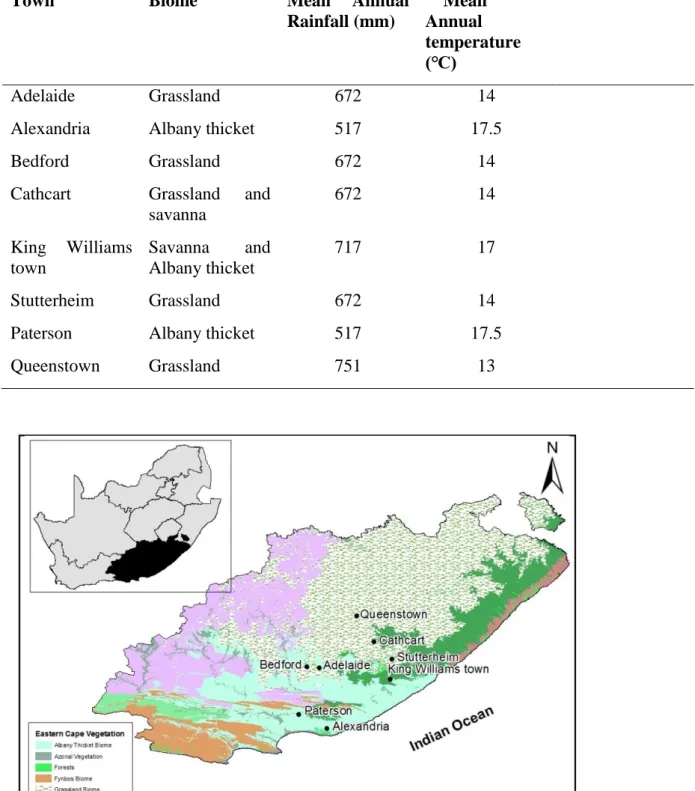
In addition, social grants received by the elderly, retired civil servants, disabled and children play a major role is supporting people (Department of Economic Affairs, Environment and Tourism, 2004). Eight study towns were selected, four towns with a relatively rapid population growth rate over the last decade, namely Alexandria, King Williams towns, Queenstown and Paterson, and four towns with a relatively low annual growth rate, i.e.
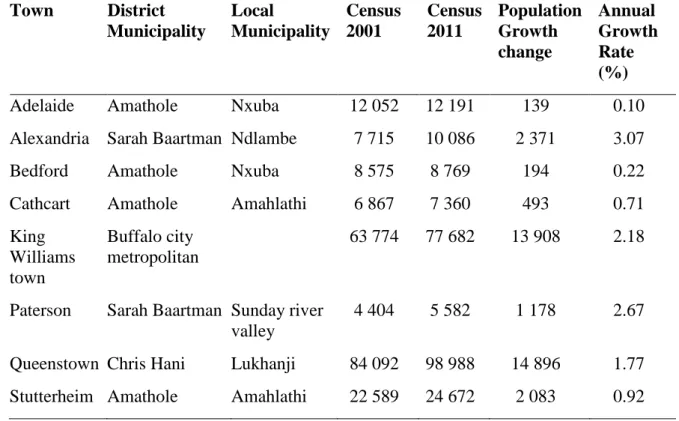
Adelaide, Bedford, Stutterheim and Cathcart. Due to time constrains, King Williams town, Stutterheim and Queenstown were selected to unpack social perspectives of the study. The selection of these study towns was based on the population growth and annual percentage growth rates. For further details, refer to Table 3.1 and Figure 3.1 that shows the location of selected study towns.
Table 2.1: Population growth in study towns (source: City Populations Database, 2016).
Town District Municipality
Local
Municipality
Census 2001
Census 2011
Population Growth change
Annual Growth Rate (%)
Adelaide Amathole Nxuba 12 052 12 191 139 0.10
Alexandria Sarah Baartman Ndlambe 7 715 10 086 2 371 3.07
Bedford Amathole Nxuba 8 575 8 769 194 0.22
Cathcart Amathole Amahlathi 6 867 7 360 493 0.71
King Williams town
Buffalo city metropolitan
63 774 77 682 13 908 2.18
Paterson Sarah Baartman Sunday river valley
4 404 5 582 1 178 2.67
Queenstown Chris Hani Lukhanji 84 092 98 988 14 896 1.77 Stutterheim Amathole Amahlathi 22 589 24 672 2 083 0.92
28 Figure 3.1: Location of the selected study towns.
3.3. Climate and vegetation
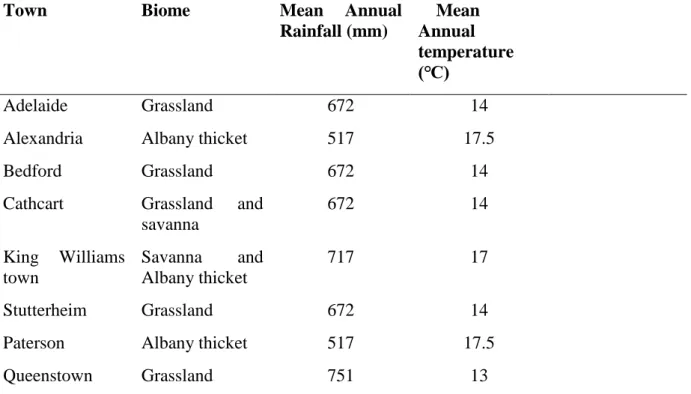
With regard to urban green spaces rainfall and temperature are the two of the most important climatic elements. In the Eastern Cape, the average annual rainfall has been declining while the average annual temperature is increasing, presumably as a result of global climate change (Department of Economic Affairs, Environmental and Tourism, 2004). The climate varies from mild temperature conditions of 14 ℃ to 23 ℃ along the coastal areas to slightly more extreme conditions of 5 ℃ to 35 ℃ among the inland areas (Department of Economic Affairs, Environmental and Tourism, 2004). The western arid areas receive an annual rainfall of 200-300 mm per annum while the eastern regions receives 400-800 mm, with most of rainfall received in summer (except in the west, winters are largely cool and dry ith some snow mainly on the highlands and mountain ranges (Chris Hani municipality IDP, 2012). The vegetation of the Eastern Cape consists of several types in line with the varied climate and geology (Mucina and Rutherford, 2006). The study towns are distributed amongst the Grassland, Savanna and Albany thicket biomes. Refer to Table 3.2 for further details about vegetation, altitude, mean annual rainfall and temperature of selected study towns and Figure 3.2 shows the distribution of biomes in the Eastern Cape.
29
Table 3.2: Summary of vegetation, altitude, mean annual rainfall and temperature
Town Biome Mean Annual
Rainfall (mm)
Mean Annual temperature (℃)
Adelaide Grassland 672 14
Alexandria Albany thicket 517 17.5
Bedford Grassland 672 14
Cathcart Grassland and savanna
672 14
King Williams town
Savanna and Albany thicket
717 17
Stutterheim Grassland 672 14
Paterson Albany thicket 517 17.5
Queenstown Grassland 751 13
Figure 3.2: The biomes of the Eastern Cape
30 3.4. Methodology
3.4.1. Research approach
The research used a mixed methods approach. It involves philosophical assumptions in combining both qualitative and quantitative approaches (Johnson and Onweugbuzie, 2007). It is more than simply collecting and analysing qualitative and quantitative data but it also allows the researcher to draw from the strengths of both methods (Creswell, 2014).
According to de Silva (2010) mixed method research is used to answer research questions that other methodologies cannot answer. In addition, mixed research methods produce a more comprehensive analysis than from one method alone (de Silva, 2010). Different methods allowed the researcher to understand different levels of reality for instance, the quantitative methods allowed for a broader understanding of features of urban green space such as patterns of usage, general perceptions and relationship between broader samples, while qualitative methods allowed for an exploration of people’s preferences of green spaces and why they feel they use particular urban green spaces.
Mixed methods also allowed for triangulation, triangulation refers to the combination of two or more data sources, theories or methods in a single study of a particular phenomenon with the intentions of gathering diverse perceptions or points of view on a common issue or question (Yeasmin and Rahman, 2012). The triangulation principle involves minimising the insufficiencies of single-source research (Hussein, 2009). Two sources potentially complement and verify one another. Triangulation reduces the possibility and impact of bias (Yeasmin and Rahman, 2012). Triangulated methods and perspectives are important in cross- checking and in offering verification and wholeness, which grants equilibrium between two or more different of approaches (Yeasmin and Rahman, 2012).
There are different types of triangulation but the study employed specifically methodologic triangulation. Methodologic triangulation can be regarded as either data collection methods or research designs in which the two or more methods are used in studying the topic (Hussein, 2009; Thurmond, 2001). By employing different methods, the researcher attempted to limit deficiencies and biases that may result when using a single method thereby, generating the opportunity for counterbalancing any limitation of a single method with the power of another one (Thurmond, 2001). Methodological triangulation can be further divided into two types which are within-method triangulation and between-method triangulation. Within-method triangulation includes cross-checking of information for internal reliability (Hussein, 2009).
This method requires using numerous corresponding methods within a specific paradigm in