A Review of Literature
Introduction
Drought stress can be classified in the context of meteorological, hydrological or agricultural drought stress (Araus et al., 2002). Morphological, molecular, biochemical and physiological markers are important parameters for selection of drought tolerant genotypes (Araus et al., 2002).
The taxonomy and botany of bread wheat
Similarly, selected phenotypic and drought-adaptive traits well correlated with grain yield and suitable for phenotype are important attributes in differentiating genotypes in different populations evaluated in different test environments (Abdolshahi et al., 2015). Integration of molecular and phenotypic markers improves selection accuracy and increases the rate of genetic gain for yield and yield components (Mir et al., 2012; Abdolshahi et al., 2015).
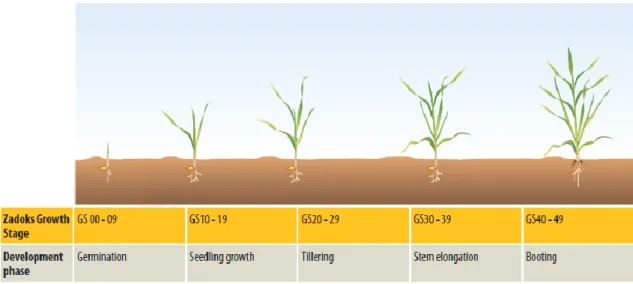
Classification of the cereal growth stages
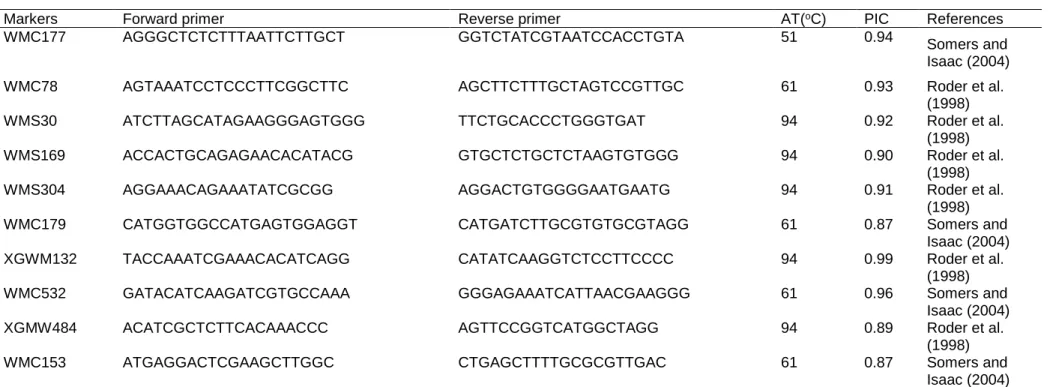
Among the molecular markers, SSRs provide a convenient, efficient and accurate method to investigate genetic diversity and understanding of population stratification and discovery of potential parents for engineered crosses (Korzun, 2003).
Demand and production of bread wheat
The Western Cape, Northern Cape and Free State are the major wheat producing regions in South Africa (DAFF, 2014). The wheat protein gluten makes the wheat grain valuable to the bread-making industry (Sleper and Poehlman, 2006).
Drought stress in the context of plant breeding
Importance, benefits and complications of exploiting genetic diversity
A limitation associated with the genetic analysis of bread wheat is its large hexaploid genome (Brenchley et al., 2012). Thus, highly polymorphic molecular markers that are widely distributed within the wheat genome are effective for genetic analysis of bread wheat (Mir et al., 2012; Nielsen et al., 2014).
Molecular markers as a tool for cereal genotyping
Analysis of genetic diversity and population structure
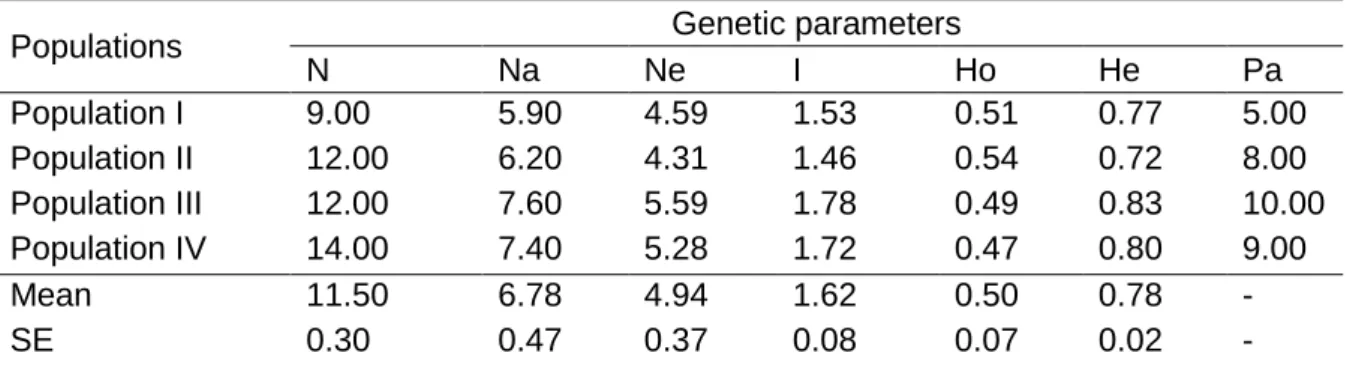
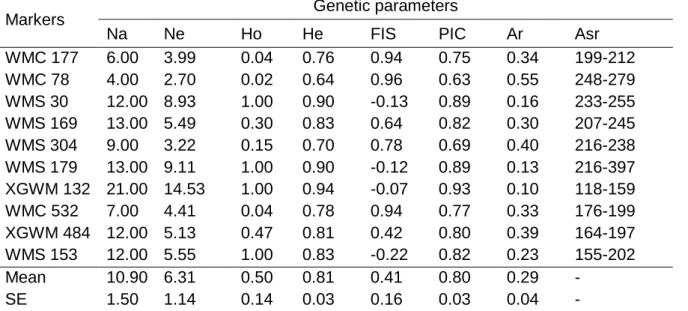
According to Salem et al. 2015), a positive linear relationship is shared between the genetic diversity and the number of alleles per locus. In one study, the average number of alleles detected was 5.59 alleles per locus, while the average polymorphic information content (PIC) was 0.65 (Salem et al., 2015).
Overcoming drought phenotyping constraints through use of secondary traits
- Physiological parameters
- Morphological parameters
The stomatal conductance and canopy temperature serve as indicator traits for genotype photosynthetic capacity as reported by Villegas et al. Monitoring of photosynthesis, especially in the reproductive stage, is essential for the accumulation of economically beneficial yield (Farooq et al., 2014).
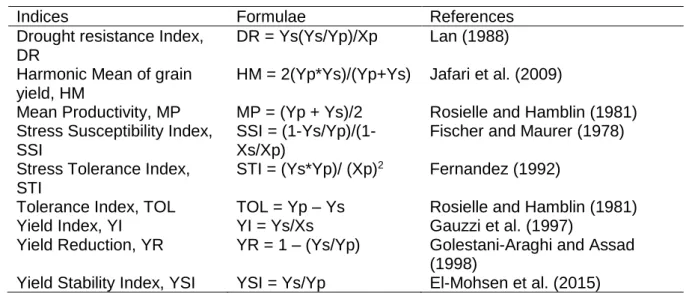
Selection indices for drought tolerance
- Harmonic Mean and Stress Tolerance Indices
- Drought Resistance and Yield Indices
- Stress Susceptibility and Tolerance Indices
- Yield Stability, Yield Reduction Indices and Mean Productivity
- Ranking of genotypes using selection indices
Selection for TOL under drought stress resulted in reduced grain yield under non-stress (Dodig et al., 2012). A probably weak correlation between the seed yield under drought stress and non-stress was reported by El-Mohsen et al.
Conclusions and future prospects
The rank mean, standard deviation of the ranks, and the rank sum were used for ranking genotypes by El-Mohsen et al. Where genotypes with low values for rank mean and rank sum scored higher, while a low value for rank standard deviation meant a stable rank for several drought tolerance indicators. The standard deviation of ranks and rank sum are given in formula a) and b), respectively. a) Standard deviation of ranks = ∑mi=1(Row-Ri mean).
The highest PIC value was for marker XGWM132 with a value of 0.93, while the mean PIC was 0.80. The frequency of private alleles ranged from 0.036 to 0.289, whereas the average number of private alleles recorded was 10 among the populations tested. The average detected heterozygosity was 0.5. The expected heterozygosity was quite high with an average of 0.81, while the lowest and highest detected values were 0.64 for marker WMC78 and 0.94 for marker XGWM132. Genotypes with superior seed yield under non-stress and drought stress conditions are preferred for their yield stability (Dodig et al., 2012; Cabello et al., 2013).
Genetic characterisation of selected bread wheat (Triticum
Introduction
In wheat, which is predominantly an inbred crop, genetic diversity is strongly influenced by the exchange of seed from breeder to breeder and from farmer to farmer (Mashilo et al., 2016). Molecular markers are furthermore reliable due to their constant functionality independent of the immediate environment (Mashilo et al., 2016). In addition, molecular markers help to understand and evaluate genotype-phenotype relationships (Amelework et al., 2016).
Materials and methods
- Plant materials and study sites
- DNA extraction, purification and amplification
- Polymerase chain reaction and SSR analysis
- Data analysis
The tandem repeats are randomly distributed in the crop genome, and their distribution patterns and frequencies can be distinct within and between populations (Henry, 2001; Amelework et al., 2016). Integrations of genetic studies with rigorous, multi-locus phenotyping are informative, especially when phenotyping can be influenced by GxE (Chen et al., 2012). The hexaploid genome of bread wheat (Triticum aestivum L.; 2n=6x=42; AABBDD) may present a limitation for studies of genetic diversity and population structure (Wurschum et al., 2013; Mwadzingeni et al., 2015).
Results
- Polymorphism and allele diversity of the SSR markers
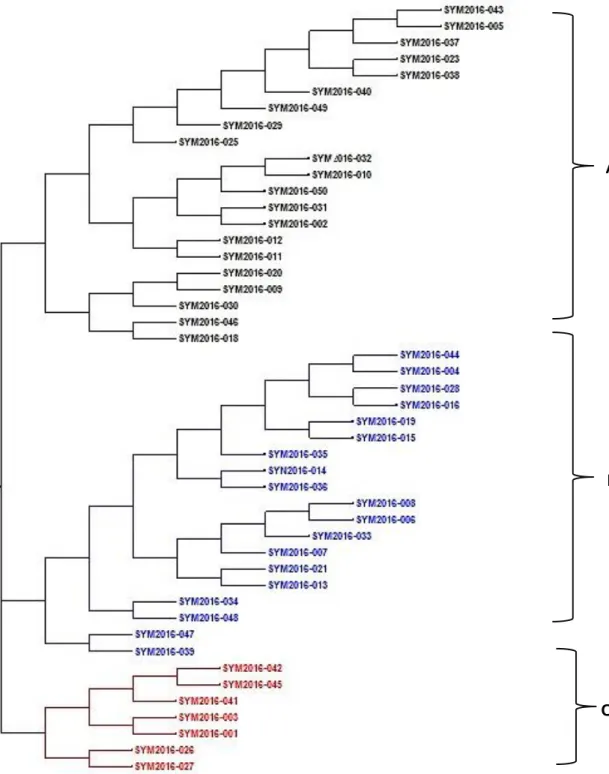
- Cluster analysis
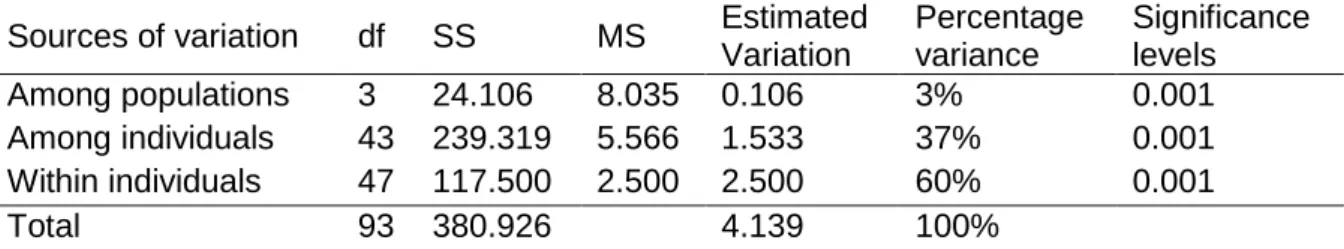
- Analysis of molecular variance (AMOVA)
A higher GI was also recorded between populations III and IV with a value of 0.99, while a relatively low GI value was recorded for the pairwise population comparison of populations II and III with a value of 0.74. The Nm values were the lowest and highest between Population II and III with a value of 4.7 and Population III and IV with a Nm value of 12.3, respectively. The results of the analysis of molecular variance for the 4 populations based on ancestry are presented in Table 2.6.
Discussion
- Selected accessions based on cluster analysis
- Genic distance and genetic diversity
- Loci polymorphism and effectiveness for genotype discrimination
2016) attributed the genetic diversity to the presence of private alleles at the different loci in a study of durum wheat. This shows a fairly low genetic diversity among the different wheat populations used in this study. This indicates the skill of the selected molecular markers to uniquely distinguish the different genotypes.
Conclusions
Drought tolerance indices are based on crop response under drought and non-stress conditions. PC and biplot analyzes revealed associations between HM, MP, STI, YI and yield under drought stress and no stress. The results of the correlation analysis of grain yield and 9 drought tolerance indices for 15 wheat genotypes evaluated in drought and non-stress conditions are presented in Table 4.6.
Phenotyping bread wheat (Triticum aestivum L.) genotypes for
Introduction
One of the most important constraints on wheat production nationally is climate variability, especially drought stress (Edossa et al., 2014). The growth stage of a crop and drought intensity determine the magnitude of yield loss associated with drought stress (Fleury et al., 2010). Physiological and morphological traits can be integrated for efficient phenotyping for better yield expression under drought (Araus et al., 2002; Lopes et al., 2012).
Materials and methods
- Plant material and study sites
- Experimental design and crop establishment
- Data collection and data analysis
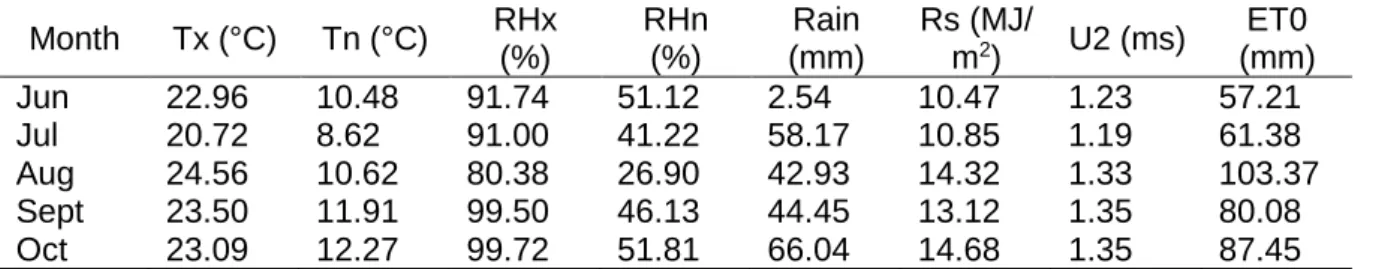
The total number of days of drought stress was 25, 24 for greenhouse conditions and 24 in the field, respectively. Morphological characteristics were evaluated: number of days to flowering (DF), number of days to maturity (DM), plant height in centimeters (PH), number of productive rosettes (PT) per plant, number of spikelets per spike (SS), number of grains per ear (KS), weight of 100 seeds in grams (SW) and yield per plot in grams per plot (GY). PT was recorded by counting the number of rosettes of each genotype for each water regime showing seeded spikes by maturity for all 3 replicates.
Results
- Significance tests
- Mean response of genotypes assessed using physiological traits
- Mean response of genotypes for morphological traits
- Correlation of physiological and morphological traits across
- Principal component analysis (PCA)
- Discussion
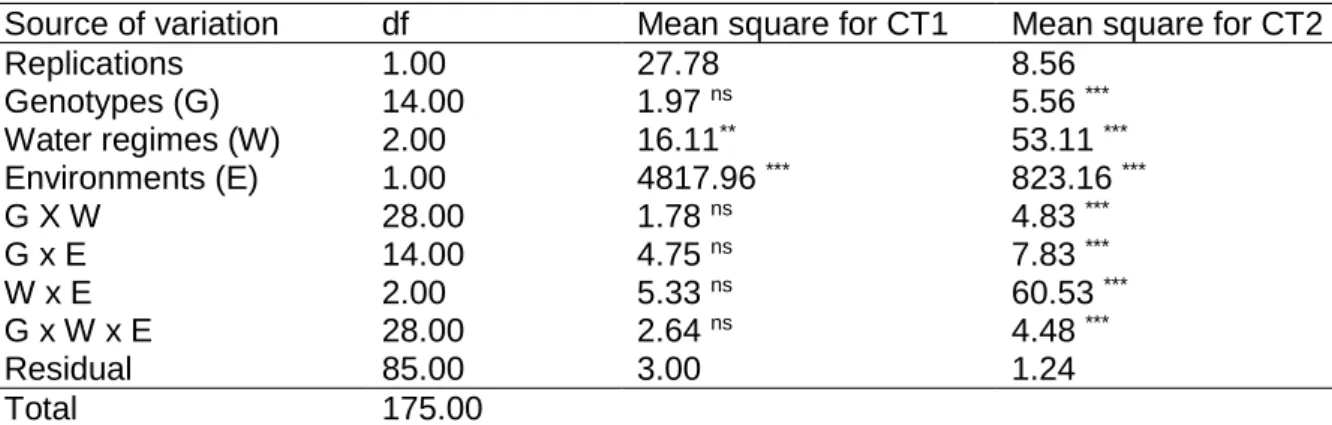
Key: DF - days to 50% flowering, DM - number of days to 50% maturity, PH - plant height in centimeters, PT - number of productive corms per plot, SS - number of ears per ear, KS - number of grains per ear, SW - mass of hundred seeds in grams, GY - yield per pot in grams per plot, WBH - water stress 1 week before 50% flowering, WAH - water stress 1 week after 50% flowering, ND - non-stress water regime, CV (%) - coefficient of variation, expressed as a percentage, l.s.d. - least significant difference at the level of probability P < 0.05. Key: SC - stomatal conductance in m.mol/m2s, CT1 and CT2 - canopy temperature in oC, measured 10 and 17 days after loading, DF - number of days to 50%. Genotype rankings were similar for days to flowering, days to maturity, plant height, number of spikelets per spike, seed weight and yield.
Conclusions
The aim of this study was to determine drought tolerance among 15 selected bread wheat genotypes using 9 drought tolerance indices. Drought tolerance indices associated with yield levels are important selection parameters in breeding wheat for drought tolerance (Cabello et al., 2013). Assessment of drought tolerance in selected bread wheat (Triticum aestivum L.) genotypes using drought tolerance indices.
Assessment of drought tolerance in selected bread wheat
Introduction
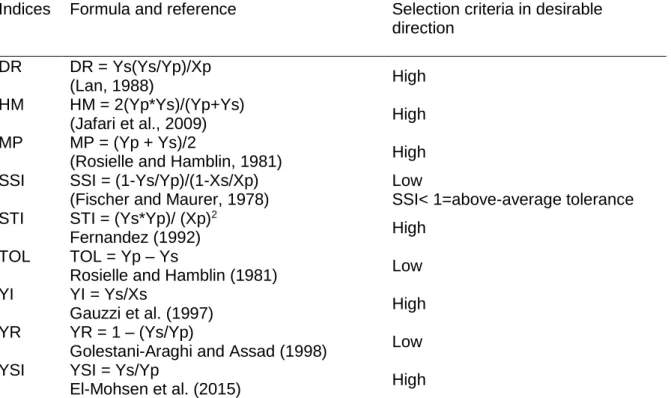
Water stress at flowering limits wheat yield, eventually leading to complete crop failure (Farooq et al., 2014). Therefore, genotypes with a value lower than the latter are considered stable yields expressing a value less than 1 (Ramirez and Kelly, 1998; Drikvank et al., 2012). Average productivity, stress tolerance index, yield stability index, and yield harmonic mean are known to discriminate Group A genotypes (Dodig et al., 2012; El-Rawy and Hassan, 2014).
Materials and methods
- Plant materials and study sites
- Experimental design and crop establishment
- Data collection and statistical analysis
Genotype ranking was performed using the Spearman ranking technique using the statistical software package GenStat Edition 18 ( Payne et al., 2015 ). All data were further subjected to Pearson's pairwise correlation coefficient analysis with a two-tailed test at the 5% probability level analyzed using the GenStat 18th edition statistical software package (Payne et al. , 2015). PC and biplot analyzes were performed using GenStat 18th Edition Statistical Software Package (Payne et al., 2015).
Results
- Significance tests
- Mean responses of genotypes for grain yield and drought indices
- Correlation among drought tolerance indices and grain yield
- Principal component analysis (PCA)
- Biplot analysis
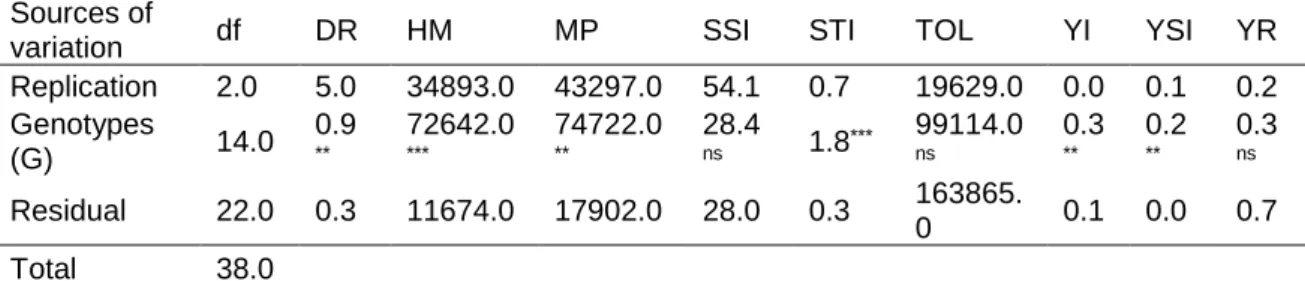
Key: DR - drought resistance index, HM - harmonic mean of yield, MP - average productivity, SSI - stress sensitivity index, STI - stress tolerance index, TOL - tolerance index, YI - yield stability index, YSI - yield stability index, YR - yield reduction, Yp - yield for each genotype under non-stress, Ys - yield for each genotype under drought stress, Yp- average grain yield of each genotype under non-stress, Ys- average grain yield of each genotype under stress, CV (%) - coefficient of variation expressed as a percentage, l.s.d. Key: DR - drought resistance index, HM - harmonic mean of yield, MP - average productivity, SSI - stress sensitivity index, STI - stress tolerance index, TOL - tolerance index, YI - yield stability index, YSI - yield stability index, YR - yield reduction, Yp - yield for each genotype under non-stress, Ys - yield for each genotype under drought stress, std dev-rank - standard deviation of rank. Key: DR - drought resistance index, HM - harmonic mean of yield, MP - average productivity, SSI - stress susceptibility index, STI - stress tolerance index, TOL - tolerance index, YI - yield stability index, YR - yield reduction, YSI - yield.
Discussion
- Comparison of the different drought tolerance indices
- Grain yield across water regimes
- Grain yield under non-stress
- Grain yield under drought stress
- Screening for drought tolerant and high yielding wheat genotypes
In contrast, a low PC2 was favorable to prevent the selection of high-yielding genotypes only in the non-stress condition, which compromised yield under stress. A low PC3 was considered beneficial in the current study to prevent the selection of genotypes with high yield under stress, but which provide poor yield under non-stress conditions. However, the findings of Jafari et al. 2009) contradict this finding, indicating that DR and SSI are suitable for selection of high seed yield under drought stress and without stress.
Conclusions
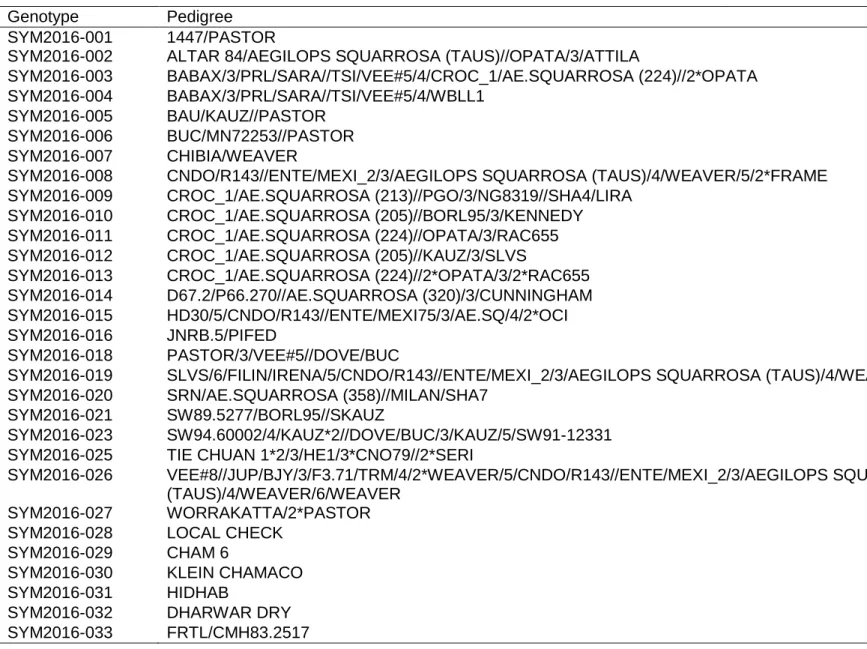
Screening criteria for drought tolerance in maize. 2012) Biplot analysis of drought tolerance markers in bread wheat landraces in Iran. 2016) Efficacy of selection indices in screening bread wheat lines combining drought tolerance and high yield potential. Phenotyping of bread wheat (Triticum aestivum L.) genotypes for drought tolerance Fifteen bread wheat genotypes selected through SSR markers were evaluated under field and greenhouse conditions using a randomized complete block design (RCBD) with 3 repetitions.