UNIVERSITY OF KWAZULU-NATAL
Facu[t~ of Engineering (Westvi[[e Campus)
Thesis Title:
A COMPARATIVE STUDY OF CONTACTING EQUIPMENT FOR THE RECOVERY OF COPPER
FROM A CUPRIC SULPHATE SOLUTION
Candidate:
Natisha Sukhraj
Submitted in Fulfilment ofthe Degree:
. Masters in Chemical Engineering
Supervisor:
Mr A.F.C Bassa
Date ofSubmission:
January 2005
Title Page
MASTERS
By
RESEARCHA Comparative Study of Contacting Equipment for the Recovery of Copper from a Cupric Sulphate Solution
SUBMITTED
By
Natisha Sukhraj
IN FULFILMENT OF THE DEGREE Masters in Chemical Engineering
from the University of KwaZulu-Natal (Westville Campus)
DATE OF SUBMISSION January 2005
SUPERVISED
By
Mr A.F.C Bassa
As the candidate's supervisor, I have approved this thesis for submission.
Signed: ___
Name:--- Date:---
ACo~parativeStudy of Contacting Equipment for the Recovery of Copper from a Cupric Sulphate
~~oo .1
Declaration
DECLARATION
I, Natisha Sukhraj, Student Number 9901396, hereby declare that the thesis entitled A Com- parative Study of Contacting Equipment for the recovery of Copper from a Cupric Sul- phate Solution is a result of my own investigation and research, and presents my own work unless specifically referencedinthe text. This work has not been submitted in part or infullfor any other degree or to any otherU~iversity.
ACo~parativeStudy of Contacting Equipment for the Recovery of Copper from a Cupric Sulphate
SolutIOn ..
11
Acknowledgements
ACKNOWLEDGEMENTS
I would like to acknowledge my supervisor, Mr A.F.C Bassa, for his technical and academic patronage throughout my University career, in particular, toward the completion of this MSc degree by research.
I acknowledge the academic and managerial support structure at the Department of Chemical Engineering (Westville Campus), in particular, Professor M Carsky, Mr. D. Singh and Mr. S.A.
Naidoo, for their continuous conscientious and technical support for my pursuit of this degree.
To my alma mater at the Faculty of Engineering at Westville Campus, thank you.
A special thanks to Mr B. Sukhraj and Mr P. Gareeb for their moral support.
Further more, I would like to acknowledge Mr. A. Bisessur and Mr. S. Naidoo from the De- partment of Chemistry (Westville Campus), for their assistance in aspects of chemistry matters.
Finally, I would like to thank the staff of Mintek South Africa. My postgraduate studies were financially endorsed by Mintek South Africa. I wish to recognise their support for permitting me use of their laboratories and facilities.
ACo~parativeStudy of Contacting Equipment for the Recovery of Copper from a Cupric Sulphate
SolutIOn ...
III
Masters by Research
"RESEARCH IS TO SEE WHAT EVERYBODY ELSE SEES, AND TO THINK WHAT NOBODY ELSE HAS THOUGHT."
... Albert Szent-Gyorgyi
ACo~parativeStudy of Contacting Equipment for the Recovery of Copper from a Cupric Sulphate
SolutIOn iv
Abstract
ABSTRACT
Ion exchange for the recovery of metals from solutions is a well established process.Itfeatures significantly in terms of being able to recover valuable substances from what would otherwise be waste streams as well as recovering substances that could be harmful to the environment if left in the waste stream.
The more popular options for ion exchange processes could be batch, fixed bed, fluidized, mov- ing bed, and chromatographic columns. Although most ion exchange processes tend to be batch processes making use of the fixed bed columns, technological developments enable the use of fluidized beds to be explored.
The main purpose of this research was to compare the performance of a fixed bed ion exchange system with a fluidized ion exchange system for the recovery of copper from a cupric sulphate solution. By experimentation the bed depth required for each type of equipment (in order to achieve a specified percentage recovery of copper from a specified feed) was determined. The comparative advantage of one type of equipment over the other ensures the correct type of sys- tem to be used for a sulphate solution of a particular concentration.
This study provides a basis for comparative studies of contacting equipment for the removal of other substances from dilute solutions.
ACo~parativeStudy of Contacting Equipment for the Recovery of Copper from a Cupric Sulphate
~~ v
Table of Contents
TABLE OF CONTENTS
Title Page 1
Declaration Il
Acknowledgements IlI
Abstract v
List of Symbol and Abbreviations xiii
List of Figures XVI
List of Tables xxiii
Chapter One: Introduction 1
1.1 Comparative Studies Conducted 1
1.2 Study Conducted by Author 2
1.2.1 Definition ofIon Exchange and Purpose of this Study 2
1.2.2 Test Work Conducted 3
1.2.2.1 Choice of Resin 3
1.2.2.2 Preliminary Experimental Test Work 4
1.2.2.3 Experimental Work 4
Chapter Two: Ion Exchange Material 5
2.1 The Phenomenon 5
2.2 Resin 6
2.2.1 Types of Resin 6
2.2.2.1 Cation Exchange Resin 6
2.2.2.2 Anion Exchange Resins " 6
2.2.2 Considerations When Choosing a Resin 7
2.2.2.1 2.2.2.2 2.2.2.3 2.2.2.4 2.2.2.5 2.2.2.6
Typical Particle Shape and Size 7
Total Capacity and Operating Capacity 7
Bulk Density and True Wet Density 7
Swelling and Shrinking 8
Stability " 8
Pressure Drop 9
2.2.3 Resin Chosen: TP 207 Weak acid Cation Resin 9
2.2.3.1 Safety Data on Lewatit TP 207 (Weak acid Cation Resin) 9
A Comparative Study of Contacting Equipment for the Recovery of Copper from a Cupric Sulphate
Solution vi
Table of Contents
Chapter Three: Equilibria and Kinetics 12
3.1 Ion Exchange Equilibrium 12
3.1.1 Batch Method 12
3.1.2 Column Method 12
3.2 Ion Exchange: Mass Balance 12
3.3 Adsorption Isotherms Model · 14
3.4 Selectivity of Ion Exchange Resins 15
3.4.1 Separation Factor 15
3.4.2 Selectivity Coefficient 16
3.4.3 Distribution Coefficient... 17
3.5 Kinetics · 17
3.5.1 Diffusional Steps 17
3.5.2 Integral Method 18
3.5.2.1 Order of Reaction 18
3.5.2.I(a) Zero Order 19
3.5.2.1(b) First Order 19
3.5.2.I(c) Second Order 20
Chapter Four: Breakthrough Test....•.•...•. :....•.•...••...•.•..•.•..•.•.21
4.1 The "Mass Transfer Zone" 21
4.1.1 Definition and Principle 21
4.1.2 Calculations of the Mass Transfer Zone Height 23
Chapter Five: Fixed and Fluidized Beds .•.•...•.•.•..•.•.•...••..•••.•.••..•.•..••..25
5.1 Fixed Beds 26
5.2 Fluidized Beds 26
5.2.1 Analysis of Experimental Determination of Minimum Fluidization Velocity 27
5.2.2 Richardson Zaki Correlation 28
5.2.2.1 Void volume as a function of Bed Height 29
Chapter Six: Design Considerations ...•••....•...•.•...•..•..•...•.•... 30
6.1 Vessel Sizing and Requirements 30
6.1.1 Vessel Sizing 30
6.2.1 Product Requirements 30
6.1.3 Feed Composition 30
6.2 Schematic Representation of Designs for Ion Exchange Columns 31
A Comparative Study of Contacting Equipment for the Recovery of Copper from a Cupric Sulphate
Solution vii
Table of Contents
Chapter Seven: Determination of Copper Present in the Effluent and Eluates 34
7.1 Spectrophotometry 34
7.1.1 Spectrophotometric Analysis : 34
Chapter Eight: Regeneration 36
8.1 Regeneration Procedure 36
8.2 Co-Current and Counter-Current Regeneration 36
Chapter Nine: Applications ofIon Exchange Processes 38
9.1 Waste Water Treatment. 38
9.2 Water Softening 38
9.3 Applications in the Gold Industry 39
9.4 Other Applications ofIon Exchange Processes 39
Chapter Ten: Experimental Procedures 41
10.1 Tapped Wet Volume Measurement. 41
10.1.1 Procedure 41
10.1.2 Packing a Column with Resin 41
10.1.2.1 Procedure 41
10.1.3 Pre conditioning of Resins 42
10.1.3.1 Purpose 42
10.1.3.2 Resin 42
10.2 Determination of Average Particle Size ofTP 207 resin 42
10.2.1 Apparatus and Equipment 42
10.2.2 Reagents 42
10.2.3 Procedure 42
10.3 Void Volume Measurement. .. . . . .. . . .. . . . .. . .. . .. . . .. . . .. .. . . .. . .. . . .. . . . .. . . .. . .. .. . .. . .. .. 43
10.3.1 Apparatus and Equipment .43
10.3.2 Reagents 44
10.3.3 Procedure 44
10.4 Water Retention Capacity .44
10.4.1 Apparatus and Equipment .44
10.4.2 Reagents 44
10.4.3 Procedure 45
10.5 pH Test .45
10.5.1 Apparatus and Equipment '" 45
10.5.2 Reagents 46
10.5.3 Procedure 46
A Comparative Study of Contacting Equipment for the Recovery of Copper from a Cupric Sulphate
Solution ...
Vlll
Table of Contents
10.6 Equilibrium Tests 47
10.6.1 Apparatus and Equipment .47
10.6.2 Reagents ··· 47
10.6.3 Procedure ··· 47
10.7 Kinetic Tests 48 10.7.1 Apparatus and Equipment 48 10.7.2 Reagents 48 10.7.3 Procedure 48 10.8 Effect of Swelling of TP 207 resins ··· 49
10.8.1 Conversion into the Hydrogen form ··· 49
10.8.1.1 Procedure , 49 10.8.2 Conversion into the Di Sodium ··· 49
10.8.2.1 Procedure ··· 49
10.8.3 Conversion into the Mono Sodium form ··· 50
10.8.3.1 Procedure ···.50
10.9 Mini Column Tests ···.··· .. 51
10.9.1 Apparatus and Equipment , 51
10.9.2 Reagents 51
10.9.3 Procedure 51
10.10 Minimum Fluidization Velocity Measurement 52
10.10.1 Apparatus and Equipment 52
10.10.2 Reagents 52
10.10.3 Procedure 52
10.11 Column Tests 53
10.11.1 Apparatus and Equipment 53
10.11.2 Reagents 53
10.11.3 Procedure 53
10.12 Pilot Plant Testing 54
10.12.1 Apparatus and Equipment 54
10.12.2 Reagents 55
10.12.3 Procedure 55
Chapter Eleven: Results and Discussion 60
11.1 Influent Characteristics 60
11.1.1 Chemical Analysis 60
11.1.2 Void Volume Determination 60
A Comparative Study of Contacting Equipment for the Recovery of Copper from a Cupric Sulphate
Solution ix
Table of Contents
11.2 Adsorbent 60
11.2.1 Resin Characterization.. . .. . . .. . . . .. . .. . .. . .. . . .. . .. . . .. .. .. . . .. .. . . .. . . . .. . . .. . .. . .. . . . 60
11.2.2 Particle Size Analysis 60
11.2.3 Water Retention Capacity 61
11.3 Preliminary Test Work 61
11.3.1 pH Dependence of Metal Loadings 61
11.3.2 Ion Exchange Equilibrium Isotherms 62
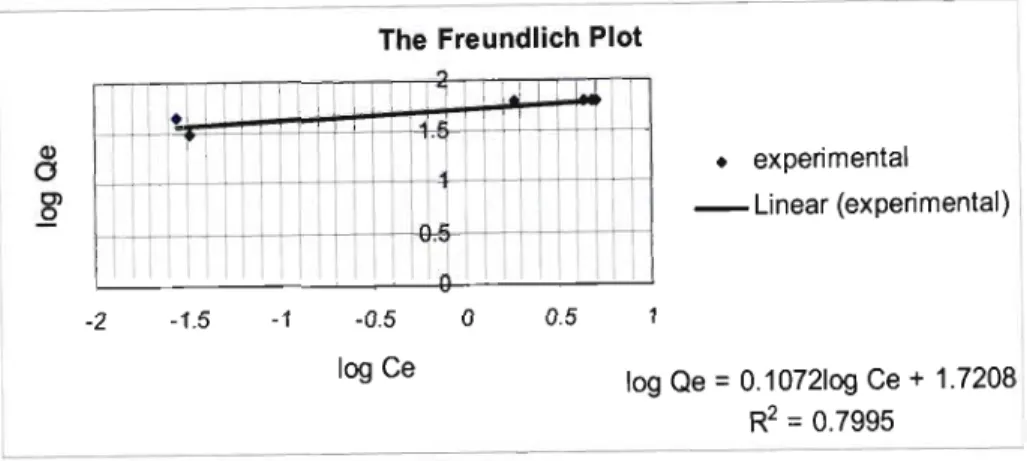
11.3.2.1 The Langmuir Isotherm for Equilibrium Curve at pH 3 63 11.3 .2.2 The Freundlich Isotherm for Equilibrium Curve at pH 3 64
11.3.3 Kinetic Tests 67
11.3.4 Effect of Swelling 70
11.4 Mini Column Tests , 70
11.5 Determination of Minimum Fluidization Velocity 73
11.6 Column Tests 75
11.7 Pilot Plant Testing 77
11.7.1 Breakthrough Tests 78
11.7.2 Full Scale Plant Design 81
11.7.2.1 Sizing of Pilot Plant... 81
11.7.3 Cost Estimation 83
11.7.3.1 Capital Expenditure 83
11.7.3.2 Production Costs 85
11.7.3.2(a) Regenerant: Sulphuric Acid 86
11.7.3.2 (b) Operating Labour.. 86
11.7.3.3 Cost Indices 86
11.7.4 Summary 87
Chapter Twelve: Conclusion 88
12.1 Resin Properties 88
12.2 Preliminary Experimental Test Work 88
12.2.1 Effect of pH on Resin Loading 89
12.2.2 Ion Exchange Equilibria 89
12.2.3 Effect on Particle Size on Kinetics 90
12.3 Mini Column Tests 91
12.4 Minimum Fluidization Velocity 92
12.5 Column Tests 92
12.6 Pilot Plant Testing 93
A Comparative Study of Contacting Equipment for the Recovery of Copper from a Cupric Sulphate
Solution x
Table of Contents
Chapter Thirteen: The Way Forward 95
References 96
Appendices Appendix A
AI: Glossary of Terms Al-1
Appendix B
B1: Cost Estimation for Ion Exchange Project B1-1
Appendix C: Resin Properties
Cl: Particle Size Distribution C1-1
C2: Determination of Void Volume C2-1
C3: Calculation of Minimum Fluidization and Terminal Velocity for TP 207 C3-1
C4: Determination of Water Retention Capacity C4-1
C5: Determination ofthe Effect of Swelling on the TP 207 resin C5-1 Appendix D: pH Test
D 1 pH Test Calculations D 1-1
Appendix E: Equilibrium Tests
El: Equilibrium Test for pH set at 3 E1-1
E2: Equilibrium Test for pH set at 2.5 E2-1
E3: Equilibrium Test for pH set at 2 E3-1
E4: Equilibrium Test for pH set at 1.5 E4-1
E5: Summary of Equilibrium Plots E5-1
Appendix F: Kinetic Tests
F1: Kinetic tests for particle diameter 850
,um
F 1-1F2: Kinetic tests for particle diameter 600
,urn
F2-1F3: Comparisons of the Particle Diameters F3-1
F4: Predicted Kinetic Responses F4-1
Appendix G: Mini Column Tests
G1: Hydrogen form, feed pH 3 G1-1
G2: Di Sodium form, feed pH 3 G2-1
A Comparative Study of Contacting Equipment for the Recovery of Copper from a Cupric Sulphate
Solution xi
Table of Contents
G3: Mono Sodium form, feed pH 3 G3-1
G4: Summary of Results obtained from Feed pH 2.5 G4-1
G5: Summary of Results obtained from Feed pH 2.04 G5-1
G6: Summary of Results obtained from Feed pH 1.59 G6-1
Appendix H: Minimum Fluidization Velocity
HI: Determination of Minimum Fluidization Velocity H 1-1
Appendix I: Column Tests
11: Column test at Linear Velocity 0.13 cm/s 11-1
12: Column test at Linear Velocity 0.19 cm/s 12-1
13: Column test at Linear Velocity 0.41 cm/s 13-1
14: Mass Transfer Zone versus Linear Velocity 14-1
15: Full Scale Plant Design for 0.13 cm/s 15-1
16: Full Scale Plant Design for 0.19 cm/s 16-1
17: Full Scale Plant Design for 0.4 cm/s 17-1
AppendixJ:Comparison of Contacting Equipment at 6 gIL
Jl: Fixed Bed Ion Exchange for Concentration at 6 g/L. Jl-1
J2: Fluidized Bed Ion Exchange for Concentration at 6 g/L. 12-1
13: Comparison of Contacting Equipment for 6 glL 13-1
Appendix K: Comparison of Contacting Equipment at 0.6 glL
K1: Fixed Bed Ion Exchange Column at Concentration of 0.6 g/L. K1-1 K2: Fluidized Bed Ion Exchange Column at Concentration of 0.6 glL K2-1
K3: Comparison of Contacting Equipment for 0.6 g/L.. K3-1
Appendix L: Full Scale Plant Design and Cost Estimations
L1 : Full scale Plant Design for Fixed Bed at 6 g/L.. L1-1
L2: Full scale Plant Design for Fluidized Bed at 6 glL L2-1
L3: Full scale Plant Design for Fixed Bed at 0.6 glL L3-1
L4: Full scale Plant Design for Fluidized Bed at 0.6 g/L. L4-1
L5: Cost Estimation for Full scale Fixed Bed Design L5-1
L6: Cost Estimation for Full scale Fluidized Bed Design L6-1
A Comparative Study of Contacting Equipment for the Recovery of Copper from a Cupric Sulphate
Solution xii
List of Symbols
LIST OF SYMBOLS ANDABBREVIAnONS
Symbol Description Unit
a Langmuir constant dimensionless
ap Surface area per unit volume of particle m2/m3
Aeol Column cross-sectional area m2
Aint Total interfacial area m2
b Langmuir constant dimensionless
C Solution concentration g/L
Cs Solution concentration at time ts gIL
CD Drag coefficient dimensionless
Cel Elution Concentration of Cu2+ gIL
Co Total solution concentration glL
Ce Equilibrium solution concentration g/L
d Resin particle diameter mm
Deol Column diameter cm
fe Zone fraction dimensionless
g Gravitational constant rn/s2
Hp Height of Packed Column mm; cm
h Mass Transfer Zone cm; m
K
f Freundlich parameter dimensionlessL Liquid flow rate m3/s
lIn Freundlich parameter dimensionless
q Resin concentration g/L
qo Initial resin concentration glL
qe Amount of Copper loaded onto resin from absorp- tion g/L
Qe Amount of Copper loaded onto resin from elution glL
A Comparative Study of Contacting Equipment for the Recovery of Copper from a Cupric Sulphate
Solution xiii
List of Symbols
Q Total resin capacity (m3of resin beads) glL
Qop Operating resin capacity (m3of resin beads) glL
r Fitting Parameter dimensionless
Re Reynolds number (pdULIll) dimensionless
Sc Schmidt number (IlIpD) dimensionless
Sh Sherwood number (kLd/ D) dimensionless
t Time min
tB Time to reach breakthrough concentration mm
h Time to reach specified concentration at the top of
min; hr breakthrough curve
T Temperature K
UF Minimum Fluidization Veiocity cm/s
UL Liquid superficial velocity(L/Aeol) cm/s
Uo Liquid velocity at e=l (fluidized bed) cm/s
UR Resin superficial velocity(RIAeol) crn/s
UT Resin bead terminal velocity crn/s
Ve Volume of resin loaded with copper mL
Vo Initial volume of feed L
VB Liquid volume at time tB BV
Vbed Resin bed volume including voids mL
Veu Volume of Cu2+solution from elution L
Ve Volume of resin after elution mL
Vro Tapped wet volume of resin initially mL
Vs Volume of Cu2+ solution concentration after equi- librium mL;L
VL Liquid volume L
z Distance along column cm; m
Z Total column height cm; m
A Comparative Study of Contacting Equipment for the Recovery of Copper from a Cupric Sulphate
Solution xiv
List of Symbols
Greek Symbols
Greek Symbol Description Unit
G Resin bed void volume dimensionless
Go Settled bed void volume dimensionless
Gp Resin pore void volume dimensionless
J..l. Liquid viscosity kg/ms
Pr Liquid density g/L
Ps Resin density g/L
t Residence Time min
List of Abbreviations
Bed Volumes BV
Linear Velocity LV
Mass Transfer Zone MTZ
Not Applicable NA
Time t
Concentration Cone.
Hours hr
Hydrogen form H+ form
A Comparative Study of Contacting Equipment for the Recovery of Copper from a Cupric Sulphate
Solution xv
List of Figures
LIST OF FIGURES CHAPTER TWO: ION EXCHANGE MATERIALS Figure 2.1:
Figure 2.2:
Representation of Cation Exchange on an Ion Exchangeable Material... 5 Schematic Representation of Drying and Swelling of a Resin Bead 8 CHAPTER THREE: EQUILIBRIA AND KINETICS
Figure 3.1:
Figure 3.2:
Figure 3.3:
Figure 3.4:
Figure 3.5:
Figure 3.6:
Figure 3.7:
Initial Conditions at Start of Operation 13
Conditions at the End of Operation 14
Plots of Adsorption Isotherm Models 14
Steps in an Ion Exchange Reaction 18
Zero-Order Reaction 19
First-Order Reaction 19
Second-Order Reaction 20
CHAPTER FOUR: BREAKTHROUGH TESTS Figure 4.1:
Figure 4.2:
Figure 4.3:
Figure 4.4:
Figure 4.5:
Figure 4.6:
Photograph of Resin Bed (TP 207 resin in the hydrogen form) 21 Photograph of first few layers of the Resin Bed adsorbed with Copper in a Fixed
Bed Ion Exchange Column 22
A Plot of the Concentration Profile of adsorbate in the fluid phase as a function of
Distance along the Adsorbent Bed 22
A Typical plot ofthe ratio of Outlet solute concentration to Inlet solute concentra- tion in the fluid as a function of Time from the start of flow 22 Schematic Representation of the Mass Transfer Zone in a fixed bed ion
exchange column 23
Calculation of Mass Transfer Zone from Breakthrough Tests 24 CHAPTER FIVE: FIXED AND FLUIDIZED BEDS
Figure 5.1: Fixed Bed versus Fluidized Bed 25
Figure 5.2: Graph of Pressure drop and Bed Height versus Superficial Velocity 27
CHAPTER SIX: DESIGN CONSIDERATIONS Figure 6.1:
Figure 6.2:
Schematic Design of Fixed Bed Ion Exchange Column 32 Schematic Design of Fluidized Ion Exchange Column 33
ACo~parativeStudy of Contacting Equipment for the Recovery of Copper from a Cupric Sulphate
SolutIOn xvi
List of Figures
CHAPTER SEVEN: DETERMINATION OF COPPER PRESENT IN THE EFFLUENT ANDELUATES
Figure 7.1: Varian Spectra AA 50 B 34
CHAPTER NINE: APPLICATIONS OF ION EXCHANGE PROCESSES Figure 9.1:
Figure 9.2:
Figure 9.3:
Figure 9.4:
Some Water Treatment Resins 38
Exchange of Hard Water Ions for Soft Water Ions 39
Down Flow Ion Exchange Columns .40
Up Flow Ion Exchange Columns .40
CHAPTER TEN: EXPERIMENTAL PROCEDURES
Figure 10.1: Photograph of a handful of TP 207 resin in the Hydrogen form .43 Figure 10.2: Photograph of a Single Particle Magnified fifteen times .43 Figure 10.3: Photograph of the Watson Marlow Peristaltic Pump 52
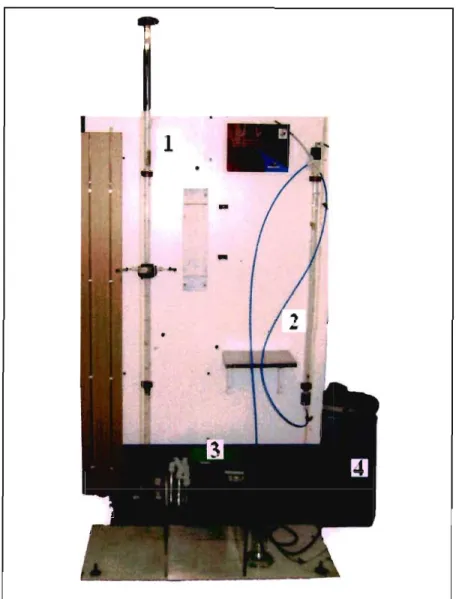
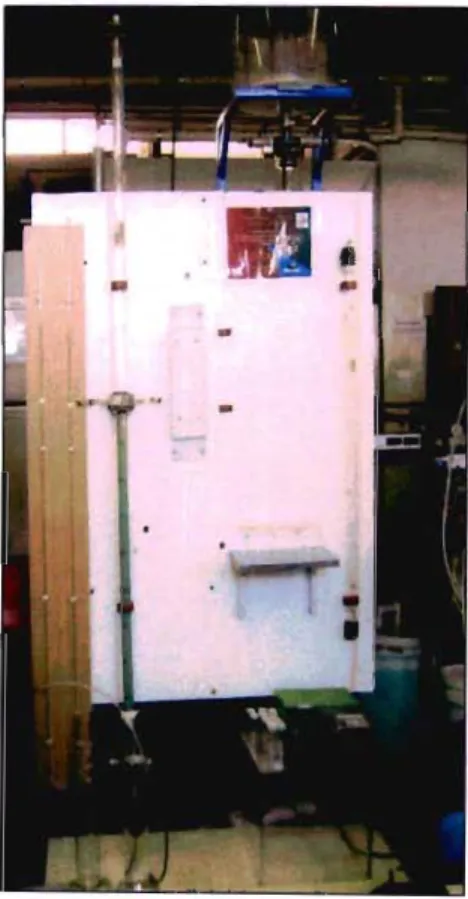
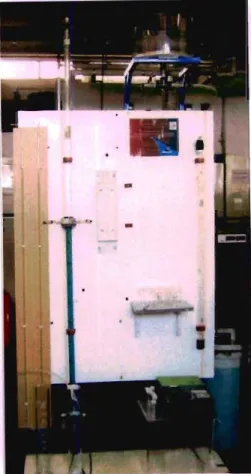
Figure 10.4: Photograph of the Pilot Plant... 56
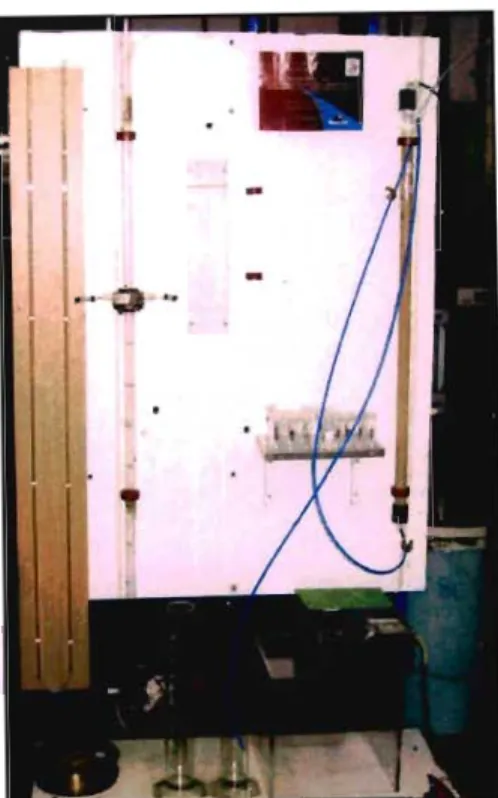
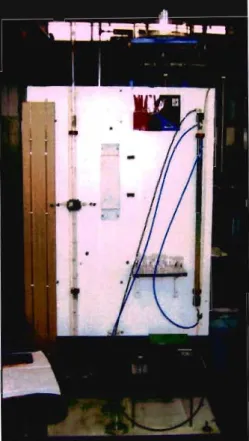
Figure 10.5: Photograph of the Fixed Bed Column at the Start of Operations 57 Figure 10.6: Photograph of the Fixed Bed during Operation with Copper loading onto resin.. 57 Figure 10.7: Photograph of the Fixed Bed at the End of Operation with resin fully loaded with
Copper 58
Figure 10.8: Photograph of the Fluidized Bed during Operation with Copper loading onto
resin 58
Figure 10.9: Photograph of the Fluidized Bed at the End of Operation with resin fully loaded
with Copper 59
Figure 10.10: Photograph of the Regeneration of the resin with 2M Sulphuric Acid 59
CHAPTER ELEVEN: RESULTS AND DISCUSSION
Figure 11.1: Effect of pH on Copper Loading 62
Figure 11.2: Equilibrium Isotherm ofTP 207 Resin [Favourable Isotherm]. 62 Figure 11.3: Langmuir Isotherm for Equilibrium Curve at pH 3 64 Figure 11.4: Freundlich Isotherm for Equilibrium Curve at pH 3 65 Figure 11.5: A Comparison of Experimental Data with the Langmuir and Freundlich Plots at
pH 3 65
Figure 11.6: A Comparison of Experimental Data with the Langmuir and Freundlich Plots at
pH 2.5 66
Figure 11.7: A Comparison of Experimental Data with the Langmuir and Freundlich Plots at
pH 2 66
ACo~parativeStudy of Contacting Equipment for the Recovery of Copper from a Cupric Sulphate
SolutIOn xvii
List of Figures
Figure 11.8 : A Comparison of Experimental Data with the Langmuir and Freundlich Plots at
pH 1.5 66
Figure 11.9 : Kinetic Response for 850 jJ.m and Initial Concentration 6 g/L. 68 Figure 11.10: First Order Reaction Kinetics for 850 jJ.m and Initial Concentration of 6 gIL 68 Figure 11.11: Second Order Reaction Kinetics for 850 jJ.m and Initial Concentration of 6 g/L.. 68 Figure 11.12: Effect of particle diameter at initial concentration of 6 g/L. 69 Figure 11.13: Effect of particle diameter at initial concentration of 0.6 g/L 70 Figure 11.14: Resin in Three forms at Initial Feed at pH of 3 71 Figure 11.15: Resin in Three forms at Initial Feed at pH of 2.5 71 Figure 11.16: Resin in Three forms at Initial Feed at pH of 2.04 71 Figure 11.17: Resin in Three forms at Initial Feed at pH 1.59 72 Figure 11.18: Experimental Determination of Minimum Fluidization Velocity 74 Figure 11.19: Comparison of Predicted Data and Experimental Data for the Graph of Void Vol-
ume versus Linear Velocity 74
Figure 1l.20: Breakthrough curve at Linear Velocity of 0.13 cm/s 76 Figure 11.21: Breakthrough curve at Linear Velocity of 0.195 cm/s 76 Figure 11.22: Breakthrough curve at Linear Velocity of 0.41 cm/s 76 Figure 11.23: Graph of Mass Transfer Zone versus Linear Velocity 77
Figure 11.24: Fixed Bed Testing at 6 g/L.. 78
Figure 11.25: Fluidized Bed Testing at 6 g/L 78
Figure 11.26: Comparison of Fixed and Fluidized Bed at 6g/L.. 79
Figure 11.27: Fixed Bed Testing at 0.6 g/L 79
Figure 11.28: Fluidized Bed Testing at 0.6 g/L.. 79
Figure 11.29: Comparison of Fixed and Fluidized Bed at 0.6 gIL 80 Figure 11.30: Sizing and Operation of an Ion Exchange Pilot Plant... 81
Figure 11.31: Vertical pressure vessel... 85
Figure 11.32: Chemical Engineering Plant Cost Indices 86
CHAPTER TWELVE: CONCLUSION
Figure 12.1: Effect of pH on Copper Loading 89
Figure 12.2: Summary of Copper Ion Exchange Equilibrium Isotherms 89 Figure 12.3: Comparison of Particle Diameter 850 jJ.m and 600 jJ.m at Initial Concentration
6g/L 90
Figure 12.4: Comparison of Particle Diameter 850 jJ.m and 600 jJ.m at Initial Concentration
0.6 g/L 91
ACo~parativeStudy of Contacting Equipment for the Recovery of Copper from a Cupric Sulphate
SolutIOn xviii
List of Figures
Figure 12.5: Resin in Three Forms at Initial Feed pH of3 91
Figure 12.6: Experimental determination of Minimum Fluidization Velocity 92 Figure 12.7: Graph of Mass Transfer Zone versus Linear Velocity 92 Figure 12.8: Comparison of Fixed and Fluidized bed at 6g/L 93 Figure 12.9: Comparison of Fixed and Fluidized bed at O.6g/L. 93
APPENDIX C: RESIN PROPERTIES
Figure Cl}: Cumulative Graph for Run 1.. C 1-1
FigureC1.2: Summary of Cumulative graphs for Runs 2-8 Cl-3
APPENDIX D: pH TESTS
Figure D 1.1: pH Curve for Copper Solution D 1-3
APPENDIX E: EQUILIBRIUM TESTS
Figure ELl: Equilibrium Curve at pH 3 for Adsorption E 1-3
Figure E1.2: Equilibrium Curve at pH 3 for Elution El-3
Figure E1.3: Linear Regression to obtain Parameters for the Langmuir Plot at pH 3 EI-4 Figure E1.4: Linear Regression to obtain Parameters for the Freundlich Plot at pH 3 El-5 Figure E1.5: Comparison of Experimental and Predicted Results El-6 Figure E2.l: Equilibrium Curve at pH 2.5 for Adsorption E2-3
Figure E2.2: Equilibrium Curve at pH 2.5 for Elution E2-3
Figure E2.3: Linear Regression to obtain Parameters for the Langmuir Plot at pH 2.5 E2-4 Figure E2.4: Linear Regression to obtain Parameters for the Freundlich Plot at pH 2.5 E2-5 Figure E2.5: Comparison of Experimental and Predicted Results E2-6
Figure E3.l: Equilibrium Curve at pH 2 for Adsorption E3-3
Figure E3.2: Equilibrium Curve at pH 2 for Elution E3-3
Figure E3.3: Linear Regression to obtain Parameters for the Langmuir Plot at pH 2 E3-4 Figure E3.4: Linear Regression to obtain Parameters for the Freundlich Plot at pH 2 E3-5 Figure E3.5: Comparison of Experimental and Predicted Results E3-6 Figure E4.l: Equilibrium Curve at pH 1.5 for Adsorption E4-3
Figure E4.2: Equilibrium Curve at pH 1.5 for Elution E4-3
Figure E4.3: Linear Regression to obtain Parameters for the Langmuir Plot atpH 1.5 E4-4 Figure E4.4: Linear Regression to obtain Parameters for the Freundlich Plot at pH 1.5 E4-5 Figure E4.5: Comparison of Experimental and Predicted Results E4-6
A Comparative Study of Contacting Equipment for the Recovery of Copper from a Cupric Sulphate
Solution xix
List of Figures
APPENDIX F: KINETIC TEST
Figure F Ll: Kinetic Response for 850J.imfrom Table F1.4 F 1-2 Figure F1.2: Kinetic Response for Initial Concentration at 6 g/L from Table F1.4 Fl-3 Figure F1.3: First Order Reaction Plot for 6 g/L from Table F1.5 FI-3 Figure F1.4: Second Order Reaction Plot for 6 g/L from Table F1.6 FI-4 Figure F 1.5: Kinetic Response forInitial Concentration at 0.6 g/L from Table F1.4 F1-5 Figure F1.6: First Order Reaction Plot for 0.6 g/L from Table F1.7 FI-5 Figure F1.7: Second Order Reaction Plot for 0.6 g/L from Table F1.8 FI-6 Figure F2.l: Kinetic Response for 600J.imfrom Table F2.4 F2-2 Figure F2.2: Kinetic Response for Initial Concentration at 6 g/L from Table F2.4 F2-3 Figure F2.3: First Order Reaction Plot for 6 g/L from Table F2.5 F2-3 Figure F2.4: Second Order Reaction Plot for 6 g/L from Table F2.6 F2-4 Figure F2.5: Kinetic Response for Initial Concentration at 0.6 g/L from Table F2.4 F2-5 Figure F2.6: First Order Reaction Plot for 0.6 g/L from Table F2.7 F2-5 Figure F2.7: Second Order Reaction Plot for 0.6 g/L from Table F2.8 F2-6 Figure F3.1: Comparison of Particle Diameter 850J.imand 600J.imat Initial Concentration
6 g/L F3-1
Figure F3.2: Comparison of Particle Diameter 850J.imand 600J.imat Initial Concentration
0.6 g/L F3-2
Figure F4.1: Predicted Kinetic Response for Particle Diameter 850J.imand Concentration
6g/L F4-1
Figure F4.2: Predicted Kinetic Response for Particle Diameter 600J.imand Concentration
6g/L F4-2
Figure F4.3: Predicted Kinetic Response for Particle Diameter 850J.imand Concentration
0.6g/L F4-3
Figure F4.4: Predicted Kinetic Response for Particle Diameter 600J.imand Concentration
0.6g/L F4-4
APPENDIX G: MINI COLUMN TESTS
Figure GLl: Breakthrough Curve with Initial Condition from Table G1.1.. GI-3 Figure G1.2: Monitoring of Copper Concentration and Effluent pH G1-3 Figure G2.l: Breakthrough Curve with Initial Condition from Table G2.l G2-3 Figure G2.2: Monitoring of Copper Concentration and Effluent pH G2-3 Figure G3.1: Breakthrough Curve obtained with Initial Condition from Table G3.1.. G3-4 Figure G3.2: Monitoring of Copper Concentration and Effluent pH stream G3-4 Figure G3.3: Resin in Three Forms at Initial Feed pH of3 G3-4 A Comparative Study of Contacting Equipment for the Recovery of Copper from a Cupric Sulphate
Solution xx
List of Figures
Figure G4.1: Breakthrough Curve with Initial Condition from Table G4.1.. G4-1 Figure G4.2: Monitoring of Copper Concentration and Effluent pH G4-1.. G4-1 Figure G4.3: Breakthrough Curve with Initial Condition from Table G4.3 G4-2 Figure G4.4: Monitoring of Copper Concentration and Effluent pH G4-2 Figure G4.5: Breakthrough Curve with Initial Condition from Table G4.5 G4-3 Figure G4.6: Monitoring of Copper Concentration and Effluent pH G4-3 Figure G4.7: Resin in Three Forms at Initial Feed pH of2.5 G4-4 Figure G5.1: Breakthrough Curve with Initial Condition from Table G5.1.. G5-1 Figure G5.2: Monitoring of Copper Concentration and Effluent pH G5-1 Figure G5.3: Breakthrough Curve with Initial Condition from Table G5.3 G5-2 Figure G5.4: Monitoring of Copper Concentration and Effluent pH G5-2 Figure G5.5: Breakthrough Curve with Initial Condition from Table G5.5 G5-3 Figure G5.6: Monitoring of Copper Concentration and Effluent pH G5-3 Figure G5.7: Resin in Three Forms at Initial Feed pH of2.04 G5-4 Figure G6.1: Breakthrough Curve with Initial Condition from Table G6.1.. G6-1 Figure G6.2: Monitoring of Copper Concentration and Effluent pH G6-1 Figure G6.3: Breakthrough Curve with Initial Condition from Table G6.3 G6-2 Figure G6.4: Monitoring of Copper Concentration and Effluent pH G6-2 Figure G6.5: Breakthrough Curve with Initial Condition from Table G6.5 G6-3 Figure G6.6: Monitoring of Copper Concentration and Effluent pH G6-3 Figure G6.7: Resin in Three Forms at Initial Feed pH of 1.59 G6-4
APPENDIX H: MINIMUM FLUIDIZAnON VELOCITY
Figure H1.1: Graph of Bed Height versus Column Velocity HI-2 Figure H1.2: Graph of Void Fraction versus Column Velocity Hl-3 Figure H1.3: Comparison of Experimental and Predicted Curves Hl-3
APPENDIX I: COLUMN TESTS
Figure 11.1: Breakthrough Curve with Initial Condition from Table 11.1.. 11-4 Figure 11.2: Monitoring of Copper Concentration and Effluent pH .I 1-4 Figure 12.1: Breakthrough Curve with Initial Condition from Table 12.1.. 12-4 Figure 12.2: Monitoring of Copper Concentration and Effluent pH 12-4 Figure 13.1: Breakthrough Curve with Initial Condition from Table 13.1.. 13-4 Figure 13.2: Monitoring of Copper Concentration and Effluent pH 13-4 Figure 14.1: Graph of Mass Transfer Zone versus Linear Velocity .I4-1
A Comparative Study of Contacting Equipment for the Recovery of Copper from a Cupric Sulphate
Solution xxi
List of Figures
APPENDIX J: COMPARISON OF CONTACTING EQUIPMENTS AT 6 g/L
Figure J1.1: Breakthrough Curve with Initial Condition from Table J1.1.. 11-4 Figure J1.2: Monitoring of Copper Concentration and Effluent pH 11-4 Figure J2.1: Breakthrough Curve with Initial Condition from Table 12.1.. J2-4 Figure 12.2: Monitoring of Copper Concentration and Effluent pH .J2-4 Figure 13.1: Comparison of Fixed and Fluidized Breakthrough Curves at 6 g/L 13-1
APPENDIX K: COMPARISON OF CONTACTING EQUIPMENTS AT 0.6 g/L
Figure K1.1: Breakthrough Curve with Initial Condition from Table K1.1.. Kl-3 Figure K2.l: Breakthrough Curve with Initial Condition from Table K2.1.. K2-3 Figure K3.l: Comparison of Fixed and Fluidized Breakthrough Curves at 0.6 g/L K3-l
ACo~parativeStudy of Contacting Equipment for the Recovery of Copper from a Cupric Sulphate
SolutIOn ..
XXII
List of Tables
LIST OF TABLES
CHAPTER TWO: ION EXCHANGE MATERIAL
Table 2.1: Safety Data on Lewatit TP 207 resin 9
CHAPTER FIVE: FIXED AND FLUIDIZED BEDS
Table 5.1: Determination ofn (Function of Reynolds Number) 29
CHAPTER EIGHT: REGENERATION
Table 8.1: Guidelines for Typical Regeneration Level and Corresponding Resin Operating
Capacity .37
CHAPTER ELEVEN: RESULTS AND DISCUSSION
Table 11.1: Summary of Particle Size Analysis 61
Table 11.2: Fitting Parameters for Langmuir Isotherm at pH 3 64 Table 11.3: Fitting Parameters for Freundlich Isotherm at pH 3 65 Table 11.4: Final Results and Fitting Parameters for Equilibrium Curves 67 Table 11.5: Mass Transfer Coefficient (k) for Diameter 850,um 69 Table 11.6: Mass Transfer Coefficient (k) for Diameter 600,um 69 Table 11.7: Tabulation of Three Forms of Resin at Initial Feed pH 3 72 Table 11.8: Tabulation of Three Forms of Resin at Initial Feed pH 2.5 72 Table 11.9: Tabulation of Three Forms of Resin at Initial Feed pH 2 72 Table 11.10: Tabulation of Three Forms of Resin at Initial Feed pH 1.5 73 Table 11.11: Theoretical Determination of Minimum Fluidization and Settling Velocity 74 Table 11.12: t-test (Two samples Assuming Equal Variance) 75 Table 11.13: Tabulation of the Mass Transfer Zones heights at respective velocity 76 Table 11.14: Tabulation of Mass Transfer Zone heights for 6 g/L 78 Table 11.15: Tabulation of Mass Transfer Zone heights for 0.6g/L 80 Table 11.16: Preliminary Column Design and Operating Parameters for the Removal of Cop-
per from a Cupric Sulphate Solution at 6 g/L.. 82
Table 11.17: Preliminary Column Design and Operating Parameters for the Removal of Cop-
per from a Cupric Sulphate Solution at 0.6 g/ 83
Table 11.18: Typical factors for the Estimation of Fixed Capital Cost... 84
Table 11.19: Summary of Production Costs 85
A Comparative Study of Contacting Equipment for the Recovery of Copper from a Cupric Sulphate
Solution xxiii
List of Tables
CHAPTER TWELVE: CONCLUSION
Table 12.1: Summary of Properties ofTP 207 resin 88
Table 12.2: Fitting Parameters and Correlation Coefficients 90 Table 11.3: Tabulation of the Mass Transfer Zones heights 92 Table 11.4: Tabulation of the Resin Bed Depth Requirement for 6 g/L 93 Table 11.5: Tabulation of Resin Bed Depth Requirement for 0.6 g/L. 94
APPENDIX C: RESIN PROPERTIES
Table C 1.1 : Initial Conditions for each Run Cl-I
Table C1.2: Cumulative Graph Data for Run 1.. CI-I
Table C1.3: Summary of Particle Size Analysis CI-4
APPENDIX D: pH TESTS
Table DU: Results obtained from pH Test... DI-I
Table D 1.2: Calculations obtained from pH Test... D 1-2
APPENDIX E: EQUILIBRIUM TESTS
Table El.l: Results from Equilibrium Test at pH 3 EI-I
Table E1.2: Calculations from Equilibrium Test at pH 3 EI-2
Table E1.3: The Langmuir and Freundlich Adsorption Isotherrns EI-4
Table E1.4: Parameters for the Langmuir Plot... EI-4
Table E1.5: Parameters for the Freundlich Plot... EI-5
Table E1.6: Tabulation of Results from Langmuir and Freundlich Equation EI-5
Table E2.1: Results from Equilibrium Test at pH 2.5 E2-1
Table E2.2: Calculations from Equilibrium Test at pH 2.5 E2-2 Table E2.3: The Langmuir and Freundlich Adsorption Isotherrns E2-4
Table E2.4: Parameters for the Langmuir Plot... E2-4
Table E2.5: Parameters for the Freundlich Plot... E2-5
Table E2.6: Tabulation of Results from Langmuir and Freundlich Equation E2-5
Table E3.1: Results from Equilibrium Test at pH 2 E3-1
Table E3.2: Calculations from Equilibrium Test at pH 2 E3~2
Table E3.3: The Langmuir and Freundlich Adsorption Isotherrns E3-4
Table E3.4: Parameters for the Langmuir Plot... E3-4
Table E3.5: Parameters for the Freundlich Plot... E3-5
Table E3.6: Tabulation of Results from Langmuir and Freundlich Equation E3-5
Table E4.1: Results from Equilibrium Test at pH 1.5 E4-1
Table E4.2: Calculations from Equilibrium Test at pH 1.5 E4-2 A Comparative Study of Contacting Equipment for the Recovery of Copper from a Cupric Sulphate
Solution xxiv
List of Tables
Table E4.3:
Table E4.4:
Table E4.5:
Table E4.6:
The Langmuir and Freundlich Adsorption Isotherms E4-4
Parameters for the Langmuir Plot. ··· E4-4
Parameters for the Freundlich Plot... E4-5
Tabulation of Results from Langmuir and Freundlich Equation E4-5
APPENDIX F: KINETIC TESTS
Table F 1.1 : Operating Conditions at the beginning of Kinetic Test... F I-I Table F1.2: Operating Conditions at the End ofthe Kinetic Test... Fl-l Table F1.3: Calculations for Kinetic Test from Experimental Data Fl-l
Table F1.4: Results obtained from Kinetic Test... Fl-2
Table F1.5:
Table F2.l:
Table F2.4:
Table F2.2:
Table F2.3:
First Order Reaction Kinetics for 6 g/L F 1-3
Second Order Reaction Kinetics for 6 g/L Fl-4
First Order Reaction Kinetics for 0.6 g/L F 1-5
Second Order Reaction Kinetics for 0.6 g/L Fl-6
Mass Transfer Coefficient (k) calculated from First and Second Order Reaction
Curves for Diameter 850Jlm Fl-6
Operating Conditions at the beginning of Kinetic Test... F2-l Operating Conditions at the End of the Kinetic Test... F2-l Calculations for Kinetic Test from Experimental Data F2-l
Results obtained from Kinetic Test... F2-2
First Order Reaction Kinetics for 6 g/L F2-3
Second Order Reaction Kinetics for 6 g/L F2-4
First Order Reaction Kinetics for 0.6 g/L F2-5
Second Order Reaction Kinetics for 0.6 g/L.. F2-6
Mass Transfer Coefficient (k) calculated from First and Second Order Reaction
Curves for Diameter 850Jlm F2-6
Table F3.l: Experimental Data for 6 g/L F3-l
Table F2.5:
Table F2.6:
Table F2.7:
Table F2.8:
Table F2.9:
Table F1.6:
Table F1.7:
Table F1.8:
Table F1.9:
Table F3.2: Experimental Data for 0.6 g/L.. F3-2
Table F4.l: Predicted Kinetic Data for Particle Diameter 850Jlmand Concentration
6 g/L F4-l
Table F4.2: Predicted Kinetic Data for Particle Diameter 600Jlmand Concentration
6 g/L F4-2
Table F4.3: Predicted Kinetic Data for Particle Diameter 850Jlmand Concentration
0.6 g/L F4-l
Table F4.4: Predicted Kinetic Data for Particle Diameter 600Jlmand Concentration
0.6 g/L F4-l
A Comparative Study of Contacting Equipment for the Recovery of Copper from a Cupric Sulphate
Solution xxv
List of Tables
APPENDIX G: MINI COLUMN TESTS
Table G1.1: Initial Conditions for Hydrogen Form at pH 3 GI-I Table G 1.2: End Conditions for Hydrogen Form, Feed pH 3 G I-I Table G1.3: Calculations for Mini Column Test with Initial Conditions from Table G 1.1..G 1-2 Table G2.1: Initial Conditions for Di Sodium Form, Feed pH 3 G2-1 Table G2.2: End Conditions for Di Sodium Form, Feed pH 3 G2-1 Table G2.3: Calculations for Mini Column Test with Initial Conditions from Table G2.l..G2-2 Table G3.1: Initial Conditions for Mono Sodium Form, Feed pH 3 G3-1 Table G3.2: End Conditions for Mono Sodium Form, Feed pH 3 G3-1 Table G3.3: Calculations for Mini Column Test with Initial Conditions from Table G3.l..G3-2 Table G4.1: Initial Conditions for Hydrogen Form, Feed pH 2.5 G4-1
Table G4.2: End Conditions Hydrogen Form, Feed pH 2.5 G4-1
Table G4.3: Initial Conditions for Di Sodium Form, Feed pH 2.5 G4-2 Table G4.4: End Conditions for Di Sodium Form, Feed pH 2.5 G4-2 Table G4.5: Initial Conditions for Mono Sodium Form, Feed pH 2.5 G4-3 Table G4.6: End Conditions for Mono Sodium Form, Feed pH 2.5 G4-3 Table G5.1: Initial Conditions for Hydrogen Form, Feed pH 2.04 G5-1 Table G5.2: End Conditions for Hydrogen Form, Feed pH 2.04 G5-1 Table G5.3: Initial Conditions for Di Sodium Form, Feed pH 2.04 G5-2 Table G5.4: End Conditions for Di Sodium Form, Feed pH 2.04 G5-2
Table G5.5 Mono Sodium Form, Feed pH 2.04 G5-3
Table G5.6: End Conditions for Mono Sodium Form, Feed pH 2.04 G5-3 Table G6.1: Initial Conditions for Hydrogen Form, Feed pH 1.59 G6-1 Table G6.2: End Conditions for Hydrogen Form, Feed pH 1.59 G6-1 Table G6.3: Initial Conditions for Di Sodium Form, Feed pH 1.59 G6-2 Table G6.4: End Conditions for Di Sodium Form, Feed pH 1.59 G6-2 Table G6.5: Initial Conditions for Mono Sodium Form, Feed pH 1.59 G6-3 Table G6.6: End Conditions for Mono Sodium Form, Feed pH 1.59 G6-3
APPENDIX H: MINIMUM FLUIDIZATION VELOCITY
Table H 1.1: Experimental Calculation of Minimum Fluidization Velocity H 1-1 Table H1.2: Theoretical Determination of Minimum Fluidization and Settling Velocity HI-2 Table H1.3: t-Test (Two-Sample Assuming Equal Variances) HI-3
ACo~parativeStudy of Contacting Equipment for the Recovery of Copper from a Cupric Sulphate
SolutIOn xxvi
List of Tables
APPENDIX I: COLUMN TESTS
Table ILl: Initial Conditions for Linear Velocity 0.13 cmls 11-1 Table 11.2: End Conditions for Linear Velocity 0.13 cmls 11-1 Table 11.3: Calculations for Column Tests with Initial Conditions from Table 11.1.. 11-2 Table 12.1: Initial Conditions for Linear Velocity 0.195 cmls 12-1 Table 12.2: End Conditions for Linear Velocity 0.195 cmls 12-1 Table 12.3: Calculations for Column Tests with Initial Conditions from Table 12.1.. 12-2 Table 13.1: Initial Conditions for Linear Velocity 0.41 cmls 13-1 Table 13.2: End Conditions for Linear Velocity 0.41 cmls 13-1 Table 13.3: Calculations for Column Tests with Initial Conditions from Table 13.1.. 13-2 Table 14.1 : Summary of Results obtained from Column Tests 14-1
APPENDIXJ:COMPARISON OF CONTACTING EQUIPMENTS AT 6 g/L
Table JI.1: Initial Conditions for Fixed Bed at 6 g/L JI-1
Table J1.2: End Conditions for Fixed Bed at 6 g/L JI-I
Table J1.3: Calculations for Fixed Bed Test with Initial Conditions from Table J1.1.. JI-2 Table J2.1 : Initial Conditions for Fluidized Bed at 6 g/L.. .12-1
Table J2.2: End Conditions for Fluidized Bed at 6 g/L J2-1
Table J2.3: Calculations for Fluidized Bed Test with Initial Conditions from Table J2.1.. .. J2-2
APPENDIX K: COMPARISON OF CONTACTING EQUIPMENTS AT 0.6 g/L
Table KLl: Initial Conditions for Fixed Bed at 0.6 g/L.. K1-1
Table K1.2: End Conditions for Fixed Bed at 0.6 g/L KI-1
Table KI.3: Calculations for Fixed Test with Initial Conditions from Table K1.1 KI-2 Table K2.1 : Initial Conditions for Fluidized Bed at 0.6 g/L.. K2-1 Table K2.2: End Conditions for Fluidized Bed at 0.6 g/L K2-1 Table K2.3: Calculations for Fluidized Bed Test with Initial Conditions from Table K2.1.K2-2
ACo~parativeStudy of Contacting Equipment for the Recovery of Copper from a Cupric Sulphate
SolutIOn xxvii
Chapter One: Introduction
CHAPTER ONE: INTRODUCTION
Extensive studies for various applications have been conducted on the use of ion exchange processes. The literature is extensive and can be broadly categorized:
• Fundamentals of Ion Exchange
• Applications of Ion Exchange
The "fundamentals of ion exchange" deals with the theory behind ion exchange principles and involve the selection of an ion exchange material (resin), equilibrium and kinetics whereas an
"application of ion exchange" deals with ion exchange at an industrial level.
1.1 Comparative Studies Conducted
Resins utilized in ion exchange processes have received extensive attention. The selection of the correct resin is of extreme importance to ensure that the recovery of the metal of interest is maximized. Research has been done on ion exchange materials and an effective resin was cho- sen. A number of comparative studies have been done.
An interesting study conducted by [U1manu] 35, examined a wide range of materials with ad- sorbent for use in the recovery of copper from solutions. The objective of the study was to iden- tify a cheap, naturally occurring and non-polluting substance to utilize in the removal process.
The synthetic zeolite ZSM-5 showed extensive promise.
A comparative study has been done by[Raghavan and Bhatt] 30to determine the most suitable resin for the recovery of copper, by comparing chelating resins with different functional groups in the presence of other metal ions. The need for the study was due to there being no compara- tive performance data available for different commercially available resins.
A recent study conducted by [Wyethe] 37 examined the removal of copper and zinc from a co- balt electrolyte. The research incorporated a comparative study of two types of resin by batch contact with synthetic solution to determine the optimum resin for this application.
From theses studies it is evident that the effect of pH (on weak acid cation resin) and feed flow rate are important to find the optimum. The column studies that formed a significant part of all work mentioned above was performed using fixed bed columns.
A Comparative Study of Contacting Equipment for the Recovery of Copper from a Cupric Sulphate
Solution 1
Chapter One: Introduction
Studies are available that describes contacting equipment for ion exchange processes and the literature available for the fixed bed system is extensive.
Articles published by[Vermeulem] 38and[Smith] 33discuss factors that effect ion exchange.
[Schmelzer] 31discusses the purpose behind fixed bed system.
Research conducted by [Moison] 26 using the Michae/s Concept for "exchange zone heights"
reveals a method for calculating heights of transfer units from ion exchange. [Moison] 26find- ings led to the conclusion that the results of one or two fixed bed experiments will serve as a good basis for designing equipment (for operation involving unfavourable equilibria).
[Coulson and Richardson] 2provide information on types of contacting equipment. [Craig] 21
also provides information on types of contacting equipment available but states that a compara- tive analysis on the different types of contacting equipment would require "comparative data from operations where each ion exchange system has been applied to almost identical feed wa- ters". The author refers that there is insufficient data in literature for a quantitative comparison of the different types of equipment.
However, some work has been done by researchers on comparisons of different types of con- tacting equipment. [Slater] 15 provides information on fixed bed and counter current systems.
[Celik] 20compares a fixed bed ion exchange column and a fluidized column for the removal of of ammonia by natural clays.
1.2 Study Conducted by Author
The following represents a brief summary of the theoretical and practical research covered by the author.
1.2.1 Definition of Ion Exchange and Purpose of this Study
Ion exchange is a reversible chemical reaction where an ion from a solution is exchanged for a similarly charged ion attached to a stationary medium (that is, ion exchange material). The resin is held in a column through which solution is passed, allowing exchange to occur[Internet]59.
The resin bed can be operated either in:
a down flow, in which case the bed is fixed, and solution is passed through the top of the column at a constant flow rate, or
b up flow, at a liquid velocity such that the particles are fluidized.
A Comparative Study of Contacting Equipment for the Recovery of Copper from a Cupric Sulphate
Solution 2
Chapter One: Introduction
A fixed bed is when a liquid (for this research cupric sulphate solution was used) is passed through a bed of fine particles at a low flow rate so that the liquid just percolates through the void spaces between stationary particles. If the liquid was passed upward and the flow rate was increased, the particles would move apart. At a still higher velocity, a point is reached where all the particles are just suspended by a upward flowing liquid. This is considered to be a fluidized bed.
When the resin capacity is reached, the exchanged ions can be removed by elution. Elution is the desorption of the adsorbed solute by a solvent. The desorption solvent is the eluant, and the effluent stream containing the desorbed solute and eluting solvent is the eluate.
Although most ion exchange operations whether in the laboratory or in plant-scale processes are carried out in columns using fixed bed, developments enable the use of fluidized beds to be es- tablished.
The main purpose of this research was to compare the performance of a fixed bed ion exchange column with a fluidized ion exchange column for the recovery of copper from a cupric sulphate solution. The need for this study arises because although the literature on ion exchange is exten- sive, comparative work on contacting equipment is limited.
1.2.2 Test Work Conducted
A separate chapter was dedicated to all the experimental procedures conducted during experi- mentation. This is located in Chapter Ten. To ensure that the objectives of this research were being met the following were conducted:
1.2.2.1 Choice of Resin
Research had been conducted to determine the most suitable resin for this application. This is discussed in great detail in chapter two. An in depth analysis of the resin was performed to de- termine the characteristics experimentally.
The following were determined experimentally:
• Average particle size of the resin.
• Water retention capacity.
• The percentage swelling of the resin converted into the mono sodium and di sodium forms.
• Void volume packed in a column.
A Comparative Study of Contacting Equipment for the Recovery of Copper from a Cupric Sulphate
~~ 3
Chapter One: Introduction
1.2.2.2 Preliminary Experimental Test Work
Since pH has an effect on weak cation resins, a pH test was included to determine the effect of pH on the loading of copper onto the resin.
Preliminary work was conducted to determine the equilibrium isotherms and kinetic response.
Equilibrium isotherms were established at four different pH values to determine the maximum exchange capacity of the resin. The experimental data obtained for each equilibrium isotherm was modelled with a Langmuir and Freundlich isotherm(Reference is made to Appendix E).
Kinetic response was determined by measuring the concentration as a function of time. Two particle sizes were used to determine the kinetic response. These are discussed in full detail in Appendix F.
1.2.2.3 Experimental Work
Mini column tests were conducted which involved the conversion of the resin into two other resin forms.
To enable efficient comparisons of the fixed and fluidized bed, one linear velocity was used to operate both contacting equipment. The choice of the linear velocity required the following con- siderations to be taken into account:
• Minimum fluidization, so that the particles are fluidized in the fluidized bed system.
[The Richardson and Zaki correlations enabled to compare experimental data with theo- retical data].
• Tests were performed using three other linear velocities to determine an optimum linear velocity for fixed bed system.
To enable a pilot plant to be designed a series of design considerations needed to be taken into account together with the preliminary experimental test work. The pilot plant for both contact- ing equipment are discussed together with a cost estimation located in Appendix B (Reference is made to Chapter Six). For each test the copper present in the effluent stream was determined by spectrophotometry principles (Reference is made to Chapter Seven). When the resin be- came exhausted, analysis was done to determine how much copper was loaded onto the resin by elution. The results from the pilot plant testing enabled designs of a full scale plant for each contacting equipment together with cost estimations.
A Comparative Study of Contacting Equipment for the Recovery of Copper from a Cupric Sulphate
Solution 4
Chapter Two: Ion Exchange Materials
CHAPTER
Two:
ION EXCHANGE MATERIALSIon exchange materials comprise of two main groups that is organic and inorganic exchangers.
Both groups comprise of synthetic and natural materials. Ion exchangers form a very heteroge- neous group of materials. Their only common feature is that they contain a fixed electric charge, which can bind counter ions with an opposite charge.
2.1 T he Phenomenon
An ion exchange reaction may be defmed as the reversible interchange of ions between a solid phase (the ion exchanger) and a solution phase; the ion exchanger is usually insoluble in the medium in which the exchange is carried out. If an ion exchanger MO A+, carrying cation A+ as the exchanger ions, is placed in an aqueous solution phase containing B+, an ion exchange reac- tion takes place which may be represented by Reaction 2.1.
(Reaction 2.1) solid solution solid solution
The equilibrium represented by the above equation is an example of cation exchange. In much the same way, anions can be exchanged provided that an anion receptive medium is employed.
An analogous representation of an anion exchange reaction may be written:
(Reaction 2.2) solid solution solid solution
S)ntboh
== cation exchanging Into ion exchange material
=
cation exchangingOut ionexchange material ==IonExchange Material Figure 2.1: Representation of Cation Exchange on an Ion Exchangeable Material[Adapted from Internet)66
A Comparative Study of Contacting Equipment for the Recovery of Copper from a Cupric Sulphate
~~ 5
Chapter Two: Ion Exchange Materials 2.2 Resin
Ion exchange resins are a type of synthetic resin manufactured by introducing functional groups into a three dimensional crosslinked polymer matrix. Ion exchange resins are classified accord- ing to their function as a cation exchanger, which have positively charged mobile ions available for exchange and anion exchangers, whose exchangeable ions are negatively charged. Both an- ion and cation resins are produced from the same basic organic polymers [Internet]59.
2.2.1 Types of Resin [Marcus]8
The types of resin available are discussed below.
2.2.1.1 Cation Exchange Resins
Cation exchange resins can be separated into two classes according to their functional groups:
2.2.1.1(a) Strong Acid Cation Resins
Strong acid resins are named because their chemical behaviour is similar to that of strong acids.
The resins are highly ionized in both the acid (R-S03H) and salt (R-S03Na) form.
2.2.1.1(b) Weak Acid Cation Resins
In a weak acid resin, the exchangeable groups are carboxylic acid (COOH) as opposed to the sulfonic acid group (S03H) used in strong acid resins. These resins behave similarly to weak organic acids that are weakly dissociated. Weak acid resins exhibit a much higher affmity for hydrogen ions than do strong acid resins. This characteristic allows for regeneration to the hy- drogen form with significantly less acid than is required for strong acid resins. Almost complete regeneration can be accomplished with stoichiometric amounts of acid. The degree of dissocia- tion of a weak acid resin is strongly influenced by the solution pH.
2.2.1.2 Anion Exchange Resins
Anion exchange resins can be separated into two classes.
2.2.1.2(a) Strong Base Anion Resins
Like strong acid resins strong base resins are highly ionized and can be used over the entire pH range. These resins are used in the hydroxide (OH) form for water deionization. These resins react with anions in solution and can convert an acid solution to pure water.
A Comparative Study of Contacting Equipment for the Recovery of Copper from a Cupric Sulphate
~~~ 6
Chapter Two: Ion Exchange Materials
2.2.1.2(b) Weak Base Anion Resins
Weak base resins are like weak acid resins, in that the degree of ionization is strongly influ- enced by pH. Consequently, weak base resins exhibit minimum exchange capacity above a pH of7.0.
The costs of modem ion exchange resins are relatively high. For large-scale application, special factors to minimize the quantity of resin required for a specific duty (example: high capacity), and to prolong the resin lifetime (example: chemical and physical stability) are immensely im- portant [Marcus]8.
2.2.2 Considerations When Choosing a Resin
Typically when choosing a resin for a specific purpose the following considerations need to be taken into account:
2.2.2.1 Typical Particle Shape and Size
Generally the resins are supplied water wet in the form of spherical beads having a particle di- ameter between the range of 0.30 and 1.2 mm. Powder resins are also available for specific re- quirements.
2.2.2.2 Total Capacity and Operating Capacity
The total available capacity or total exchange capacity of a resin, expressed in equivalents per unit volume, is a measure of all the functional groups on a resin [Rohm and Haas] 12. Test methods are available to measure the total exchange capacity of each type of ion exchange resin.
The total exchange capacity is not necessarily the same as the operating capacity. The actual operating capacity is usually lower than the total capacity for an ion exchange process such as in recovery or purification applications. Some of these factors affecting the operating capacity are total and relative ion concentrations, charge density of ions, flow rate, temperature, pH, regen- eration efficiency and equipment design.
2.2.2.3 BulkDensity and True Wet Density
Resin density is an important property because it determines the hydrodynamic behaviour in counter flow systems [Rohm and Haas]12. The bulk density is the weight of wet resin per unit volume. This density is measured in a calibrated glass column after backwashing the resin, al- lowing it to settle and draining off the water. The bulk density is specific for each resin and is dependent on the type of resin and ionic form.
A Comparative Study of Contacting Equipment for the Recovery of Copper from a Cupric Sulphate
Solution 7
Chapter Two: Ion Exchange Materials
The true wet density or specific gravity is determined on the wet resin. The resin sample is weighed and the volume is found by water displacement using a pycnometer. Values range from about 1.04 to about 1.25. Cation exchangers have a greater true wet density than anion exchang- ers.
2.2.2.4 Swelling and Shrinking
Ion exchange resins carry both fixed and mobile ions which are always surrounded by water molecules located in the interior of the resin beads. Water wet ion exchange resins shrink or swell when they change from one ionic form to another and they shrink when they are in contact with non-polar solvents. This research looked at the water retention capacity (how much water is in the pores of the resin) and the conversion of resin from the hydrogen form to the di sodium and mono sodium forms of the TP 207 resin.
drying
..
Figure2.2: Schematic Representationof Dryingand Swelling of a Resin Bead [Mitsubishi] 11
2.2.2.5 Stability
The resin bead needs to be stable when it is exchanging ions. Two types of stability are dis- cussed below:
2.2.2.5(a) Physical Stability
The polymeric beads of resins should be physically very stable. The sulfonic group of cation- exchange resins are extremely stable. Anion exchange resins are temperature sensitive.
2.2.2.5(b) Chemical Stability
Ion exchange resins are stable over the full range of pH. They are virtually stable to most inorganic or organic chemicals except for strong oxidants such as dissolved chlorine, ozone or peroxides.
ACo~parativeStudy of Contacting Equipment for the Recovery of Copper from a Cupric Sulphate
SolutIOn 8
Chapter Two: Ion Exchange Materials
2.2.2.6 Pressure Drop
The pressure drop is directly proportional to the flow rate, the viscosity of the feed, and the depth of the resin bed, and is inversely proportional to the square of the diameter of the resin beads. Usually one bar of pressure drop across a bed of ion exchange resin should not be ex- ceeded.
2.2.3 Resin Chosen: Lewatit TP 207 Weak acid Cation Resin
Studies were conducted by [Wyethe]37to determine the most selective and cost effective resin for copper recovery. The study involved the use of two other resins to select the best resin for copper recovery. The resin that was selected by [Wyethe]37was a Lewatit TP 207 resin. There- fore a TP 207 resin was chosen for all experimental work covered in this research.
2.2.3.1 Safety Data on Lewatit TP 207 (Weak acid Cation Resin)
TP 207 is a chelating weak acid cation resin. The resin contains functional groups which form chelates (complexes) with metal ions, binding them to the resin in the process. The functional group of the carboxylic type gives high chemical efficiency in many applications. This resin is used to selectively recover transitional metals from aqueous solutions. TP 207 is insoluble in acids, alkalis, and all common solvents. The ion exchange behaviour of the resins is chiefly de- termined by the fixed ionic groups. The number of groups determines the ion exchange capac- ity. The chemical nature of the groups greatly affects ion exchange equilibria. An important fac- tor is the acid or base strength of the groups. Weak acid groups such as -COO- are ionized at high pH. At low pH they combine with H+, forming an undissociated -COOH. The weak acid resin is pH dependant.
TABLE 2.1: Safety Data on Lewatit TP 207 Resin General Description
Ionic form, as shipped Na+
Functional Group iminodiacetic acid
Matrix cross linked polystyrene
Structure macroporous
Appearance beige, opaque
A Comparative Study of Contacting Equipment for the Recovery of Copper from a Cupric Sulphate
Solution 9
Chapter Two: Ion Exchange Materials
Chemical and Physical Properties
Bead size* min. 90% mm 0.4-1.25
Effective Size* mm 0.55(±0.05)
Uniformity coefficient* max 1.7
Bulk weight(±5%) g/L 800
Density approx. g/ml 1.18
Water Retention %wt 50-55%
Total capacity*(W -form) min.eq/L 2.4
Volume-change (Na+-+H+) approx. % -30
temperature range QC -20 up to 80
Stability
pH range 0-14
of product min years 2
Storability
temperature range QC -20 up to 40
Recommended Operating Conditions**
Operating temperature max. QC 80
Operating pH range 1.5-9
Bed depth min mm 1000
Pressure loss( 15 QC) perm/h approx. kPa/m 1.1
Pressure loss max. kPa 250
exhaustion max.m/h 40
Flow velocity
backwash (20 QC) approx. m/h 10
Regeneration with HCL H2S04
Level (form as shipped)
140 200
Co-Current approx. g/L
concentration % 4-10 5-15
regeneration approx. m/h 5
Flow velocity
Rinsing max. m/h 5
Conditioning with Mono-Na: Di-Na:
Level (form as shipped) g/L 40-48 80-96 Co-Current
concentration approx. % 4
conditioning approx. m/h 5
Flow velocity
rinsing min. m/h 5
Rinse water requirement approx. bed vol. 5
Bed Expansion (20 QC) per m/h approx. % 4
Freeboard (as % of resin volume) approx. 80
*These values are specification values and are subject to continuous monitoring.
A Comparative Study of Contacting Equipment for the Recovery of Copper from a Cupric Sulphate
Solution 10
Chapter Two: Ion Exchange Materials
**
The information given here refers to use of the product under normal operating conditions and is based on tests in pilot plant and data obtained from industrial installations. However, ad- ditional data are needed to calculate the resin volumes required for ion exchange units. These are to be found in our Technical Information Sheets.Note:
Safety data was obtained from the suppliers of the resin (Bayer).
ACo~parativeStudy of Contacting Equipment for the Recovery of Copper from a Cupric Sulphate
SolutIOn 11
Chapter Three: Ion Exchange Equilibria and Kinetics
CHAPTER THREE: EQUILmRIA
AND
KINETICS3.1 Ion Exchange Equilibrium
When a resin bead containing a mobile ion is placed in water containing a different ion of the same charge sign, an equilibrium situation wili be achieved when the thermodynamic chemical potential for each ion is the same inside and outside the resin. A plot of solute concentration in the resin against concentration in the solution is called an isotherm if temperature is held con- stant[Slater]15.
Two methods could be used for the equilibria tests namely:
• Batch Method
• Column Method 3.1.1 Batch Method
Aliquots of resin in a given form must be weighed. The resin is then added to known volumes of solution of constant ionic concentration. After mechanical agitation for several hours, samples of solution may be analyzed. This method is only suitable when the volume of the resin is much smaller than that of the solution, in the case of treating dilute solutions (that is 0.1 M or less).
Resin densities will be required for representation of concentrations on a resin volume basis.
3.1.2 Column Method
A quantity of known form resin is placed in a small column. A solution of known composition is then passed through the resin bed until the effluent has the same composition as the feed. The resin is then rinsed and then totally eluted. A sample of elute collected is used to calculate the resin composition. The batch method was used to do equilibrium testing on the resin.
3.2 Ion Exchange: Mass Balance
(The following analysis was used for pH, equilibrium and column testing.)
Initially: The resin is loaded into a column or batch(Refer to Figure 3.1). The volume of a che- lating resin depends on the pH of the resin. Thus, a resin volume to be used for a specific test is measured as a tapped volume at a specific pH. The resin has an initial volume referred to as V,o.
Excess copper solution is added to the resin. The copper solution has total copper concentration Co and an initial volume Vo.
A Comparative Study of Contacting Equipment for the Recovery of Copper from a Cupric Sulphate
Solution 12
Chapter Three: Ion Exchange Equilibria and Kinetics
Input: Copper Solution Co, Vo
Figure 3.1: Initial Conditions at the Start of Operation
When the copper comes into contact with the resin, ion exchange occurs. When the resin is fully loaded with copper the process is stopped.
At the end ofthe process:
• Some of the copper is adsorbed on the resin (The resin is saturated with copper.) and,
• the remainder of the copper is in solution.
The volume of resin which is adsorbed with copper Vc, is separated from the copper solution that has a volume Vs and a concentration Cc·
The resin that is loaded with copper is eluted with H2S04 solution (Refer to Figure 3.2). The copper solution that is recovered has a solution volume Veuand concentration Cel. The resin thus gets back to its initial form Vc. The accountability of the copper was calculated for all test work which is represented in Equation 3.1.
Accountability Amount of copper from solution + Amount of copper from elution Total amount of copper
... (Equation 3.1)
The above hypothesis was used to obtain the adsorbent concentration qe from adsorption which was obtained by mass balance (Reference is made to Equation 3.2) and compared to Qc from elution calculated as (mass of copper that was recovered / volume of resin that was eluted) for all tests.
A Comparative Study of Contacting Equipment for the Recovery of Copper from a Cupric Sulphate
Solution 13
Chapter Three: Ion Exchange Equilibria and Kinetics
The resin will get back to the H+ fonn
Volume of Copper Solution (Ce),Ycu)
Figure 3.2: Conditions at the End of Operation
qe = (Co
-ycJ * y
(Equation3.2)ro
Where
qe : is the adsorbate adsorbed per volume of adsorbent Co : initial concentration of Cu2+solution (adsorbate) Ce : final equilibrium concentration of adsorbate y :volume of liquid
Yro :volume of adsorbent (mL)
3.3 Adsorption Isotherm Models
Adsorption Isotherm Models
unfavourable
Concentration [gIL]
Figure 3.3: Plots of Adsorption Isotherm Models (Adapted from [Internet]39)
A Comparative Study of Contacting Equipment for the Recovery of Copper from a Cupric Sulphate
Solution 14
![Figure 2.2: Schematic Representation of Drying and Swelling of a Resin Bead [Mitsubishi] 11](https://thumb-ap.123doks.com/thumbv2/pubpdfnet/10631749.0/36.853.198.686.470.679/figure-schematic-representation-drying-swelling-resin-bead-mitsubishi.webp)
![Figure 3.4: Steps in an Ion Exchange Reaction (Adapted from [Environex] 3)](https://thumb-ap.123doks.com/thumbv2/pubpdfnet/10631749.0/46.844.135.746.115.777/figure-3-steps-ion-exchange-reaction-adapted-environex.webp)
![Figure 5.2: Graph of Pressure drop and Bed Height versus Superficial Velocity (Adapted from [Internet] S4)](https://thumb-ap.123doks.com/thumbv2/pubpdfnet/10631749.0/55.864.211.692.303.786/figure-graph-pressure-height-superficial-velocity-adapted-internet.webp)
![Figure 9.2: Exchange of Hard Water Ions for Soft Water Ions [Internet] 64](https://thumb-ap.123doks.com/thumbv2/pubpdfnet/10631749.0/67.826.181.684.188.634/figure-exchange-hard-water-ions-soft-water-internet.webp)