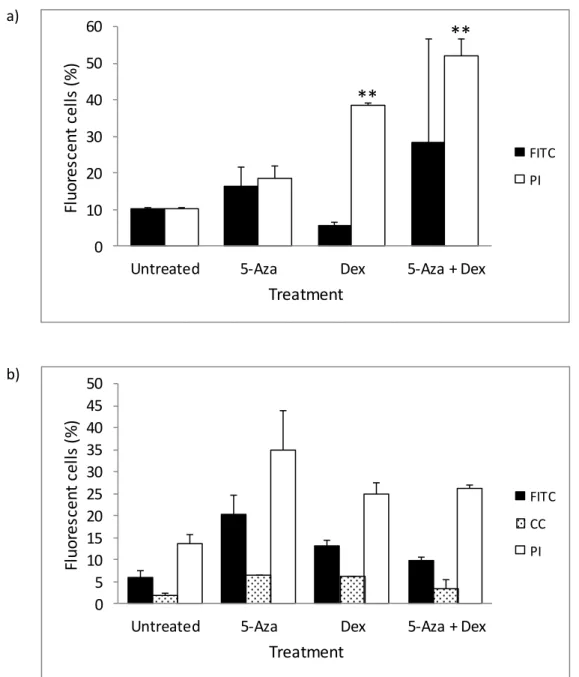
The same effect was observed with DMS 79 cells (p=0.003 and p<0.0005 respectively), with 5-aza appearing to enhance Dex-induced cell death. Additionally, although not significant, RU486 treatment appeared to inhibit 5-aza-induced apoptosis in DMS 79 cells.
INTRODUCTION AND LITERATURE REVIEW
Lung cancer
Small cell lung cancer
- Smoking and SCLC
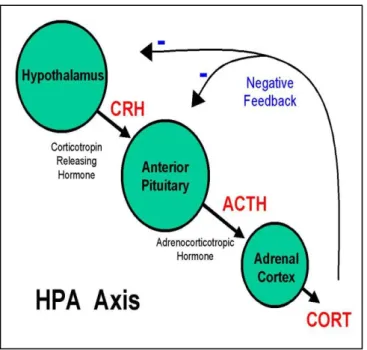
- The physiology of SCLC
Glucocorticoids (Gcs) normally inhibit ACTH secretion from the pituitary, however this does not occur with ectopic ACTH secretion from SCLC tumors and SCLC cell lines (Waters et al., . a) b) . 2004). Here, the secretion of ACTH peptides is resistant to the normal negative feedback of Gcs, leading to the development of ectopic ACTH syndrome (Ray et al., 1996).
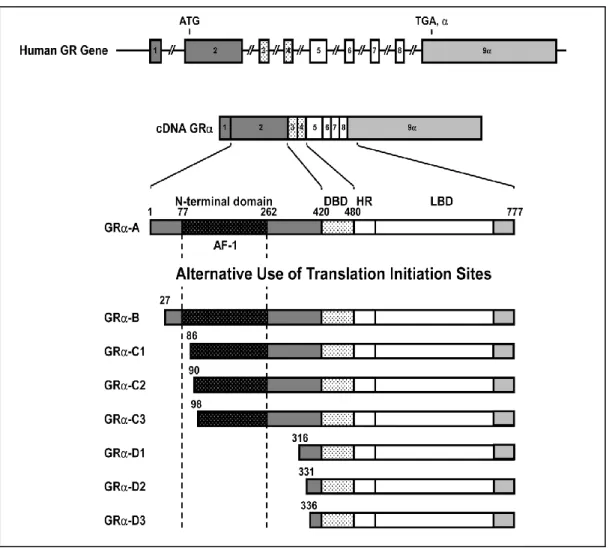
The glucocorticoid receptor
- The structure of the GR gene
- Regulation of the GR
- Effects of a synthetic Gc and anti-Gc
- Ligand-independent GR expression
- Resistance to Gc action in SCLC cells
A study by Bai et al. 1997) found that cPR phosphorylation is not absolutely required for ligand-independent activation. SCLCs are insensitive to negative feedback of the pro-hormone POMC by Gcs (Schlossmacher et al., 2011).
Apoptosis
- The extrinsic pathway
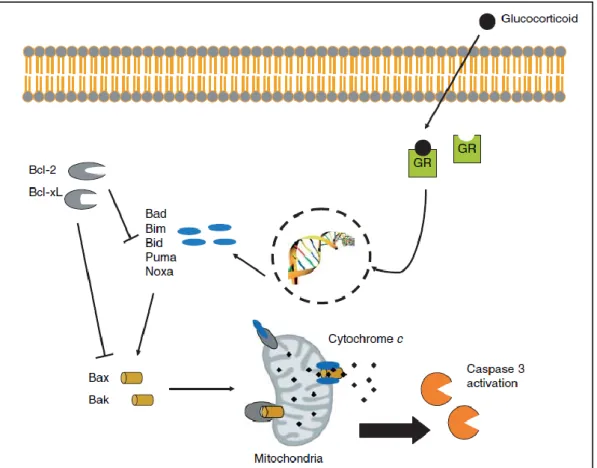
- The intrinsic pathway
- GR-mediated apoptosis
The intrinsic pathway is mediated by mitochondrial cytochrome c and members of the Bcl-2 family (Schmidt et al., 2004; Motadi et al., 2007). Restoration of GR in SCLC cells by retroviral overexpression was found to induce apoptosis in vitro through upregulation of the proapoptotic genes Bad and Bax (Sommer et al., 2007).
Epigenetic modifications
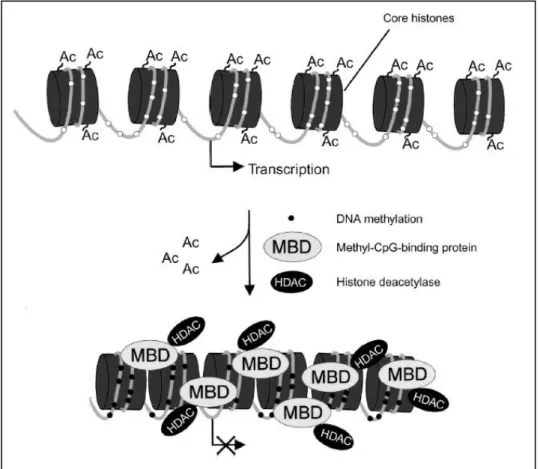
- Histone deacetylation
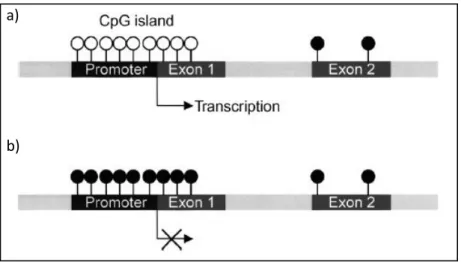
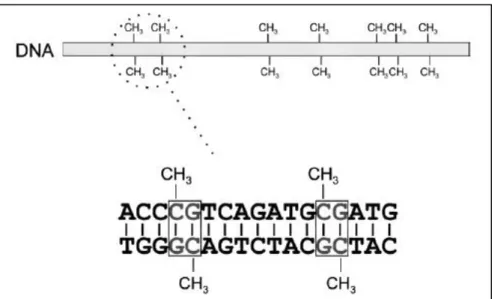
- DNA methylation
- Methyl-CpG binding domain proteins
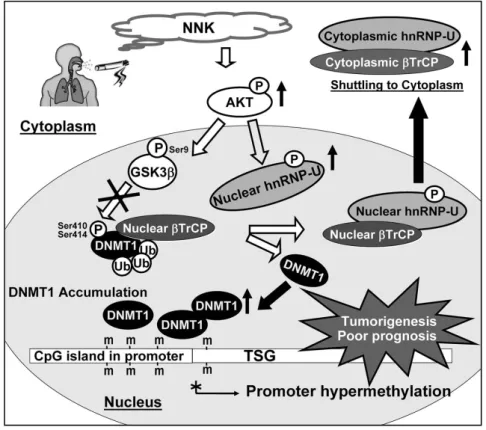
- The mammalian DNA methyltransferases
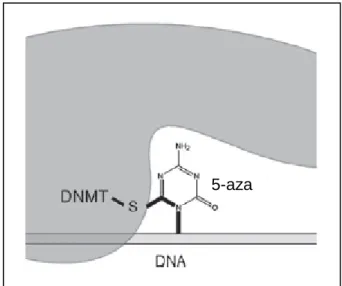
It is incorporated into the DNA of cells that share the 5' of the cytosine ring (the position of methylation). Treatment of the renal cancer cell lines with 5-aza resulted in re-expression of E-cadherin (Nojima et al., 2001).
Aim and objectives
It has also shown clinical efficacy in the treatment of acute myelogenous leukemia and chronic myelogenous leukemia (Christman, 2002; Lyko and Brown, 2005; Geutjes et al., 2012). Restoration of GR expression in SCLC cells by transfection or viral transduction is sufficient to restore Gc sensitivity (Ray et al. have shown that retroviral overexpression of GR induces apoptosis of SCLC cells both in vitro and also in a xenograft model (Sommer et al. al., 2010).
MATERIALS AND METHODS
Cell culture
- Cell lines
- Cell culture technique
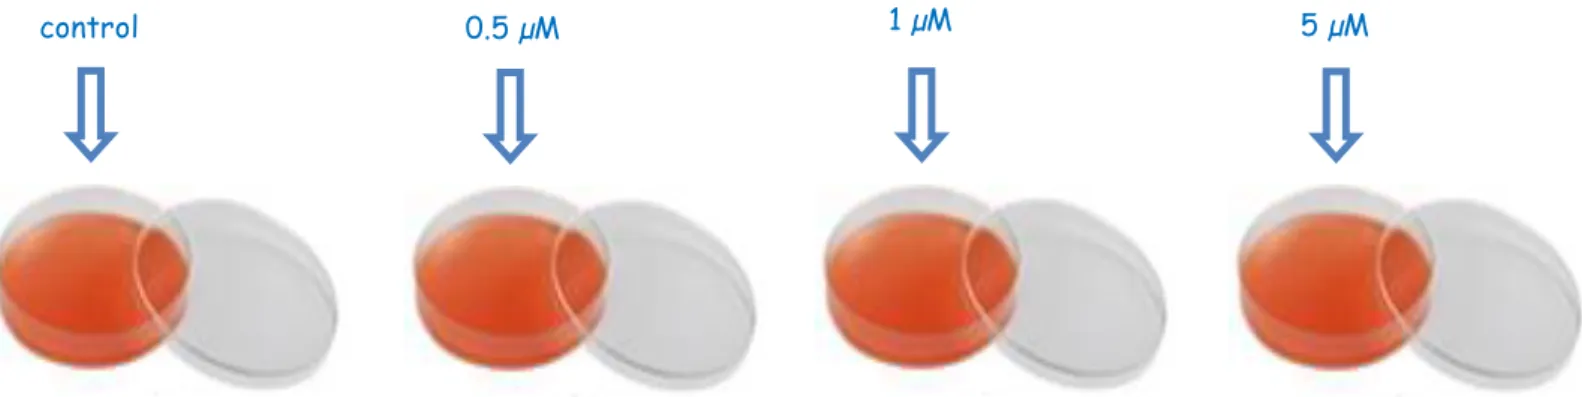
- Treatment with a DNA methyltransferase inhibitor (DNMTi)
For the vehicle control (Appendix B.iii), a 1:100 dilution of 50% filter sterilized in the appropriate cell culture medium was prepared. For immunoblots, protein was extracted from two 10 cm3 dishes per treatment for the HEK and A549 cells, whereas only one T75 flask per treatment was required for the DMS 79 cells.
RNA extraction
- Validation of RNA integrity
500 μL of Additional Buffer RPE was added to the RNeasy spin column and centrifuged at 8000 x g for 2 minutes and the flow-through discarded. The RNeasy spin column was placed in a new 2 ml collection tube and centrifuged at full speed for 1 min.
- cDNA synthesis using the High Capacity RNA-to-cDNA Master Mix
- cDNA synthesis using the Tetro cDNA Synthesis Kit
- Poly(A) tail priming
- First strand cDNA synthesis
RPE buffer was added to the RNeasy spin column to wash the spin column membrane, centrifuged for 15 s at 8000 x g and the flow-through discarded. 30 μL of RNase-free water was added to the spin column membrane and centrifuged for 1 min at 8000 x g to elute RNA.
Polymerase chain reaction (PCR)
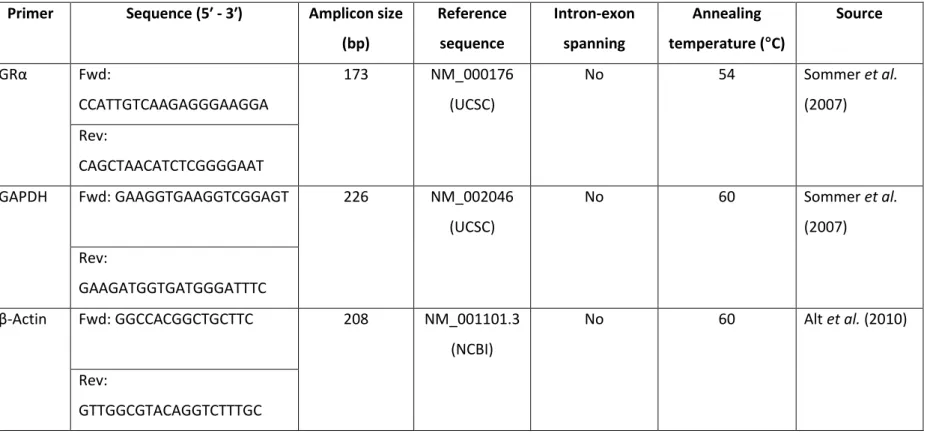
- Primers
- Conventional PCR
- Agarose gel electrophoresis
For each treatment of each cell line, a no-RT control was included in the experiment to assess sample contamination with genomic DNA. MWM, GeneRuler™ DNA Ladder Mix (0.5 µg/µL), was used in the first well of the gel and 12 µL of each sample was loaded into individual wells.
Quantitative real-time PCR (qPCR)
- qPCR experimental design
- qPCR using 5x HOT FIREPol® EvaGreen® qPCR Mix Plus (no ROX)
- qPCR using SYBR® Green JumpStart™ Taq ReadyMix™
- Analysis of qPCR reactions
- The 2 -∆∆CT method
- Validation of the 2 -∆∆CT method
- Statistical analyses of qPCR data
The relative fold change values of the treatments relative to the control were therefore obtained. The variance of the residuals must be equal in all treatments (residuals must be homoscedastic).
Immunoblot
- Protein extraction
- Preparation of the protease and phosphatase inhibitor cocktail
- Sample preparation
- Protein quantification
- Preparation of diluted BSA standards
- Preparation of the BCA working reagent (WR)
- Microplate preparation and reading
- Standard curve generation and calculation of protein concentration
- Western blot
- Acrylamide gel assembly
- Sample preparation
- PAGE gel electrophoresis
- Blotting
- Imaging the Western blot
- Densitometry
- Statistical analyses on densitometry
The soluble gel was then immediately added, very quickly, to the center of the glass plate with a 1 ml pipette (Gilson). A foam pad (Bio-Rad) was dipped in the protein transfer buffer and placed on the black half of the gel holder cassette. A sheet of Amersham™ Hybond™-ECL nitrocellulose membrane (GE Healthcare), also cut to size, was soaked in the protein transfer buffer and gently placed on top of the gel.
An additional four pieces of filter paper were soaked in the protein transfer buffer and placed on top of the nitrocellulose membrane.

Cell viability assay
- Plate preparation
- Plate reading and viability determination
- Statistical analyses of cell viability data
Flow cytometry
- Apoptosis and cell death analysis
- Sample preparation
- Apoptosis and cell death detection
- Pharmacological blockade
- GR activation
- GR antagonism
- Flow cytometry data analysis
- Statistical analyses of flow cytometry data
The cell samples were then gently vortexed and incubated for 15 minutes at room temperature (25°C) in the dark. The cell population was adjusted by electronic compensation of the applied voltage so that no cells fell into the areas of the graph where only cells stained with FITC Annexin V or PI would appear. The cell samples were prepared using the FITC Annexin V Apoptosis Detection Kit I protocol as in section 2.8.1.1, and the cell populations were detected as above in section 2.8.1.2.
To determine whether apoptosis was due to re-expression of GR, or due to re-expression of previously silenced genes, cells were treated with the GR antagonist RU486 (Sigma®) (Appendix D.iv).
Microscopy
- Apoptosis and cell death analysis
- Sample and slide preparation
- Apoptosis and cell death detection
- Pharmacological blockade
- GR activation and GR antagonism
- Analysis of microscopy data
- Statistical analyses of microscopy data
After centrifugation at 1400 rpm for 5 min, the supernatant was carefully removed and the cell pellets were resuspended in 200 µL of 1x Annexin V binding buffer. The cell pellets were resuspended in 50 µL DAPI (Appendix D.v), a nucleic acid stain, and incubated for 10 min at room temperature in the dark. The treated cells were then examined for blue fluorescence (455/70 nm) to visualize the cells, red fluorescence (613/20 nm) to determine the percentage of PI-positive cells, and green fluorescence (519/25 nm) to determine percentage of FITC Annexin V-positive cells.
Cell samples and slides were prepared as in Section 2.9.1.1 and cell populations were detected as above in Section 2.9.1.2.
RESULTS
Validation of RNA integrity
GRα mRNA expression
- Treatment with 5-aza had no effect on GRα mRNA expression in A549 cells
- Treatment with 5-aza had no effect on GRα mRNA expression in HEK cells
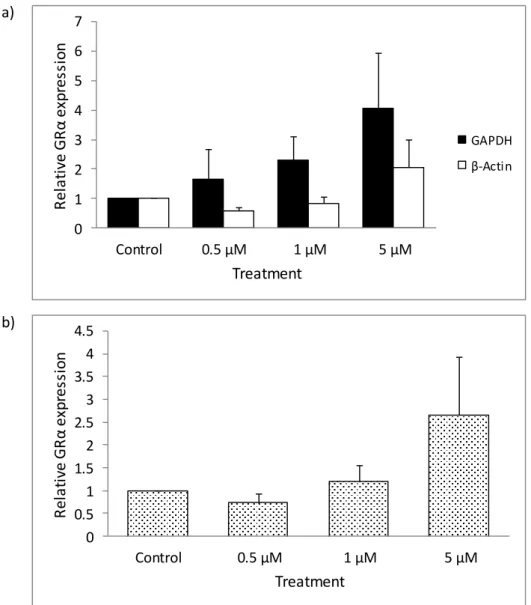
- Treatment with 5-aza had variable effects on GRα mRNA expression in DMS 79
- Using EvaGreen, 5-aza had no effect on GRα mRNA expression in DMS 79
- Using SYBR Green, 5-aza reduced GRα mRNA expression in DMS 79 cells 52
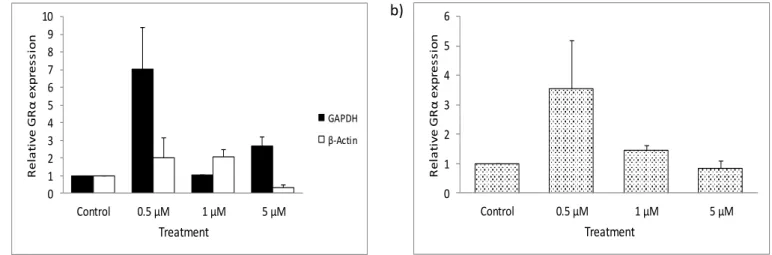
Negligible changes in GRα expression were observed when GRα was normalized to the geometric mean (Vandesompele et al., 2002) of GAPDH and β-actin (Fig. 3.4b). The relative fold change in GRα expression in GR-deficient HEK cells after 72 hours of 5-aza treatments. An upregulation in GRα expression was also seen with 5 µM 5-aza standardized to GAPDH and β-actin (Fig. 3.6a).
The relative fold change in GRα expression in A549, HEK, and DMS 79 cells normalized to GAPDH.
GRα protein expression
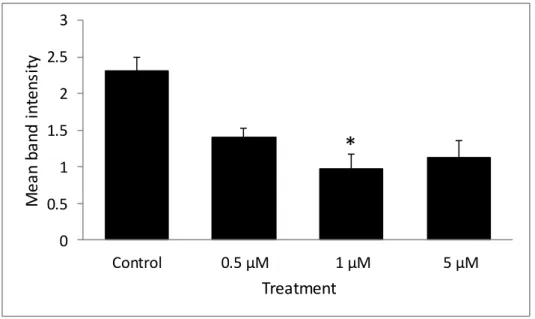
- Treatment with 5-aza negatively affected GRα protein expression in A549 cells 54
- Effect of 5-aza on GRα protein expression in A549 cells
- Treatment with 5-aza negatively affected GRα protein expression in HEK cells . 55
- Effect of 5-aza on GRα protein expression in HEK cells
- Treatment with 5-aza had no effect on GRα protein expression in DMS 79 cells 57
- Effect of 5-aza on GRα protein expression
Densitometric analysis of total GRα protein relative to GAPDH in HEK cells. indicates p < 0.05 compared to vehicle-treated control. There were also no significant differences in total GRα protein expression in the DMS 79 cells between the vehicle control, 0.5 µM, 1 µM and 5 µM 5-aza treatments (Fig. 3.15a). There were no significant differences in total GRα protein expression in the DMS 79 cells between the vehicle control, 0.5 µM, 1 µM and 5 µM 5-aza (Fig. 3.15b).
GRα protein expression was seen in response to treatment with 1 µM 5-aza, although it was not significant.
Cell viability
- Treatment with 5-aza had no effect on the viability of A549 cells
- Treatment with 5-aza had minimal effect on the viability of HEK cells
- Treatment with 5-aza had no effect on the viability of DMS 79 cells
The vehicle control, 1 µM and 5 µM 5-aza affected a negligible increase in the number of viable A549 cells compared to the untreated sample (Fig. 3.16). A small decrease in the number of viable cells was observed with 0.5 µM 5-aza, compared to both the untreated sample and the vehicle-treated cells (Fig. 3.16). There is a slightly higher number of viable cells in the vehicle control, 0.5 µM and 1 µM treatments, compared to the untreated sample (Fig. 3.16).
When treated with the vehicle control, a small increase in the number of viable cells was observed compared to untreated cells (Figure 3.16).
Apoptosis and cell death
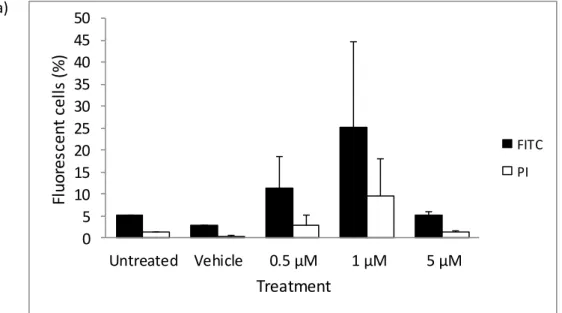
- Overall, treatment with 5-aza induced negligible apoptosis and cell death of HEK
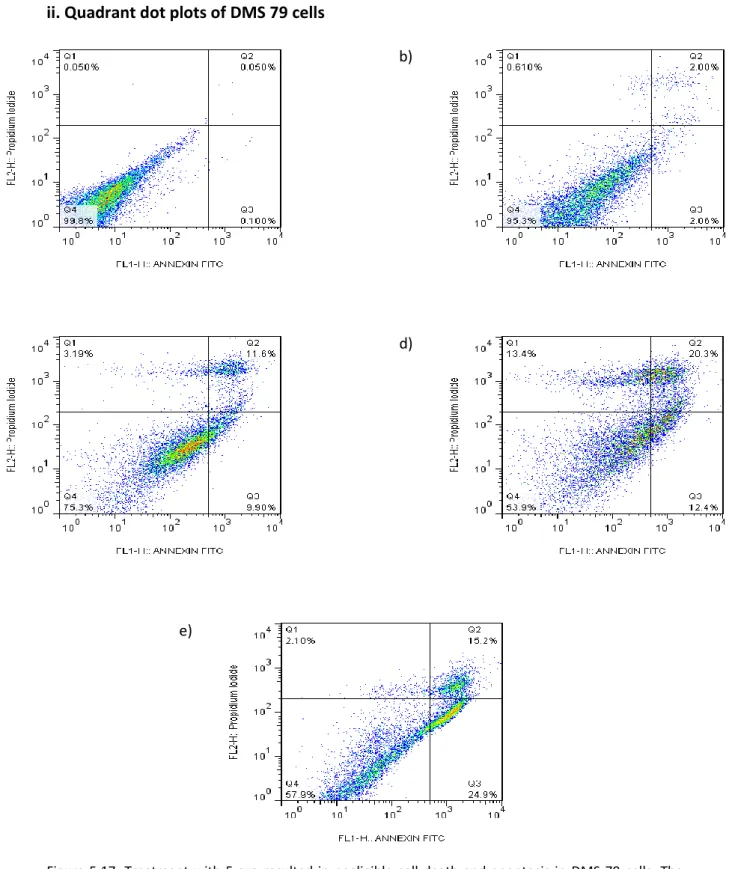
- In general, treatment with 5-aza induced apoptosis and cell death of DMS 79
None of the statistical tests reached significance, implying that treatment with 5-aza did not affect apoptosis of the HEK cells. Conversely, a greater proportion of the DMS 79 cells treated with 5 µM 5-aza stained positive for FITC Annexin V than PI (Fig. 3.18a). None of the statistical tests reached significance, indicating that treatment with 5-aza did not induce DMS 79 cell death.
Taken together, these results indicate that treatment with 5-aza induced cell death and apoptosis of the DMS 79 cells.
Pharmacological blockade
- Treatment with a GR agonist
- In HEK cells, neither Dex, nor Dex and 5-aza significantly affected
- In DMS 79 cells, 5-aza appeared to enhance cell death induced by Dex
- Treatment with a GR antagonist
- In HEK cells, RU486 treatment in conjunction with 5-aza had negligible
- In general, RU486 treatment appeared to inhibit apoptosis induced by 5-
5-Aza accelerated Dex-induced cell death in DMS 79 cells when analyzed by flow cytometry but not by microscopy. Treatment with RU486 in conjunction with 5-azo had negligible effects on apoptosis but induced HEK cell death. Therefore, treatment with RU486 in combination with 5-azo induced significant HEK cell death.
Overall, RU486 treatment and RU486 treatment in combination with 5-aza induced cell death.
DISCUSSION
- The effect of a demethylating agent on GRα mRNA expression in A549, HEK and DMS 79
- The effect of a demethylating agent on GRα protein expression in A549, HEK and DMS
- GRα isoform expression in A549, HEK and DMS 79 cells
- The effect of demethylation on GRα protein expression in A549, HEK and DMS
- The effect of demethylation on A549, HEK and DMS 79 cell viability
- The effect of a demethylating agent on HEK and DMS 79 cell death and apoptosis
- The effect of a demethylating agent on apoptosis of HEK and DMS 79 cells
- The effect of a demethylating agent on HEK and DMS 79 cell death
- The effect of a GR agonist on HEK and DMS 79 cell death and apoptosis
- The effect of a GR agonist on apoptosis of HEK and DMS 79 cells
- The effect of a GR agonist on HEK and DMS 79 cell death
- The effect of a GR antagonist on HEK and DMS 79 cell death and apoptosis
- The effect of a GR antagonist on apoptosis of HEK and DMS 79 cells
- The effect of a GR antagonist on HEK and DMS 79 cell death
- Summary
- Conclusion
- Future prospects
Thus, treatment with 5-aza had no effect on re-expression of endogenous GRα protein in the DMS 79 cells. In conjunction with the flow cytometry data, it is believed that treatment with 1 µM and 5 µM 5-aza induced apoptosis of the DMS 79 cells. It is expected that apoptosis in the DMS 79 cells was induced by suppression of the pro-survival gene, Bcl-2 (Kay et al., 2011).
Treatment with RU486 alone and in combination with 5-aza induced significant cell death of the DMS 79 cells (Fig. 3.22a).
APPENDIX
MIQE checklist
- Experimental design
- Sample information
- Nucleic acid extraction
- Reverse transcription
- qPCR target gene and primer information
- qPCR protocol
- qPCR validation
- Data analysis
After treating the A549 cells with varying concentrations of 5-aza for 72 h, RNA was extracted from the cells using the RNeasy Mini Kit. The reaction efficiency of the gene of interest (GRα) should be equal to the reference genes, GAPDH and β-actin (Livak and Schmittgen, 2001). Amplification of the NTC samples resulted in the formation of either primer dimers or no amplification at all.
Amplification of the non-RT samples resulted in the formation of primer dimers, or there was no amplification at all.
General recipes
The ethidium bromide stock solution was diluted 1:200 in di.H2O to make a working solution of 0.05 mg/mL. DEPC-treated ethidium bromide was added to the solution, followed by 10x MOPS buffer and deionized formaldehyde. The ethidium bromide stock solution was diluted 1:200 in 1x TBE buffer to make a working solution of 0.05 mg/mL.
Immunoblot recipes
Recipes for flow cytometry and microscopy
The Tris buffer and distilled H2O were added to a beaker placed on a magnetic stirrer and heated to 60 °C. The mowiol was then added to the solution and the beaker was covered with foil. The glycerol and DABCO were then added to the mixture which was reheated to 60 °C and stirred until the reagents dissolved.
Flow cytometry quadrant dot plots
Cells were then analyzed by flow cytometry for viability by PI, and apoptosis by FITC Annexin V.
Microscopy images
LITERATURE CITED
Loss of glucocorticoid receptor expression through DNA methylation prevents glucocorticoid-induced apoptosis in human small cell lung cancer cells. Human small cell lung cancer cell lines expressing the proopiomelanocortin gene have abnormal glucocorticoid receptor function. Glucocorticoid receptor overexpression promotes apoptosis of human small cell lung cancer in vivo and thereby slows tumor growth.
Quantitative analysis of DNA methylation profiles in lung cancer identifies aberrant DNA methylation of specific genes and its association with gender and cancer risk factors.