Evaluation of Elite Heat and Drought Tolerant Wheat (Triticum aestivum) Genotypes Based on Drought Tolerance and Water-Use
Efficiency Parameters
by
Tshikunde Nkhathutsheleni Maureen
Submitted in partial fulfilment of the academic requirements of Master of Science
Crop Science
School of Agricultural, Earth and Environmental Sciences
College of Agriculture, Engineering and Science University of KwaZulu-Natal
Pietermaritzburg South Africa
September 2019
Abstract
Drought stress is one of the most important limiting factors to sustainable and profitable wheat production in sub-Saharan Africa (SSA), including South Africa. Use of drought adapted genetic resources is regarded to be the most economic and environmentally friendly approach to mitigating the adverse effects of heat and drought stress. Therefore, there is need to select desirable wheat genotypes with enhanced water-use efficiency and drought tolerance parameters to boost wheat production in water-limited environments. Genotypes with enhanced drought-tolerance and water- use efficiency can be developed targeting yield-related agronomic and physiological traits which are well-correlated with grain yield potential. Therefore, the objectives of this study were: 1) to determine drought tolerance of dryland wheat genotypes based on leaf gas exchange and water-use efficiency in order to identify promising genotypes for drought tolerance breeding and 2) to examine associations between morphological and physiological traits of selected wheat genotypes under drought stress in order to identify unique traits that may be used as direct or indirect selection criteria for improving water-use efficiency and drought tolerance in wheat.
In the first study, leaf gas exchange and water use efficiency of ten genetically diverse wheat genotypes were tested under water-stressed and non-stressed conditions.
Results showed high significant differences (P < 0.001) in water condition x genotypes interaction with regards to net photosynthetic rate (A), the ratio of net CO2 assimilation rate and intercellular CO2 concentration (A/Ci), the ratio of intercellular and atmospheric CO2 (Ci/Ca), intrinsic water-use efficiency (WUEi), instantaneous water- use efficiency (WUEinst) and water-use efficiency (WUE). This suggests that genotypic variability of wheat exists for these traits. Heat and drought tolerant wheat genotypes such as G339 and G334 were identified and selected for breeding for enhanced drought tolerance possessing suitable physiological traits such as high A, transpiration rate (T), stomatal conductance (gs), A/Ci, WUEi and WUEinst under drought stress condition.
In the second study, response of wheat genotypes were assessed based on morpho- physiological traits and water use efficiency under water-stressed and non-stressed conditions. Significant differences (P< 0.05) were observed among the tested wheat genotypes with regards to the number of productive tillers (NT), number of leaves per
plant (NL), total dry mass (DM), leaf area index (LA), leaf area ratio (LAR), A, gs, T, WUEinst, WUEi, WUE. Pearson’s correlation analysis indicated that NL, NT, plant height (PH), DM, grain yield (GY), A were positively and significantly correlated with WUEinst. Instantaneous water use-efficiency positively correlated with NL (r = 0.76; P < 0.001), NT (r = 0.67; P = 0.03), PH (r = 0.72; P = 0.01), DM (r = 0. 81; P < 0.001) and GY (r = 0.70; P = 0.02) under water stress (WS) condition. Wheat genotypes namely: G339, G343 and G344 which exhibited high NT and DM under WS condition were selected with enhanced water-use efficiency.
Overall, the present study evaluated and selected drought tolerance wheat genotypes that can be used to improve wheat grain yield under water stress conditions.
Furthermore, morphological traits (NT and DM) and physiological traits (A, T, gs, A/Ci
and WUE) well-associated with water-use efficiency were detected. These traits can be used as direct and indirect selection criteria in dry land wheat improvement programmes.
Declaration
I, Tshikunde Nkhathutsheleni Maureen declare that:
(i) The research reported in this dissertation, except where otherwise indicated or acknowledged, is my original work;
(ii) This dissertation has not been submitted in full or in part for any degree or examination to any other university;
(iii) This dissertation does not contain other persons’ data, pictures, graphs or other information, unless specifically acknowledged as being sourced from other persons;
(iv) This dissertation does not contain other persons’ writing, unless specifically acknowledged as being sourced from other researchers. Where other written sources have been quoted, then:
a) Their words have been re-written, but the general information attributed to them has been referenced;
b) Where their exact words have been used, their writing has been placed inside quotation marks, and referenced;
(v) Where I have used material for which publications followed, I have indicated in detail my role in the work;
(vi) This dissertation is primarily a collection of material, prepared by me, published as journal articles or presented as a poster and oral presentations at conferences. In some cases, additional material has been included;
(vii) This dissertation does not contain text, graphics or tables copied and pasted from the Internet, unless specifically acknowledged, and the source being detailed in the dissertation and in the References sections.
Signed:
___________________________________________________________________
Tshikunde N.M
As the student’s supervisors, we agree to the submission of this dissertation:
Prof. Hussein Shimelis (Supervisor)
Dr Alfred O. Odindo (Co-Supervisor)
Acknowledgments
My supervisor Prof Hussein Shimelis, for his support and words of encouragement during the period of the study. I genuinely appreciate the time and efforts you dedicated into making this work successful. Thank you for supporting with the research funds and bursary through the National Research Foundation.
My co-supervisor Dr Alfred Odindo, for dedicating his time from the beginning of this project. Thank you, for always making time to read and making valuable input to this work.
Dr Jacob Mashilo, for willingly making yourself available for consultation, assistance in data analysis. Thank you for taking time out of your busy schedule to reading the draft the manuscripts and the draft dissertation. I will forever be indebted to you.
My Parents Takalani and Azwihangwisi Tshikunde, for supporting my study. My siblings, Thina, Thivhi, Thendo and Mpho, for encouragements and advise to never to give up even when giving up seemed easier than going on, I got nothing but love for you.
The National Research Fund (NRF) for financing this study and the University of KwaZulu-Natal for providing research facilities.
Lastly “If it had not been for the Lord on my side, where would I be”?
Dedication This work is dedicated to my Family.
Table of contents
Abstract... i
Declaration ... iii
Acknowledgments ... v
Dedication ... vi
Table of contents ... vii
List of figures ... xii
List of tables ... xiii
Publications Pertaining to This Dissertation ... xv
Introduction to dissertation ... 1
Background ... 1
Rationale of the study ... 2
Aim of the study ... 3
Specific objectives of the study ... 3
Research hypotheses ... 3
Dissertation Outline ... 4
References ... 5
CHAPTER 1: Literature Review ... 8
Agronomic and physiological traits, and associated quantitative trait loci (QTL) affecting yield response in wheat (Triticum aestivum L.): A review ... 8
Abstract ... 8
Introduction ... 9
Global wheat production and yield gains ... 10
Use of agronomic traits in phenotyping wheat ... 15
1.4.1 Early flowering and maturity ... 15
1.4.2 Plant height ... 17
1.4.3 Harvest index ... 20
1.4.4 Biomass production ... 21
1.4.5 Kernel weight ... 22
1.4.6 Number of grains per spike ... 23
1.4.7 Spike fertility ... 24
1.4.8 Number of productive tillers ... 25
1.4.9 Leaf morphology and its component traits ... 25
Phenotyping based on physiological traits in wheat ... 28
1.5.1 Canopy temperature ... 28
1.5.2 Chlorophyll content ... 28
1.5.3 Enhanced photosynthetic capacity ... 29
1.5.4 Water soluble carbohydrates ... 30
Water use efficiency ... 31
Wheat genetic resources for improving wheat grain yield genetic gains ... 32
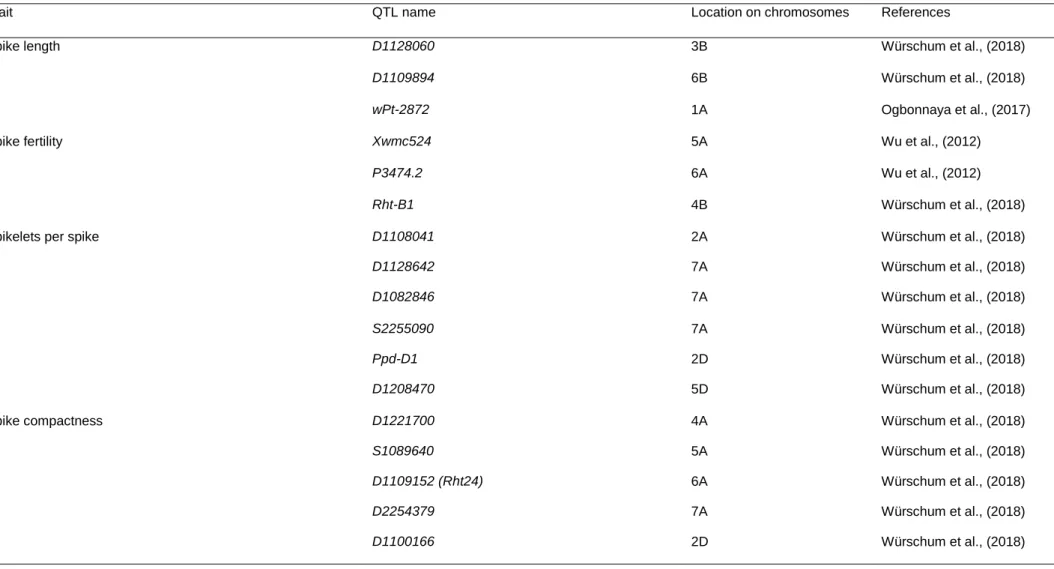
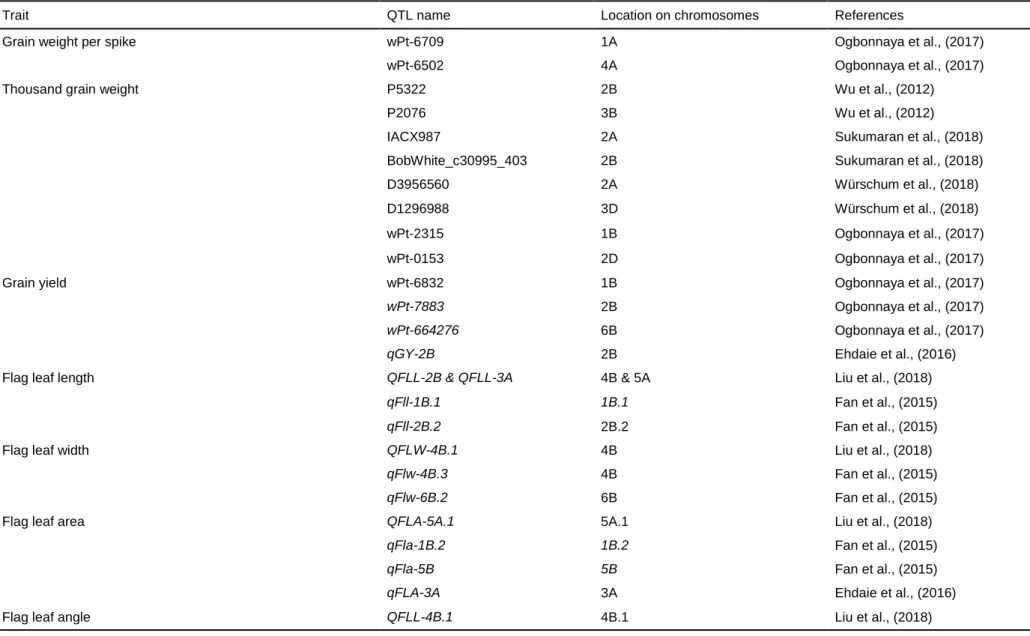
Quantitative trait loci (QTLs) associated with agronomic and physiological traits in wheat ... 33
Conclusion and future prospects ... 40
References ... 41
CHAPTER 2 ... 62
Leaf gas exchange and water-use efficiency of dry-land wheat genotypes under water stressed and non-stressed conditions... 62
Abstract ... 62
Introduction ... 63
Materials and methods ... 64
2.3.1 Planting materials ... 64
2.3.2 Study site ... 65
2.3.3 Experimental design and crop establishment ... 65
Data collection ... 68
2.4.1 Soil moisture content ... 68
2.4.2 Leaf gas exchange parameters ... 68
2.4.3 Data analysis ... 69
Results ... 70
2.5.1 Soil water content ... 70
2.5.2 Effect of genotype, water condition and genotype × water condition interaction on leaf gas exchange variables, water-use efficiency and grain yield ... 71
2.5.3 Effect of water stress on leaf gas exchange parameters, water-use efficiency and grain yield of wheat genotypes ... 73
2.5.4 Associations among variables... 78
2.5.5 Principal component analysis... 80
Discussion ... 87
References ... 90
CHAPTER 3 ... 95
Morpho-physiological traits associated with water-use efficiency in selected dry land wheat (Triticum aestivum L.) genotypes ... 95
Introduction ... 96
Materials and methods ... 98
3.2.1 Plant materials ... 98
3.2.3 Experimental design and crop establishment ... 99
Data collection ... 99
3.3.1 Morphological traits ... 99
3.3.2 Yield and yield components ... 100
3.3.3 Physiological traits ... 100
Data analysis ... 101
3.4.1 Analysis of variance ... 101
3.4.2 Correlation analysis ... 101
3.4.3 Estimation of genetic parameters ... 101
3.4.4 Principal component analysis... 102
Results ... 102
3.5.1 Soil water content ... 102
3.5.2 Effect of genotype, water-stress and genotype x water condition interaction effect on morphological and physiological traits ... 103
3.5.3 Mean response of wheat genotypes for selected morphological traits under non-stressed and water-stressed conditions ... 105
3.5.4 Mean response of wheat genotypes for some physiological traits under non-stressed and water-stressed conditions ... 109
3.5.5 Associations among morphological and physiological traits ... 112
3.5.6 Estimates of genetic parameters amongst studied morphological traits under non-stressed and water-stressed conditions ... 115
3.5.7 Principal component analysis... 117
Discussion ... 118
3.6.1 Morphological response of wheat under water-stressed and non- stressed conditions ... 119
3.6.2 Broad-sense heritability and genetic advances of morphological
traits... 120
3.6.3 Association among morpho-physiological traits with water-use efficiency among wheat genotypes ... 122
3.6.4 Principal component analysis involving morpho-physiological traits... 124
3.6.5 Conclusions ... 124
References ... 125
An overview of the research findings ... 132
Introduction and objectives of the study ... 132
Objectives of the study ... 132
Research findings in brief: ... 132
Leaf gas exchange and water-use efficiency of dry-land wheat genotypes under water stress and non-stressed conditions ... 132
Morpho-physiological traits associated with water-use efficiency in selected dry land wheat (Triticum aestivum L.) genotypes ... 133
Implications of the research findings ... 133
References ... 134
List of figures
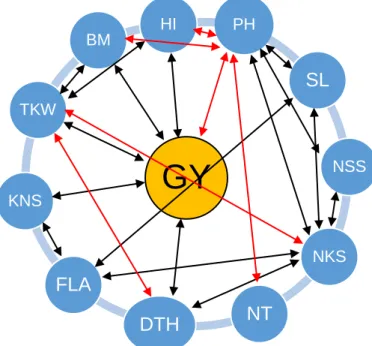
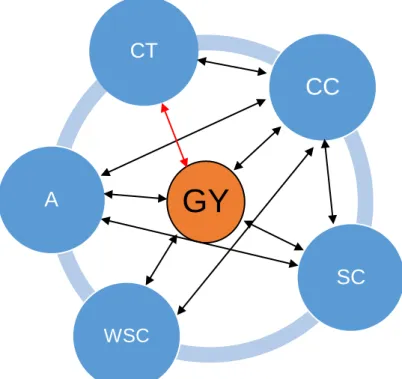
Figure 1. 1: Associations between grain yield and its components in wheat. ... 26 Figure 1. 2: Associations between grain yield and physiological traits and between physiological traits in wheat.. ... 31 Figure 2. 1: Mean volumetric soil moisture content (%) of wheat genotypes grown
under non-stressed and water-stressed conditions……… 70 Figure 2. 2: Rotated principal component scores and percent explained variance
of PC1 vs PC2, PC1 vs PC3 and PC2 vs PC3 showing the grouping of wheat genotypes based on leaf gaseous exchange parameters, water-use efficiency and grain yield under non-stress and water stress conditions.. ... 82 Figure 3. 1: Mean volumetric soil moisture content (%) of wheat genotypes grown
under non-stressed and water-stressed conditions………
103
Figure 3. 2: Mean values for some physiological traits among 10 wheat genotypes tested under non-stressed and water-stressed conditions…. ... 112
List of tables
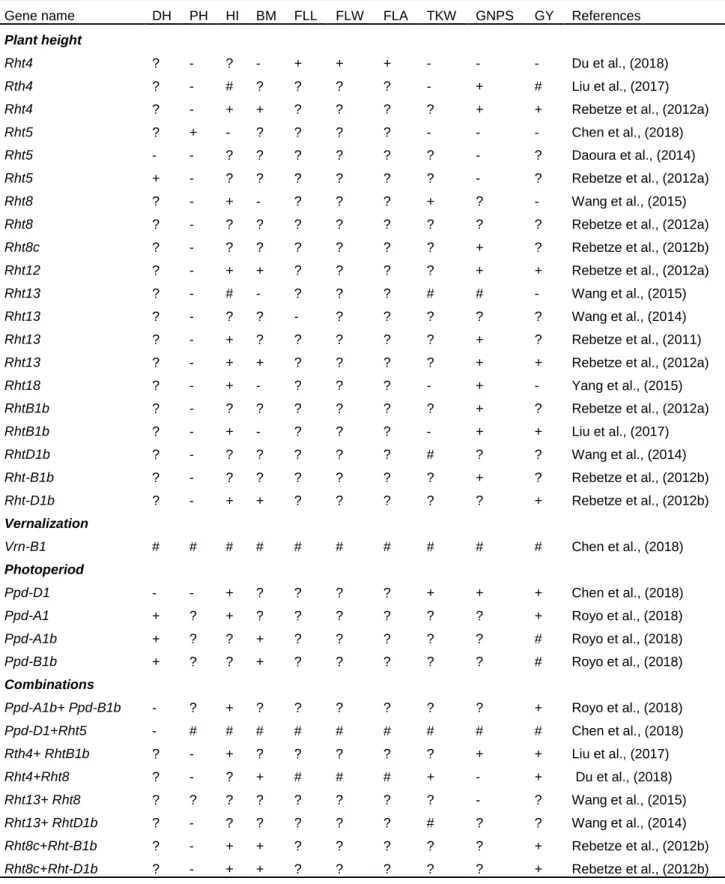
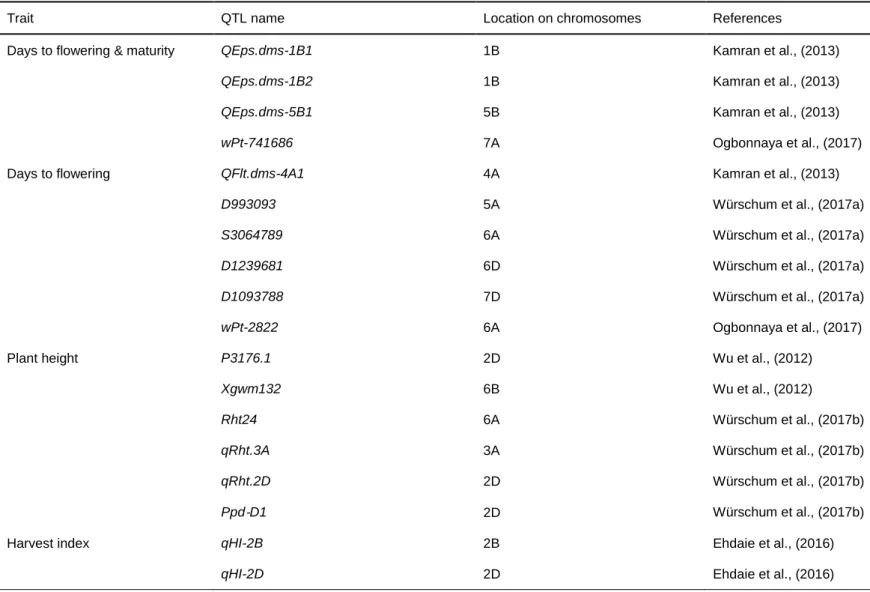
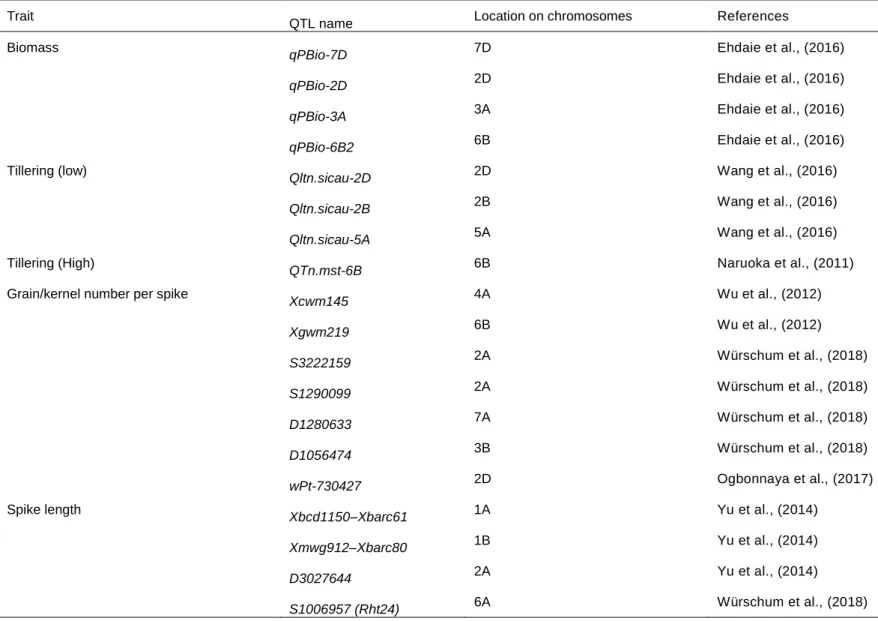
Table 1. 1: Global yield gains in wheat from 1874 to 2014. ... 12 Table 1. 2: Increased (+), reduced (-), no change (#) or not yet known (?) effect of selected height reducing, photoperiod and vernalization genes on key agronomic traits in wheat. ... 27 Table 1. 3: Key agronomic traits and their quantitative trait loci (QTLs) in wheat. ... 35 Table 1. 4: Quantitative trait loci (QTLs) of some physiological traits in wheat. 39
Table 2. 1: Names and pedigree information of 10 wheat genotypes used in the present study. ... 65 Table 2. 2: Chemical composition of the soil used in the study. ... 67 Table 2. 3: Analysis of variance showing mean squares and significance test of leaf
gaseous exchange parameters, water-use efficiency and grain yield of the 10 wheat genotypes tested under non-stress and water-stress conditions. ... 72 Table 2. 4: Leaf gaseous exchange parameters, water-use efficiency and grain yield of
wheat genotypes grown under non-stress and water stress conditions. ... 75 Table 2. 5: Pearson’s correlation co-efficient (r) describing the association between leaf
gaseous exchange parameters, water-use efficiency and grain yield of 10 selected wheat genotypes under non-stress (lower diagonal) and water stress (upper diagonal) conditions. ... 79 Table 2. 6: Principle component analysis showing eigenvectors, eigenvalues, and percent variance of leaf gas exchange, water-use efficiency and grain yield of selected 10 wheat genotypes under non-stress and water stress conditions. ... 81 Table 2. 7: Rotated principal component scores and percent explained variance of PC1 vs PC2, PC1 vs PC3 and PC2 vs PC3 showing the grouping of wheat
genotypes based on leaf gaseous exchange parameters under water stress conditions. ... 84 Table 2. 8: Rotated principal component scores and percent explained variance of PC1 vs PC2, PC1 vs PC3 and PC2 vs PC3 showing the grouping of wheat genotypes based on leaf gaseous exchange parameters under non-stress conditions. ... 85
Table 3. 1: Names and pedigree information of 10 wheat genotypes used in the present study………. 98 Table 3. 2: Analysis of variance showing mean square values and significance
tests of morpho-physiological parameters of the 10 wheat genotypes tested under non-stressed and water-stressed conditions. ... 104 Table 3. 3: Mean values for selected morphological traits of 10 wheat genotypes tested under non-stressed and water-stressed conditions. ... 107 Table 3. 4: Pearson’s correlation co-efficient (r) describing the association between morphological and physiological traits of 10 selected wheat genotypes under non-stressed (lower diagonal) and water-stressed (upper diagonal) conditions. ... 114 Table 3. 5: Estimates of variance components, genotypic and phenotypic coefficients of variation, broad-sense heritability and genetic advance of morphological traits assessed among 10 wheat genotypes under non-stressed and water-stressed conditions. ... 116 Table 3. 6: Principal component analysis showing eigenvectors, eigenvalues, and percent variance of morphological and physiological traits of selected 10 wheat genotypes under non-stressed and water-stressed conditions. ... 118
Publications Pertaining to This Dissertation Chapter one
Tshikunde N.M., Odindo A., Shimelis H., Mashilo J. (2019) Agronomic and physiological traits, and associated quantitative trait loci (QTL) affecting yield response in wheat (Triticum aestivum L.): A review. Under review in Crop Science.
Chapter two
Tshikunde N.M., Odindo A., Shimelis H., Mashilo J. (2018) leaf gas exchange and water-use efficiency of dry-land wheat genotypes under water stressed and non- stressed conditions. Acta Agriculturae Scandinavica, Section B- Soil and Plant Science. 68:738-748.
Chapter three
Tshikunde N.M., Odindo A., Shimelis H., Mashilo J. (2019) Morpho-physiological traits associated with water-use efficiency in selected dry land wheat (Triticum aestivum L.) genotypes. Under review in South Africa Journal of Plant and Soil.
Introduction to dissertation Background
Wheat (Triticum aestivum L., 2n=6x=42) is one of the most important cereal crops cultivated globally (Abdullah et al., 2011). It is high in minerals, vitamins, carbohydrates and proteins (FAO 2002). In South Africa, the area under wheat cultivation decreased from 805 000 ha to 450 000 ha during 2001 and 2015 production periods. However, the total production increased by over 80% with an average yield of 3.5 million tons per year during the same period (DAFF, 2015). The decline in planted area is attributed to several factors including erratic and poorly distributed rainfall (Dube et al., 2015). The increase in yield is attributed but not limited to the use of improved agricultural practices and technology such as fertilizer application, improved water conservation strategies, and cultivation of high yielding and drought tolerant wheat genotypes (Dube et al., 2015).
Drought stress is the leading limiting factor to wheat production in sub-Saharan Africa (SSA), including South Africa (Matiu et al., 2017; Parry et al., 2007). International and national wheat research programs have developed wheat genotypes with enhanced drought tolerance. This resulted in improved grain yield potential under water-limited conditions (Foulkes et al., 2007; Nouri-Gambalani et al., 2009; Lopes et al., 2012;
Beche et al., 2014; Chen et al., 2015; Zhang et al., 2016; Gao et al., 2017). However, yield gains yet remain very low varying from 0.5 to 1% per year under water-stressed condition (Sharma et al., 2012; Crespo-Herrera et al., 2018). Drought stress may likely escalate due to climate change that will cause even hotter and drier growing conditions (Kiliç and Yağbasanlar, 2010). Breeding drought adapted wheat genotypes is important to improve grain yield potential of wheat under water stress condition (Belagrouz et al., 2018). Furthermore, breeding for drought tolerance can potentially enhance water-use efficiency (WUE) (Zhang et al., 2004) reducing the use of irrigation water. Water use efficiency is described as the ability of the plants to produce biomass or yield per unit water used by the plant (Blum, 2005). It is an essential trait for determining grain yield under water stressed condition (Ehdaie, 1995; Kirda et al., 1999; Zhang et al., 2005; Rebetzke et al., 2002, Franks et al., 2015).
Wheat improvement programmes developed elite genotypes targeting yield-promoting agronomic and physiological traits which enhanced WUE to improve yield potential
(Belagrouz et al., 2018; Sakumona et al., 2014). Physiological traits such as chlorophyll content, osmotic adjustment, canopy temperature, relative water content, carbohydrate content, and morphological traits such as early flowering and maturity, harvest index are reportedly associated with drought tolerance breeding and wheat yield gains (Quin et al., 2013; Richard et al., 2015; Nakhforoosh et al., 2016; Christy et al., 2018; Rashid et al., 2018). As a result, these traits can be simultaneously selected in improvement programmes to design and develop highly-adapted, high- yielding and drought tolerant wheat genotypes with enhanced water-use efficiency to improve yield gains under water-limited environments. The frequent occurrence of drought stress in arid and semi-arid environments suggest the need to develop wheat genotypes that are even more efficient in the utilization of limited resources such as water, nutrients and light energy under dry environments. Such genotypes can be developed targeting yield-influencing agronomic and physiological drought-tolerance enhancing traits. This will likely improve wheat yield potential resulting in food security in SSA and globally.
Rationale of the study
Climate change is resulting in highly variable weather conditions causing prolonged dry spells and erratic rainfall patterns contributing to increased water crisis in South Africa. There is need to improve wheat production under the changing climatic conditions. This can be achieved by identifying and selecting wheat genotypes that use less water, while maintaining relatively good yield performance under water- limited conditions.
Current crop production trends in South Africa show that the total planted area under dry land wheat production has decreased. This is mainly due to poor and erratic rainfall occurring during the summer rainfall season affecting soil moisture availability in winter wheat production (DAFF, 2015). Despite the apparent decline in planted area, wheat yields have increased from about 2.5 to 3.5 million tons for the past 4 years, mainly because of the use of improved technology and agricultural practices and cultivation of locally adapted wheat genotypes. There is potential to increase wheat yields further, and this could be achieved by developing wheat genotypes that utilize limited resources such as water, light and nutrients more efficiently. Genotypes that possess
traits that enable them to optimize available resources for producing higher yields are urgently needed to boost wheat production in the country.
In the past wheat breeding program focused on yield improvement and disease and pest resistance under specific production environments. However, wheat producers require varieties that combine tolerance to biotic and abiotic stress. Drought and heat stress which have become key production constraints in the country necessitates the need to develop drought tolerant wheat genotypes. As a result, elite wheat genotypes where acquired from the International Wheat and Maize Improvement Center (CIMMYT) for abiotic stress tolerance breeding. CIMMYT’s elite germplasm need further evaluation to identify and select promising genotypes under the target production environment. This will enable identification and selection of breeding parents possessing yield-influencing agronomic and physiological traits for cultivar development to enhance grain yield potential under low-yielding environments of South Africa.
Aim of the study
The aim of this study was to evaluate and select drought tolerant wheat genotypes possessing key yield-influencing and drought-adaptive agronomic and physiological traits for breeding for high-yield potential, enhanced drought tolerance and water-use efficiency for water-limited wheat producing regions of South Africa.
Specific objectives of the study
1. To determine drought tolerance of dryland wheat genotypes based on leaf gas exchange and water-use efficiency in order to identify promising genotypes for drought tolerance breeding
2. To examine associations between morpho-physiological traits of selected wheat genotypes under drought stress in order to identify unique traits that may be used as direct or indirect selection criterion for improving water-use efficiency and drought tolerance in wheat.
Research hypotheses
The present study was based on the following test hypotheses:
1. Genotypic variation exists among wheat genotypes with respect to drought tolerance and water-use efficiency.
2. Morphological and physiological traits are well-correlated with water-use efficiency useful for selection.
Dissertation Outline
This dissertation is comprised of 3 chapters, which are outlined below. The referencing style used in this dissertation is based on the referencing style of the Journal of Crop Science. The dissertation chapters follow a format of a stand-alone research paper (whether or not the chapter has already been published). This is the dominant dissertation format adopted by the University of KwaZulu-Natal. As such, there is some unavoidable repetition of references and some introductory information between chapters. The research outcomes covered in Chapter two is published in Acta Agriculturae Scandinavica, Section B- Soil and Plant Science Volume 68, No. 8, 2018.
The structure of the dissertation is outlined below:
Chapter Title
- Dissertation Introduction 1 Review of Literature 2
Leaf gas exchange and water use efficiency of dry land wheat (Triticum aestivum L.) genotypes under water stressed and non-stressed conditions
3
Morpho-physiological traits associated with water-use efficiency in selected dry land wheat (Triticum aestivum L.) genotypes
- An overview of the research findings
References
Abdullah F., Hareri M., Naaesan M., Ammar M.A., Kanbar O.Z. (2011) Effect of drought on different physiological characters and yield components in different varieties of Syrian durum wheat. Journal of Agricultural Science 3:127–133.
Akhkha A., Boutraa T., Alhejely A. (2011) The rate of photosynthesis, chlorophyll content, dark respiration, proline and Abscicic acid (ABA) in wheat (Triticum durum) under water deficit conditions. International Journal of Agriculture and Biology 13:215–221.
Belagrouz A., Chennafi H., Bouzerzour H., Hakimi M., Razem R., Sahraoui A.S. (2018) Relationships among water use efficiency and the physio-agronomic traits in durum wheat (Triticum durum desf.) cultivars assessed under rainfed conditions of the eastern high plateaus of Algeria. Agriculture & Forestry 64:159-172.
Blum A. (2005) Drought resistance, water-use efficiency, and yield potential – are they compatible, dissonant, or mutually exclusive. Australian Journal of Agriculture Research 56:1159–1168.
Christy B., Tausz‐Posch S., Tausz M., Richards R., Rebetzke G., Condon A., McLean T., Fitzgerald G., Bourgault M., O'Leary G. (2018) Benefits of increasing transpiration efficiency in wheat under elevated CO2 for rainfed regions. Global Change Biology 24: 1965-1977.
CYMMIT. (2015). Scientists aim to adapt wheat to a warmer climate with less water.
http://www.cimmyt.org/scientists-aim-to-adapt-wheat-to-a-warmer-climate- with-less-water/. Accessed: 22 October 2016.
Dube E., Mare-Patose R., Kilian W., Barnard A., Tsilo T.J. (2015) Identifying high- yielding dryland wheat cultivars for the summer rainfall area of South Africa.
South African Journal Plant and Soil 33:77–81.
Ehdaie B. (1995) Variation in Water-Use Efficiency and Its Components in Wheat: II.
Pot and Field Experiments. Crop Science 35:1617-1626.
Ehdaie B., Waines G.G. (1993) Variation in water-use efficiency and its components in wheat. I. Well-watered pot experiment. Crop Science 33: 294-299
FAO. 2002. Plant production and protection series. No. 30. [Accessed 10 November 2015]. www.fao.org/docrep/006/ y4011e/y4011eoo.htm#.
Farooq M., Hussain M., Siddique K.H.M. (2014) Drought Stress in Wheat during Flowering and Grain-filling Periods. Critical Review in Plant Science 33:331–
349.
Franks P.J., Doheny-Adams T.W., Britton-Harper Z.J., Gray J.E. (2015) Increasing water-use efficiency directly through genetic manipulation of stomatal density.
New Phytologist 207:188–195.
Kilic H., Yagbasanlar T. (2010) The Effect of Drought Stress on Grain Yield, Yield Components and some Quality Traits of Durum Wheat (Triticum turgidum ssp.
durum) Cultivars. Notulae Botanicae Horti Agrobotanicicluj-Napoca 38:164- 170.
Kirda C., Kanber R., Tulucu, K. (1999) Yield response of cotton, maize, soybean, sugar beet, sunflower, and wheat to deficit irrigation. In: Kirda, C., Moutonnet, P., Hera, C., Nielsen, D.R., (Eds.), Crop Yield Response to Deficit Irrigations.
Kluwer Academic Publishers, Dordrecht, The Netherlands: 21-38.
Lesk C., Rowhani P., Ramankutty N. (2016) Influence of extreme weather disasters on global crop production. Nature 529:84–87.
Matiu M., Ankerst D.P., Menzel A. (2017) Interactions between temperature and drought in global and regional crop yield variability during 1961–2014. PLoS ONE 12.
Nakhforoosh A., Bodewein T., Fiorani F., Bodner G. (2016) Identification of Water Use Strategies at Early Growth Stages in Durum Wheat from Shoot Phenotyping and Physiological Measurements. Front Plant Science 7: 1155.
Parry M.L., Canziani O.F., Palutikof J.P., Linden P.J.V.D., Hanson C.E. (2007) Contribution of Working Group II to the Fourth Assessment Report of the Intergovernmental Panel on Climate Change. Elsevier 12:171–175.
Quin W., Chi B., Oenema O. (2013) Long-term monitoring of rainfed wheat yield and soil water at the Loess plateau reveals low water use efficiency. PLoS ONE 8.
Rashid M.A., Andersen M.N., Wollenweber B., Zhang X., Olesen J.E. (2018) Acclimation to higher VPD and temperature minimized negative effects on
assimilation and grain yield of wheat. Agricultural and Forest Meteorology 248, 119–129.
Rebetzke G.J., Condon A.G., Richards R.A., Farquhar G.D. (2002) Selection for reduced carbon isotope discrimination increases aerial biomass and grain yield of rainfed bread wheat. Crop Science 42: 739–745.
Richard C., Hickey L.T., Fletcher S., Jennings R., Chenu K., Christopher J.T. (2015) High-throughput phenotyping of seminal root traits in wheat. Plant Methods 11:
13.
Sakumona M., Lungu D., Munyinda K. (2014) Evaluation of Twelve Spring Wheat (Triticum aestivum L.) Genotypes for Water Use Efficiency under Varying Water Regimes. Journal of Applied Environmental and Biological Sciences 4. 63-70.
Siddique K.H.M., Tennant D., Perry M.W., Belford R.K. (1990) Water use and water use efficiency of old and modern wheat cultivars in a Mediterranean-type environment. Australian Journal of Agricultural Research 41: 431-447.
Zhang Z.B., Shan L. (1998) Comparison study on water use efficiency of wheat flag leaf. Chinese Science Bulletin 43:1205–1209.
Zhang X Y, Pei D, Chen S Y. (2004) Root growth and soil water utilization of winter wheat in the North China Plain. Hydrological Processes 18: 2275–2287.
Zhang P., Dreisigacker S., Melchinger A.E., Reif J.C., Kazi A.M., Van Ginkel M. (2005) Quantifying novel sequence variation and selective advantage in synthetic hexaploid wheat and their backcross-derived lines using SSR markers.
Molecular Breeding 15:1-10.
CHAPTER 1: Literature Review
Agronomic and physiological traits, and associated quantitative trait loci (QTL) affecting yield response in wheat (Triticum aestivum L.): A review Abstract
Enhanced grain yield has been achieved in bread wheat (Triticum aestivum L., 2n=6x=42) through development and cultivation of superior genotypes incorporating yield-related agronomic and physiological traits derived from genetically diverse and complementary genetic pool. Despite significant breeding progress, yield levels in wheat have remained relatively low and stagnant under marginal growing environments due to climate change. There is a need for genetic improvement of wheat using yield-promoting morpho-physiological attributes and desired genotypes under the target production environments to meet the demand for food and feed. This review presents breeding progress in wheat for yield gains using agronomic and physiological traits. Further, the paper discusses globally available wheat genetic resources to identify and select promising genotypes possessing useful agronomic and physiological traits to enhance water, nutrient- and radiation-use efficiency to improve grain yield potential and tolerance to abiotic stresses. Finally, the paper highlights quantitative trait loci (QTL) linked to agronomic and physiological traits to aid breeding of high-performing wheat genotypes.
Keywords: Morphological traits, physiological traits, QTL, yield gains, wheat
Introduction
Wheat (Triticum aestivum L., 2n=6x=42) is the world’s third important staple food crop after maize (Zea mays) and rice (Oryza sativa) (Cetin and Akinci, 2015; Dube et al., 2015). The crop is a vital source of proteins, carbohydrates, vitamins (e.g. B1, B2, B3 and E) and mineral elements (e.g. Se, Mn, P and Cu). Wheat is used for food, industrial raw material to prepare alcoholic beverages, starch and straws, and animal feed (Nhemachena and Kirsten, 2017).
Globally, 79% of total wheat production comes from China, United States of America, Turkey, Canada, Australia, India and Argentina (FAOSTAT, 2018) accounting to approximately 751 million tons per annum (FAOSTAT, 2018). Yield gains in wheat are currently estimated at about 0.5 to 1% per year which is below the 2.4% required to satisfy global demand (Sharma et al., 2012; Crespo-Herrera et al., 2018). In order to sustain the fast-growing human population, wheat production must increase by at least 50% by 2030 (Parry et al., 2011). Additionally, the global average wheat yields must increase from 3 to 5 t ha−1, a growth of 1.3% yr−1 by 2050 to meet demands (Rosegrant and Agcaoili, 2010). Increased wheat production can be achieved through development and cultivation of genotypes with tolerance to abiotic stress and enhanced nutrient, radiation- and water-use efficiency. Such genotypes can be developed through identification and selection of drought-adaptive and yield- influencing agronomic and physiological traits and associated quantitative trait loci (QTL) (Lopes et al., 2012; Chen et al., 2014; Liu et al., 2015).
Grain yield response in wheat is influenced by several agronomic and physiological traits (Chen et al., 2012; Liu et al., 2015). Agronomic traits such as plant height, harvest index, total biomass, number of productive tillers, grain number per spike, spike length, number of kernels per spike, thousand seed weight, and grain weight per spike; and physiological traits such as canopy temperature, chlorophyll content, photosynthetic rate, water-soluble carbohydrates have contributed to grain yield improvement in wheat (Foulkes et al., 2007; Nouri-Gambalani et al., 2009; Lopes et al., 2012; Beche et al., 2014; Chen et al., 2015; Zhang et al., 2016; Gao et al., 2017). Therefore, there is a need for trait-based breeding using high performing and genetically complementary genotypes to accelerate further grain yield improvement in wheat (Reynolds & Tuberosa 2008; Chen et al., 2012; Bustos et al., 2013; Liu et al., 2015;
Reynolds et al., 2017). The objective of this review is to present breeding progress in wheat for yield gains using agronomic and physiological traits. Globally available wheat genetic resources to aid in the identification and selection of promising genotypes are discussed. In addition, genotypes possessing useful agronomic and physiological traits to enhance water, nutrient- and radiation-use efficiency to improve grain yield potential and tolerance to abiotic stresses are discussed. Finally, the paper highlights quantitative trait loci (QTL) linked to agronomic and physiological traits to aid breeding of high-performing wheat genotypes.
Global wheat production and yield gains
India, Russia, China and Kazakhstan are currently the leading wheat producers with approximately 30, 27, 24 and 12 million hectares devoted to wheat production, respectively. In terms of total production, China is the world’s leading wheat producer with approximately 131 million tons per year (FAOSTAT, 2018). India is the second largest wheat producer followed by Russia, Canada, Argentina, Ukraine and Turkey (FAOSTAT, 2018). Among African countries, Ethiopia Algeria, Egypt, Kenya, Morocco and South Africa have the largest area devoted to wheat production with total production above 1 million tons per year. Variable wheat grain yield response per unit area are reported from New Zealand with 9 tons/ha, Saudi Arabia (6 tons/ha), Zambia (6.6 tons/ha), Egypt (6.5 tons/ha) and China (5.4 tons/ha) in 2016 (FAOSTAT, 2018).
The world average wheat yield is 2.9 tons/ha (FAOSTAT, 2018). Worldwide, about 33% countries achieved yield levels ≤ 2 tons/ha, while 21% countries had ≥ 3 tons/ha and 22% had yield levels ≥ 5 tons/ha (FAOSTAT, 2018). Differences in yield levels is attributed to variable climatic conditions, agronomic practices and genetic potential of cultivars.
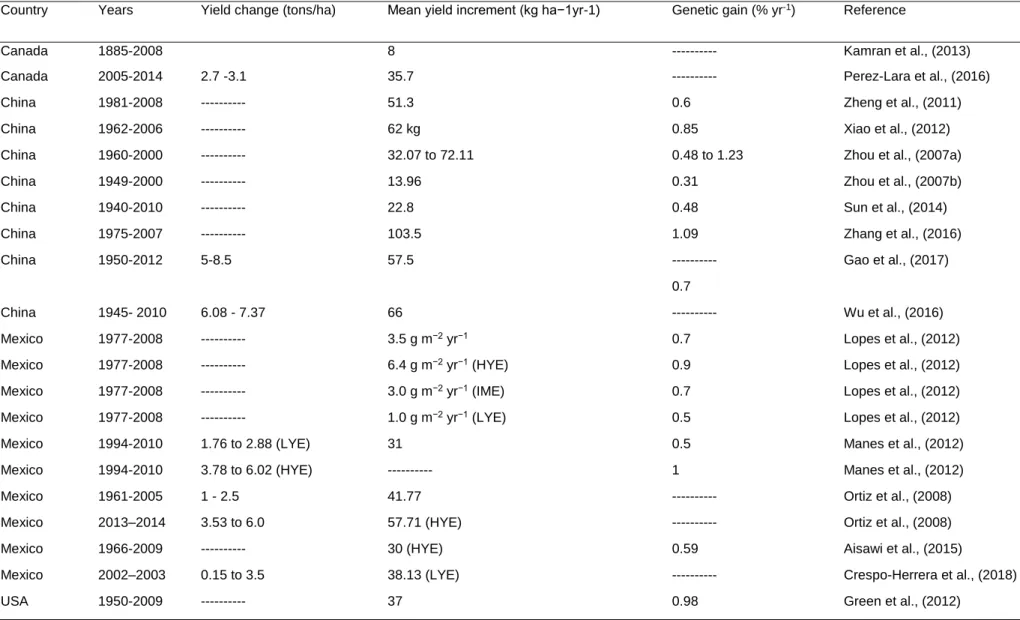
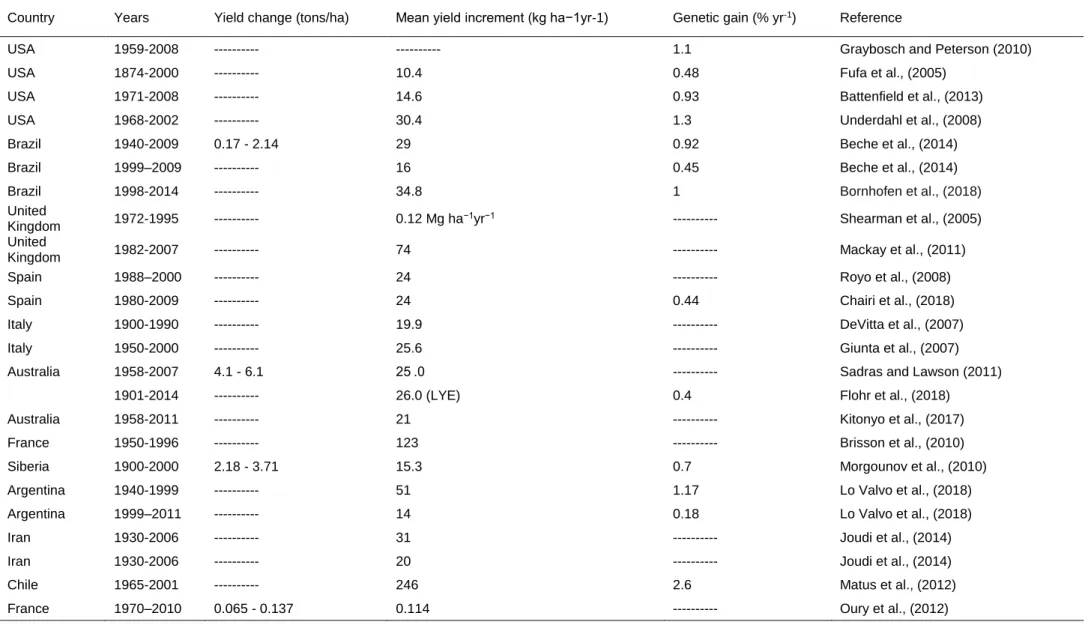
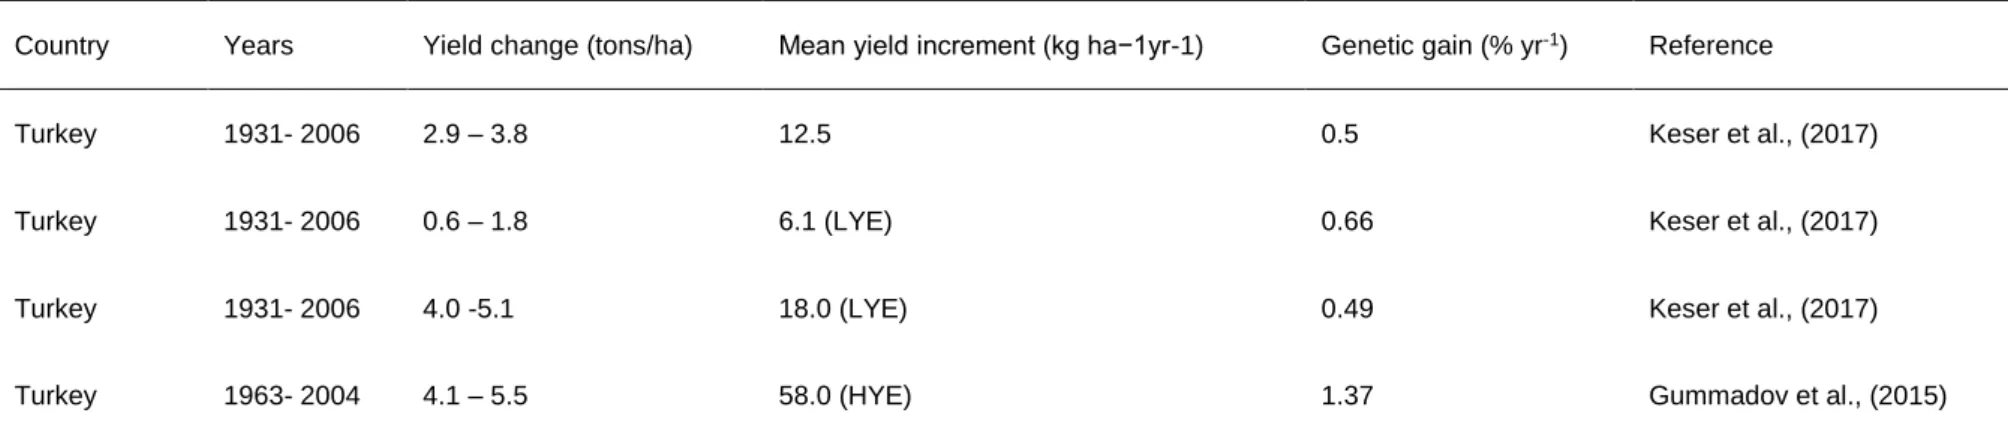
Wheat yield gains across the major wheat producing countries are presented in Table 1.1
.
Genetic gains estimated through yield trials are variable among modern varieties released at various time periods compared with checks (Graybosch and Peterson, 2010; Lopes et al., 2012; Sharma et al., 2012). This variation is mainly influenced by yield-related agronomic and physiological traits (De Vita et al., 2007; Beche et al., 2014). The highest yield gains were reported in China (123 kg ha−1 yr−1), Chile (246 kg ha−1 yr−1), France (123 kg ha−1 yr−1) and Mexico (41.77 kg ha−1 yr−1), whereas(25 kg ha−1 yr−1) and Siberia (15.3 kg ha−1 yr−1). Annual yield gains in Egypt, India, and Pakistan were estimated at 27.4 kg ha−1 yr−1 (0.55%), 21.4 kg ha−1 yr−1 (0.62%), 111.6 kg ha−1 yr−1 (1.13%), 32.5 kg ha−1 yr−1 (0.83%), and 18.5 kg ha−1 yr−1 (0.5%), respectively (Sharma et al., 2012). Genetic gains among CIMMYT’s spring bread wheat in the Elite Spring Wheat Yield Trial (ESWYT) in the past 15 years (i.e. 1995–
2009) in 69 countries showed an annual gain of 27.8 kg ha−1 (0.65%) (Sharma et al., 2012). The rate of genetic progress in certain instances (e.g. CIMMYT spring wheat improvement programme in Mexico) has been relatively slow and has not reached maximum threshold levels (Aisawi et al., 2018). Countries such as the USA, Chile, France and Brazil, had reportedly reached maximum limits (Brisson et al., 2010;
Graybosch and Peterson, 2010; Matus et al., 2012; Beche et al., 2014).
Genetic progress is relatively lower under low-yielding environments compared to high-yielding environments (Lopes et al., 2012; Joudi et al., 2014; Keser et al., 2017;
Crespo-Herera et al., 2018b). Therefore, targeted breeding for low-yielding environments (e.g. under drought stressed and high pest and disease pressure environments) is crucial to improve grain yield. Differences in rates of genetic progress across different breeding programmes suggested that newly developed and high- yielding genotypes possess different genetic and adaptation mechanisms to reach their yield potentials (Gummadov et al., 2015).
Genetic gains in grain yield have been attributed to development and deployment of high-yielding wheat genotypes with improved agronomic and physiological traits related with high yield potential (De Vita et al., 2007; Manes et al., 2012; Lopes et al., 2012; Aisawi et al., 2015; Zhang et al., 2016; Gao et al., 2017). For example, in Mexico genetic gains in grain yield were associated with fewer days to heading, cooler and reduced canopy temperatures at grain filling, increased stay-green and thousand kernel weight (Lopes et al., 2012). Similarly, significant yield increases in China resulted from increased grain number per spike, thousand kernel weight, harvest index and plant height (Zhang et al., 2016). Genetic gains among CIMMYT’s spring wheat cultivars developed between 1966 and 2009 in Mexico was associated with increased above-ground dry matter and increased seed weight (Lopes et al., 2012; Aisawi et al., 2015). Further improvement in wheat genetic gains is likely to be realized through breeding for important yield-related agronomic and physiological traits
Table 1. 1: Global yield gains in wheat from 1874 to 2014.
Country Years Yield change (tons/ha) Mean yield increment (kg ha−1yr-1) Genetic gain (% yr-1) Reference
Canada 1885-2008 8 --- Kamran et al., (2013)
Canada 2005-2014 2.7 -3.1 35.7 --- Perez-Lara et al., (2016)
China 1981-2008 --- 51.3 0.6 Zheng et al., (2011)
China 1962-2006 --- 62 kg 0.85 Xiao et al., (2012)
China 1960-2000 --- 32.07 to 72.11 0.48 to 1.23 Zhou et al., (2007a)
China 1949-2000 --- 13.96 0.31 Zhou et al., (2007b)
China 1940-2010 --- 22.8 0.48 Sun et al., (2014)
China 1975-2007 --- 103.5 1.09 Zhang et al., (2016)
China 1950-2012 5-8.5 57.5 --- Gao et al., (2017)
0.7
China 1945- 2010 6.08 - 7.37 66 --- Wu et al., (2016)
Mexico 1977-2008 --- 3.5 g m−2 yr−1 0.7 Lopes et al., (2012)
Mexico 1977-2008 --- 6.4 g m−2 yr−1 (HYE) 0.9 Lopes et al., (2012)
Mexico 1977-2008 --- 3.0 g m−2 yr−1 (IME) 0.7 Lopes et al., (2012)
Mexico 1977-2008 --- 1.0 g m−2 yr−1 (LYE) 0.5 Lopes et al., (2012)
Mexico 1994-2010 1.76 to 2.88 (LYE) 31 0.5 Manes et al., (2012)
Mexico 1994-2010 3.78 to 6.02 (HYE) --- 1 Manes et al., (2012)
Mexico 1961-2005 1 - 2.5 41.77 --- Ortiz et al., (2008)
Mexico 2013–2014 3.53 to 6.0 57.71 (HYE) --- Ortiz et al., (2008)
Mexico 1966-2009 --- 30 (HYE) 0.59 Aisawi et al., (2015)
Mexico 2002–2003 0.15 to 3.5 38.13 (LYE) --- Crespo-Herrera et al., (2018)
USA 1950-2009 --- 37 0.98 Green et al., (2012)
Table 1.1: (Continued).
Country Years Yield change (tons/ha) Mean yield increment (kg ha−1yr-1) Genetic gain (% yr-1) Reference
USA 1959-2008 --- --- 1.1 Graybosch and Peterson (2010)
USA 1874-2000 --- 10.4 0.48 Fufa et al., (2005)
USA 1971-2008 --- 14.6 0.93 Battenfield et al., (2013)
USA 1968-2002 --- 30.4 1.3 Underdahl et al., (2008)
Brazil 1940-2009 0.17 - 2.14 29 0.92 Beche et al., (2014)
Brazil 1999–2009 --- 16 0.45 Beche et al., (2014)
Brazil 1998-2014 --- 34.8 1 Bornhofen et al., (2018)
United
Kingdom 1972-1995 --- 0.12 Mg ha−1yr−1 --- Shearman et al., (2005)
United
Kingdom 1982-2007 --- 74 --- Mackay et al., (2011)
Spain 1988–2000 --- 24 --- Royo et al., (2008)
Spain 1980-2009 --- 24 0.44 Chairi et al., (2018)
Italy 1900-1990 --- 19.9 --- DeVitta et al., (2007)
Italy 1950-2000 --- 25.6 --- Giunta et al., (2007)
Australia 1958-2007 4.1 - 6.1 25 .0 --- Sadras and Lawson (2011)
1901-2014 --- 26.0 (LYE) 0.4 Flohr et al., (2018)
Australia 1958-2011 --- 21 --- Kitonyo et al., (2017)
France 1950-1996 --- 123 --- Brisson et al., (2010)
Siberia 1900-2000 2.18 - 3.71 15.3 0.7 Morgounov et al., (2010)
Argentina 1940-1999 --- 51 1.17 Lo Valvo et al., (2018)
Argentina 1999–2011 --- 14 0.18 Lo Valvo et al., (2018)
Iran 1930-2006 --- 31 --- Joudi et al., (2014)
Iran 1930-2006 --- 20 --- Joudi et al., (2014)
Chile 1965-2001 --- 246 2.6 Matus et al., (2012)
France 1970–2010 0.065 - 0.137 0.114 --- Oury et al., (2012)
Table 1.1: (Continued).
Country Years Yield change (tons/ha) Mean yield increment (kg ha−1yr-1) Genetic gain (% yr-1) Reference
Turkey 1931- 2006 2.9 – 3.8 12.5 0.5 Keser et al., (2017)
Turkey 1931- 2006 0.6 – 1.8 6.1 (LYE) 0.66 Keser et al., (2017)
Turkey 1931- 2006 4.0 -5.1 18.0 (LYE) 0.49 Keser et al., (2017)
Turkey 1963- 2004 4.1 – 5.5 58.0 (HYE) 1.37 Gummadov et al., (2015)
LYE = Low-yielding environment, IME = Intermediate-yielding environment, HYE = High-yielding environment
Use of agronomic traits in phenotyping wheat
Grain yield in wheat is influenced by several agronomic traits (Chen et al., 2012; Liu et al., 2015) which have been widely explored in wheat improvement programmes to accelerate cultivar development. Due to their high heritability and correlation with grain yield, agronomic traits can be used as indirect selection criteria during breeding and cultivar development (Table 1.2) (Chen et al., 2012; Abdolshahi et al., 2015; Liu et al., 2015; Gao et al., 2017). Moreover, it has been suggested that genetic progress in yield can be achieved if several traits conferring better agronomic and physiological performance with biotic and abiotic stress tolerance are simultaneously selected and introgressed in a single variety (Lopes et al., 2012). Some important agronomic traits that have been exploited in wheat improvement programmes to aid cultivar development and increase grain yield potential and genetic gains are discussed below.
1.4.1 Early flowering and maturity
Breeding novel wheat genotypes with early flowering and maturity is an important objective in wheat breeding programmes (Chen et al., 2016; Mondal et al., 2016;
Ochagavía et al., 2018). The focus is developing early maturing wheat genotypes as an adaptive mechanism for environments experiencing terminal heat and drought stress (Motzo and Giunta, 2007; Mondal et al., 2016). Understanding the genetic factors controlling flowering time is essential to manipulate phenological development processes to improve yield potential in wheat (Royo et al., 2018). Most modern wheat genotypes incorporated vernalization and photo-period insensitive genes to promote early flowering and maturity (Chen et al., 2016). Genes conditioning vernalization namely Vrn-A1, Vrn-B1 and Vrn-D1 regulate flowering and maturity in wheat (Iwaki et al., 2002). The effect of Vrn loci on heading and maturity and grain yield potential are ranked as follows: Vrn-A1 < Vrn-B1 < Vrn- D1 (Zheng et al., 2013; Zhang et al., 2014;
Ogbonnaya et al., 2017) (with singular or combined effect). This resulted in increased days to heading and grain yield under optimal environments, but decreased grain yield under heat prone environments (Zhang et al., 2008; Kamran et al., 2013; Ogbonnaya et al., 2017).
Wheat breeders have developed genotypes combining vernalization to promote early maturity and improve grain yield potential. Canadian spring wheat cultivars possessed Vrn-A1 gene at a frequency of 94 % (Chen et al., 2016). In Mexico, Vrn-D1 was
identified in 66% of wheat cultivars, while Vrn-A1, Vrn-B1, and Vrn4 were present in 41, 39, and 8% of the cultivars, respectively, either singly or in combination (van Beem et al., 2005). Vrn-D1 allele showed the highest frequency (64%) among Chinese wheat cultivars followed by Vrn-A1 (Zhang et al., 2008). This indicated successful breeding using vernalization genes in wheat improvement is variable across different breeding programmes. Breeding strategies to replace the winter-type alleles, especially Vrn-A1 and Vrn-D1 loci associated with late heading times (Zhang et al., 2008), has been recommended to develop early-flowering cultivars for water-limited environments.
Zhang et al., (2014) reported that the genotypes possessing the Vrn-A1avrn-B1Vrn- D1a loci would result in reduced time to anthesis and improve grain yield potential and kernel number in water-stressed environments. Contrastingly, incorporation of Vrn-D1 is recommended in spring wheat to increase grain yield and improve adaptation to late drought and heat stress tolerance.
Photoperiod sensitive genes namely: Ppd-D1a, Ppd-B1 and Ppd-A1 control photoperiod sensitivity impacting on flowering and maturation times in wheat (Langer et al., 2014). The effect of selected photoperiod genes on key agronomic traits in wheat are presented in Table 1.2. Early flowering wheat genotypes with photo-period insensitivity produce high biomass and grain yield, whereas photo-period sensitivity alleles Ppd-A1b and Ppd-B1b resulted in lower yields (Royo et al., 2018). Conversely, late flowering response was induced by photo-period sensitivity due to the presence of alleles Ppd-A1b and Ppd-B1b. This produced high dry matter with little advantage in terms of grain yield potential (Royo et al., 2018). Early maturity achieved through early flowering and maturity resulted in positive genetic gains (DeVitta et al., 2007;
Motzo and Giunta, 2007; Morgounov et al., 2010; Kamran et al., 2013; Liu et al., 2018).
In some cases, yield increase was not associated with earlier flowering in wheat (Chairi et al., 2018; Flohr et al., 2018). The limited genetic gains incorporating early maturity may be due to reduced time available for assimilate partitioning required for high grain yield development (Royo et al., 2007) partly explained by the negative association (Figure 1.1) between kernel weight per spike and heading date (Zhou et al., 2007a).
The combination of Ppd-D1 and dwarfing gene Rht5 were reported to have negligible effect on plant growth, flowering time, spike development, and grain yield in wheat.
This suggests that exploiting photoperiod-insensitive and dwarfing genes may improve
grain yield by balancing flowering time and yield components (Chen et al., 2018;
Ochagavía et al., 2018). Chen et al., (2018) reported that Ppd-D1 and Rht5 can shorten the duration of the reproductive phase and facilitate early flowering. Ppd-D1 can also reduce plant height, whereas the combination of Ppd-D1 and Rht5 resulted in shorter plants with increased lodging resistance (Table 1.3). Furthermore, Ppd-D1 can increase grain number from 6 to 10%, 1000-grain weight (13 to 22%), grain yield (23 and 40%) and harvest index (31 and 50%) from tall and dwarf genotypes, respectively. Canadian spring wheat carrying dominant allele of Vrn-B1, photo-period insensitive allele of Ppd-D1 and height reducing allele Rht-1 produced shorter plants and higher grain yield (Chen et al., 2016). In some breeding programmes, the photo- period sensitive gene Ppd-D1b is being replaced with the photo insensitive gene to develop early maturing genotypes (Kamran et al., 2013). Vrn-B1 can also act additively with a region on chromosome 2B near the Ppd-B1 locus, indicating that a shorter vernalization requirement combined with the Ppd-B1b allele for photoperiod sensitivity may play a key role in wheat adaptation to varied environmental conditions (Addison et al., 2016). Early-maturing, high-yielding, heat-tolerant wheat genotypes with excellent adaptation to diverse environments that incorporated vernalization, photo- period and dwarfing genes have been developed by CIMMYT and other breeding programmes globally for further breeding (Chen et al., 2016; Mondal et al., 2016; Royo et al., 2018). Negative and significant correlations (Figure 1.1) exists between days to flowering and grain yield potential suggesting that breeding for high yielding and early- maturing wheat genotypes can further be achieved by manipulating wheat phenology (Kamran et al., 2013; Bennani et al., 2016; Mondal et al., 2016). However, such genotypes should have faster growth rates and accumulate enough biomass production in shorter times to increase grain yield potential. Molecular markers linked to vernalization and photo-period genes useful for marker-assisted breeding have been identified in wheat (Chen et al., 2016; Igbal et al., 2007).
1.4.2 Plant height
Breeding novel wheat genotypes with reduced plant height has increased genetic gains in wheat and significantly contributed to increased wheat productivity globally (Beche et al., 2014; Gummadov et al., 2015; Würschum et al., 2015; Zhang et al., 2016). Many wheat improvement programmes have developed wheat genotypes incorporating the dwarfing/height reducing genes namely: Rht1 (Rht-B1b), Rht2 (Rht-
D1b), Rht-D1c and Rht8 (Zheng et al., 2011; Chairi et al., 2018; Green et al., 2012;
Lopes et al., 2012; Joudi et al., 2014; Zhang et al., 2016). The genes reduce coleoptile and internode length and plant height (Rebetzke et al., 2011; 2012) resulting in increased grain yield (Grover et al., 2018) by increasing assimilate partitioning to the ear. This resulted in higher harvest index and lodging resistance (Divashuk et al., 2013). Breeding progress to improve lodging resistance and grain yield in wheat resulted in plant height reduction from 130 to 60 cm in China (Gao et al., 2017), 110 to 95 cm in the UK (Berry et al., 2015), 120 to 57 cm in Italy (De Vita et al., 2007), 130 to 60 cm in Brazil (Beche et al., 2014) and from 125 to 65 cm in Spain (Royo et al., 2007) when replacing old by recent and short plant height wheat cultivars. In the USA the genetic progress of breeding for reduced plant height varied from –0.32 to –0.33%
yr–1 and –0.37 to –0.43% yr–1 across varied environments (Graybosch and Peterson, 2010). Zhou et al., (2007a) and Beche et al., (2014) reported a reduction in plant height by –0.69% and –0.74% yr–1 among Chinese and Brazilian wheat genotypes, respectively.
To date approximately 24 height reducing genes are reported including Rht-B1b, Rht- B1c, Rht-B1d, Rht-B1e, Rht-B1f, Rht-B1 g, Rht-D1b, Rht-D1c, Rht-D1d, Rht4, Rht5, Rht7, Rht8, Rht9, Rht12, Rht13, Rht14, Rht16, Rht18, and Rht21). These genes regulate plant height in wheat (McIntosh et al., 2013). The effect of selected height reducing genes on selected agronomic traits are summarized in Table 1.2. However, only a few dwarfing genes have been widely utilized for improving yield in wheat (Chen et al., 2015). Knowledge regarding the function of other dwarfing genes is important for breeding (Zhang et al., 2006). Further, opportunities exist for integrating commonly used height reducing genes (i.e. Rht1, Rht2, Rht8) with other dwarfing (GAR) genes such as Rht4, Rht5, Rht11, Rht12 and Rht24 to improve yield and lodging resistance (Ellis et al., 2005; Rebetzke et al., 2012; Chen et al., 2018; Mo et al., 2018).
Combination of Rht-B1e with Rht8 or Rht-B1b with Rht8 reportedly improved grain yield potential (Divashuk et al., 2013). Wheat genotypes with either Rht-B1b + Rht8c or Rht-D1b + Rht8c exhibits higher grain yield, spike number, kernel number, thousand grain weight, above-ground biomass, harvest index, stem water-soluble carbohydrates, chlorophyll content and reduced plant height (Gao et al., 2017). The combination of Rht4+Rht8 dwarfing genes has no effect on leaf length, leaf width and flag leaf area but resulted in reduced grain number per spike and increased 1000–
kernel weight, above-ground biomass and grain yield in wheat (Du et al., 2018). These suggested that combinations of Rht4 and Rht8 could reduce plant height to desirable levels, while improving grain yield and yield-related traits in wheat (Du et al., 2018).
Similarly, combinations of dwarfing genes Rht4 and Rht-B1b reduce plant height and increase grain yield due to increased grain number, greater spike number and higher harvest index in wheat (Liu et al., 2017) suggesting Rht4 can be successfully combined with Rht-B1b in wheat improvement to accelerate yield gains (Liu et al., 2017). Similarly, Rht5/Rht8 improved heading date and maturity in wheat (Daoura et al., 2014) useful for breeding and cultivar development (Table 1.3). Tian et al. (2019) showed that a combination of diverse height reducing genes have already been incorporated in elite Chinese wheat genotypes. For instance, combinations of Rht24+Rht1, Rht24+Rht2, Rht24+Rht8, Rht1+Rht8, Rht2+Rht8, Rht24+Rht1+Rht8, Rht24+Rht2+Rht8 occurred at frequencies of 86, 117, 137, 56, 77, 47 and 70%, respectively in Chinese wheat genotypes.
A dwarfing gene Rht5 has been shown to reduce plant height by approximately 40%
without affecting coleoptile length and seedling vigour (Chen et al., 2018). However, Rht5 can reduce spike length by approximately 16.7 and 22.6%, grain number by 11.5 and 14.5%, 1000-grain weight by 18.4 and 24.1% and grain yield by 21.5 and 35.1%
and delayed ear emergence and anthesis time, thus hindering effective utilization in wheat improvement (Chen et al., 2018). Therefore, genes promoting plant development and flowering times need to be incorporated with Rht5 dwarf lines to exploit their potential in wheat breeding programmes. The combination of Rht5 with other dwarfing genes to improve genetic gains in grain yield remains unexplored and un-investigated (Chen et al., 2018). Recently, a dwarfing gene Rht25, with Rht25a representing the height-increasing allele and Rht25b designated the dwarfing allele were identified in wheat (Mo et al., 2018). The average dwarfing effect of Rht25b was found to be approximately half of the effect observed for Rht-B1b and Rht-D1b, and the effect greater in the presence of height-increasing Rht-B1a and Rht-D1a alleles than in the presence of the dwarfing alleles (Mo et al., 2018). Rht25b is gibberellin acid sensitive gene and shows significant pleiotropic effects on coleoptile length, heading date, spike length, spikelet number, spikelet density and grain weight (Mo et al., 2018).
Therefore, Rht25 represents may serve as an alternative dwarfing gene to improve wheat yield potential across diverse environments (Mo et al., 2018).
Some studies suggested that wheat plant height has reached its theoretical limit at about 70 to 80 cm, suggesting that limited progress will be achieved through further reduction in plant height (Shearman et al., 2005). As a result, plant height cannot be decreased any further to avoid risking reductions in biomass and grain yield (Berry et al., 2015). Therefore, strategic breeding that combines both plant height and grain yield to maximise yield potential and lodging resistance has been suggested (Gao et al., 2017). GAR dwarfing genes, such as Rht4, Rht5, Rht8, Rht11, Rht12, Rht13, Rht24 and Rht25 have the potential to reduce plant height further (Rebetzke et al., 2012; Chen et al., 2018; Mo et al., 2018). These genes (i.e. Rht4, Rht5, Rht8, Rht11, Rht12, Rht13, Rht24 and Rht25) have negligible effects on biomass production, whereas some (i.e. Rht4, Rht12; Rht13; Rht24) can increase above-ground biomass, kernel weight, and grain yield (Rebetzke et al., 2012; Yang et al., 2015; Würschum et al. 2017b; Tian et al., 2019). The Rht24b allele is already used in combination with the two Rht‐1b semi‐dwarfing genes in wheat breeding (Würschum et al., 2017b; Tian et al., 2019). As a result, Rht24 utilization has increased in European countries, China and the USA, indicating that wheat breeders have actively selected for this locus for cultivar development to improve lodging resistance and grain yield potential (Würschum et al., 2017b; Tian et al., 2019). Rht24 occurs at a frequency of about 84.2% than other important dwarfing alleles in elite wheat varieties in China and usually couples with Rht2 or Rht8 (Tian et al., 2019). Similarly, Würschum et al., (2017b) also showed that Rht24 occurred at high frequency of approximately 67%
compared with GR genes and Rht8 in >1000 wheat varieties originating mainly from Europe. However, while transferring height reducing genes to well-adapted wheat genotypes, attention should be directed to selection of the most suitable adapted parents as the effect of the gene vary with different genetic backgrounds (Yang et al., 2015). Additionally, very limited information is available detailing the effect of dwarfing genes on wheat physiological processes which may limit effective breeding targeting such traits.
1.4.3 Harvest index
Harvest index (HI) has accelerated breeding for improved grain yield potential in wheat. For example, HI in wheat improved from approximately 0.25 to 0.44 (Gao et al., 2017) and 0.26 – 0.55 (Zhang et al., 2016) in China, 0.42 – 0.46 in the USA (Green