Red lettuce color was maintained in the shadenet greenhouse due to better light transmission. There is little reliable information on the performance of different types of greenhouses and cooling systems in different regions of South Africa.
The performance of different lettuce varieties in three different greenhouse designs will also be investigated. Models for predicting the performance of different greenhouse designs for South African conditions should be further investigated.
Introduction
Greenhouse Climate Parameters
- Temperature
- Relative humidity
- Light intensity
- Carbon dioxide
Increasing CO2 levels from the natural level to a concentration between 700 and 900 µ11-1 increases plant growth (Panwar et al., 2011). All the parameters described above are critical for plant growth and must be controlled in a greenhouse environment.
Climate Control Installations
- Cooling systems
- Internal air circulation system
- Air humidification
- Carbon dioxide control
Forced ventilation can reduce the indoor air temperature of the greenhouse and improve greenhouse conditions (Kittas et al., 2005). Another benefit of this cooling method is that it does not affect the ventilation rate of the greenhouse.
Greenhouse Designs
Greenhouse shapes and sizes
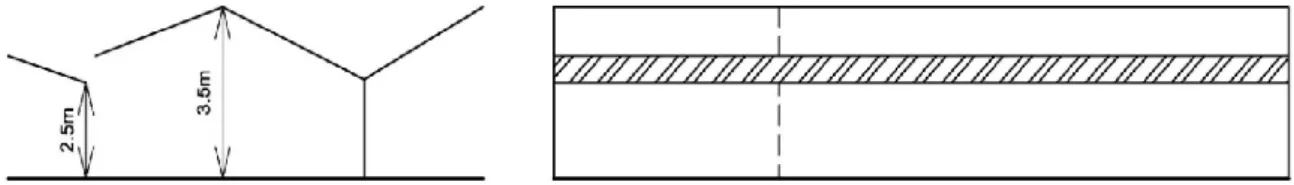
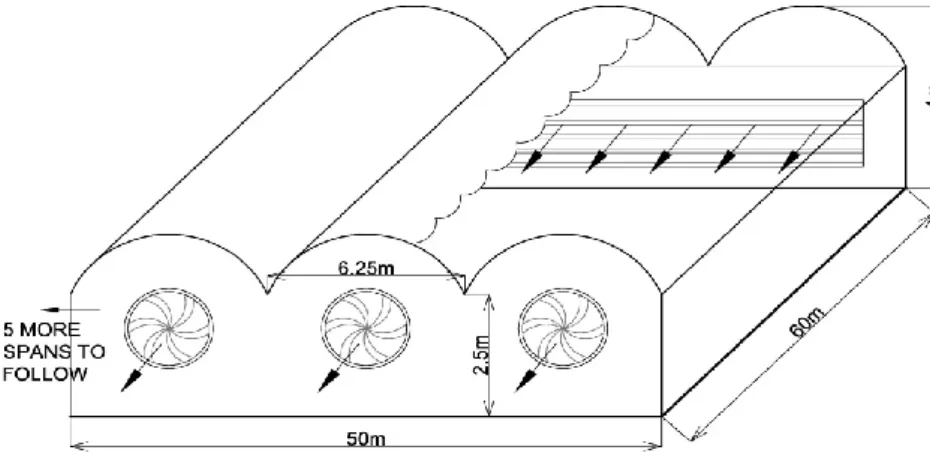
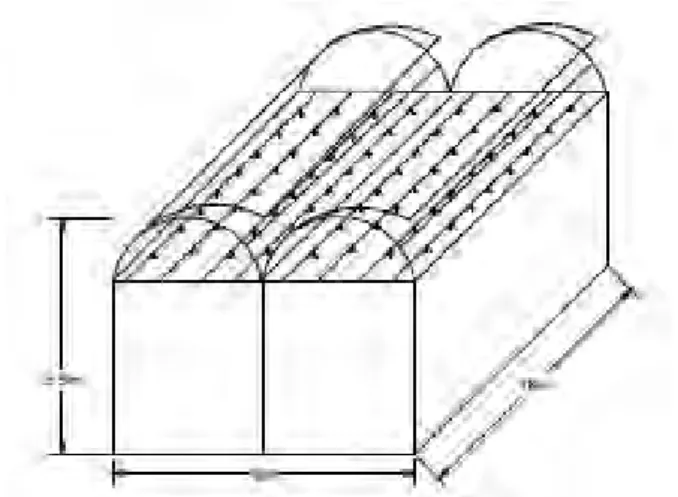
The different design forms and typical applications are listed and described below (Venter, 2010): . a) Span roof greenhouses: These greenhouses are usually used for large-scale commercial activities. Glass greenhouses are built with a gutter height of 6 m and plastic-covered greenhouses can reach heights of up to 3.5-4 m.
Design for greenhouse cooling
It is clear from this analysis that several factors such as cost, external climate conditions, choice of crop and choice of cooling systems must be considered when designing the shape and structure of the greenhouse.
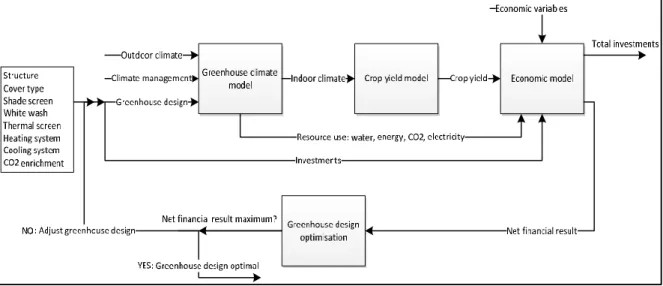
Greenhouse Micro-climate Modelling
Computational fluid dynamics
Forced ventilation (Fidaros et al., 2008) and the effect of solar radiation distribution and climate behavior in a tomato greenhouse were numerically analyzed using CFD. CFD modeling requires large computer memory and special software, which could limit the widespread use of the model (Lee et al., 2013).
Static and dynamic micro-climate models
The model takes into account solar radiation absorbed and transferred by the crop canopy and greenhouse roof, and ignores heat transfer from the soil. 1; = the heat loss coefficient of the greenhouse roof; = coefficient that represents the influence of solar radiation/energy on the transpiration of the plant.
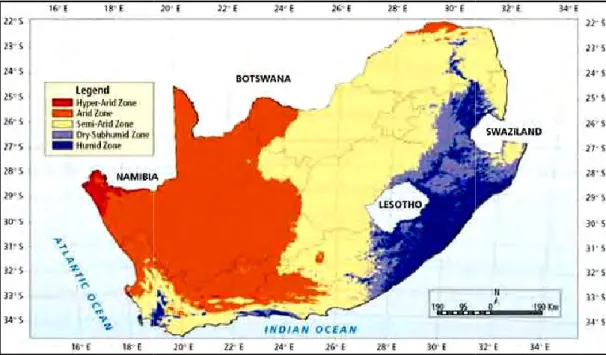
Agro climatic conditions in South Africa
Another major stumbling block for growers in South Africa is the limited availability of water and crop cover. Greenhouse production has also implemented, due to the significant temperature fluctuations in the different regions, to optimize the indoor climatic conditions and therefore optimizes crop production (Dijkxhoorn, 2012).
Greenhouses in South Africa
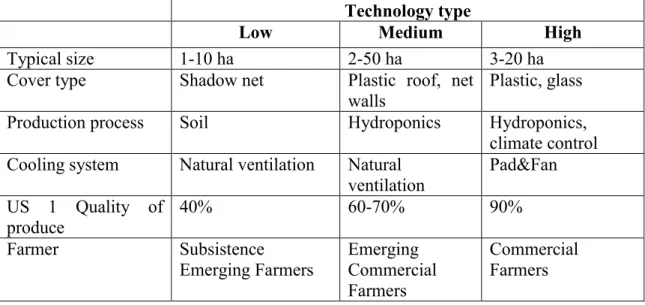
Farmers in South Africa are generally categorized as follows (de Visser and Dijkxhoorn a) Commercial farmers. Many greenhouses are designed by international companies and are often not suitable for many climate zones in South Africa.
Crops and Their Requirements
Greenhouse Installation Costs
Discussion and Conclusion
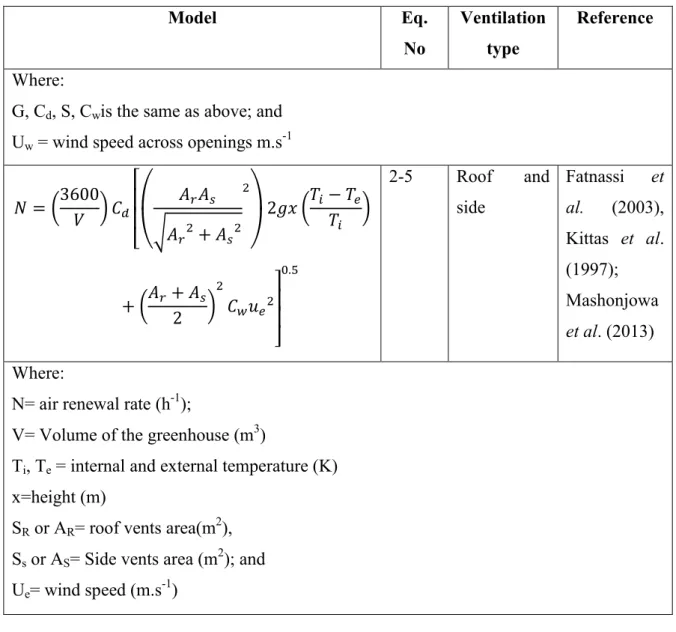
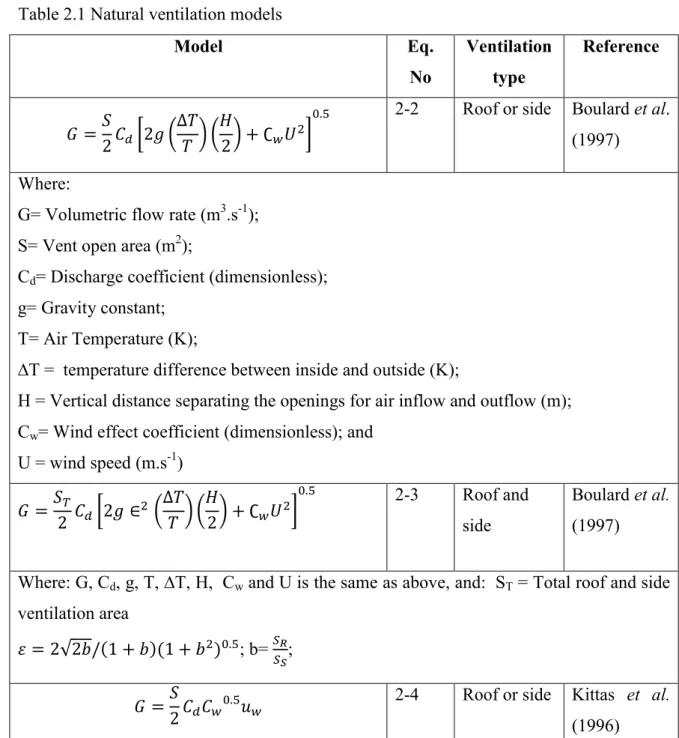
Misting systems and pad and fan systems during the summer seasons, with shade for areas of lower average humidity, are also commonly used (Kumar et al., 2009). Models for predicting ventilation rates and greenhouse temperatures for different structures and ventilation configurations have been extensively developed, but do not have the ability to predict RH (Ganguly and Ghosh, 2009; Mashonjowa et al., 2013).
Effect of vent configuration on greenhouse distributed climate: a review of experimental and CFD studies. Effect of greenhouse cooling method on growth and yield of tomato in the subtropics.
Abstract
Individual greenhouses can be evaluated under different external climatic conditions over a long period, and the marketable quality of the crop must also be evaluated.
Introduction
The effect of the different greenhouse cooling systems on microclimate and crop yield has been studied by several authors (Katsoulas et al., 2001, Kittas et al., 1997; Wang and Boulard, 2000). Use of dew in a naturally ventilated greenhouse resulted in reduced plant stress during extreme hot days (Katsoulas et al., 2001).
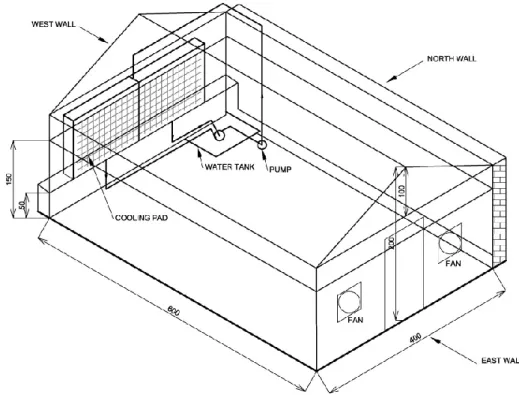
Materials and Methods
- Experimental site
- Greenhouses
- Experimental design
- Crop agronomic parameters and growth data collection
- Data analysis
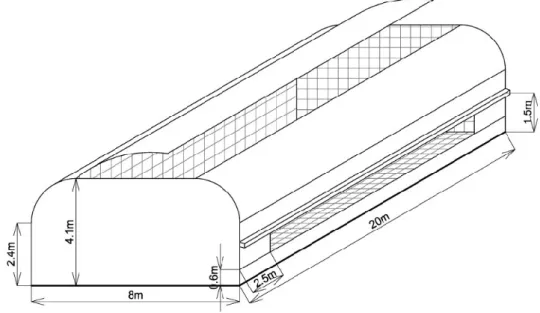
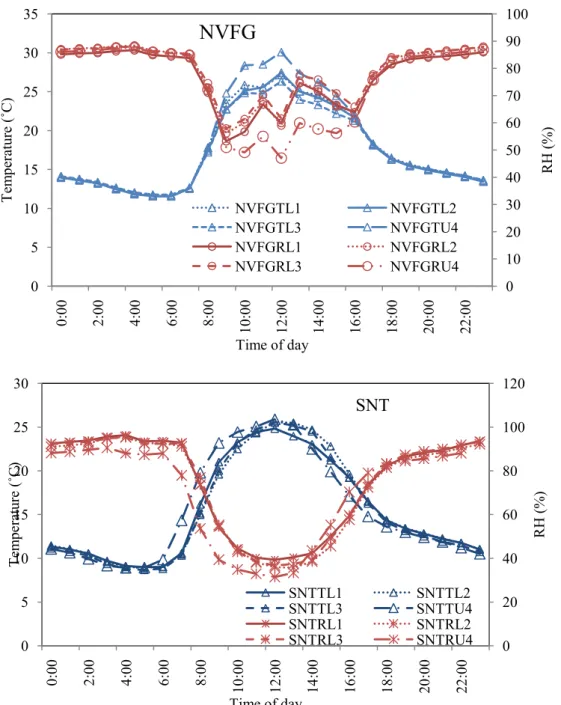
Sensors in NVFG were placed 1.5 m apart in the center of the greenhouse, 1.5 m above the greenhouse floor and those in the center, 1.5 m below the ridge height. At the end of the experimental period, the lightness (L*), chromaticity coordinates (a*, b*) and hue angle of the leaves were measured.
Results
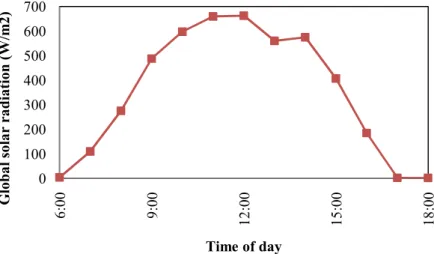
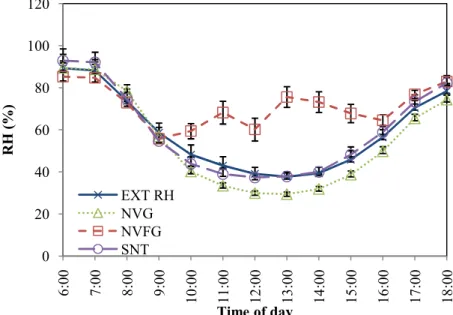
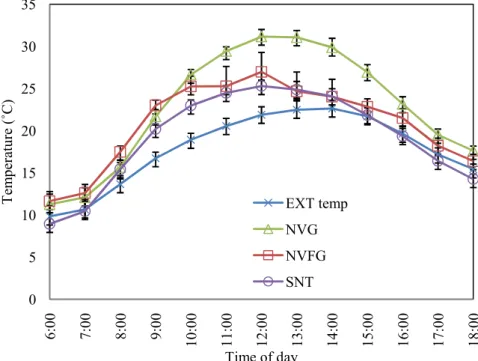
Average day-time micro-climate conditions
It is clear from the graphs that the internal temperatures in the greenhouse dropped when the misting had started. There is a small difference in the relative humidity in the shade net tunnel (SNT) and outside for each day (P>0.05).
Average night-time micro-climate conditions
Evaluation of the internal microclimates
RL1, RL2 and RL3 are the lower placed relative humidity sensors and RU4 is the RH sensor placed in the upper part of the greenhouses. If the wind is in the direction of the open openings (windward), studies have shown that the internal temperature decreases more significantly and air dispersion is higher, compared to when the wind comes from the opposite direction (leeward) (OuldKhaoua et al. . , 2006).
Plant growth analysis
Growth
For the Gaugin and Xerafin varieties, no significant effects were seen (P>0.05). The Erasmus variety showed 7% more leaf accumulation in NVFG than in NVG and 55% more than in SNT. Xerafin plants grown in NVFG accumulated 7% more than in NVG and 47% more than in SNT.
Colour
As indicated in Figure 3.11 - Figure 3.16, the Gaugin RZ and Xerafin RZ plants in the NVG and NVFG in particular lost their dark red color. Unlike the small amount of red color still visible in the Xerafin RZ variety plants in NPA, Figure 3.14, the Xerafin RZ variety plants showed similar results to those experienced with the Gaugin RZ variety.

Discussion
Average day-time micro-climate conditions
The high temperatures experienced in the naturally ventilated greenhouse with roof holes covered with insect netting correspond to the findings of Katsoulas et al., 2006. This depends on the geometrical properties of the cell and the age of the material, as the transmissivity coefficient of the material can decrease by 1% per year due to aging (Papadakis et al., 2000). Solar transmittance in experimental greenhouses covered with polycarbonate was probably much lower than the figures provided by previous literature, due to the condition of the material.
Average night-time micro-climate conditions
Relative humidity measured in all greenhouses was very similar to outdoor RH at night for each of the five days. Humidity levels in greenhouses did not often exceed the maximum acceptable level of 95% (Aguilar et al., 2011).
Plants growth performance analysis
The RH measured in the two greenhouses covered with polycarbonate was always lower than the outdoor and shaded RH. Plants in the SNT had between 25% and 75% less growth than in other greenhouses.
Conclusion
The microclimate was always more favorable for growing lettuce in the mist-cooled greenhouse compared to the other two. Red lettuce color was only maintained in the shadenet greenhouse due to better light transmission.
The temperatures in the naturally ventilated greenhouse equipped with insect screens always experienced very high temperatures, almost always over 30˚C during the day. Although temperatures in the shade net tunnel were also adequate, relative humidity was often too low for optimal conditions.
Abstract
Introduction
Modelling
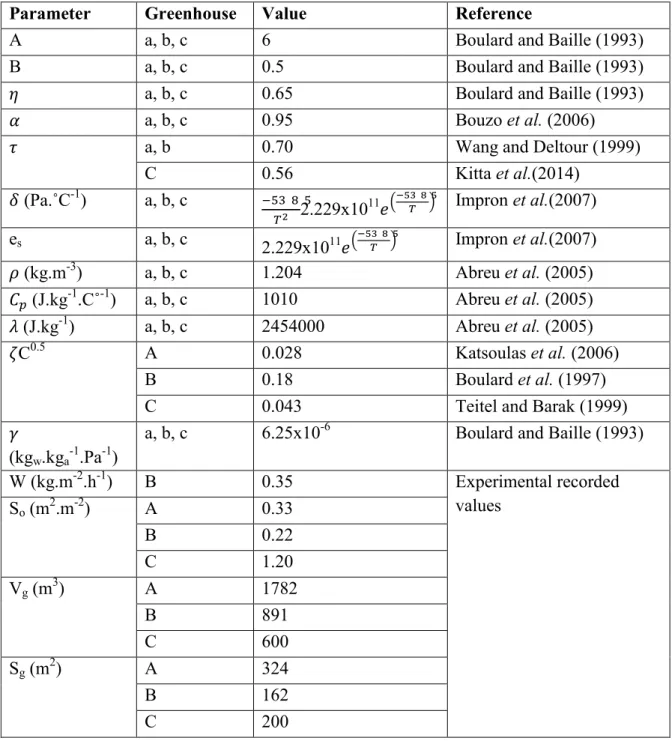
Determination of model coefficients and constants
Data Analysis
The values for the other two greenhouses were obtained from studies done on greenhouses covered with polycarbonate in a study by Wang and Deltour (1999). The wind-related coefficient (C0.5) for the model developed for NVG is obtained from the experiments and modeling done by Katsoulas et al. 2006) in a naturally ventilated greenhouse with a 55 mesh size functioning as an insect screen in the ventilation holes, which is similar to the 50 mesh installed in the experimental greenhouse.
Results
- Evaluation of model suitability NVG
- Evaluation of model suitability NVFG
- Evaluation of model suitability SNT
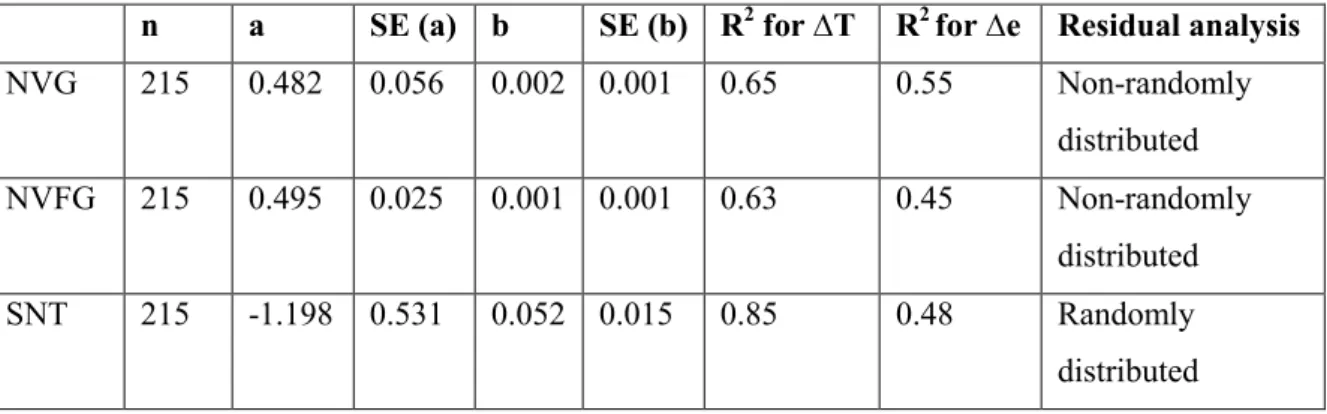
- Residual analysis
To test the suitability of the model, the predicted values were compared with the actual measured values. The negative values can also be seen in Figure 4.5, where the predicted and measured values show that the outdoor temperature is higher than the indoor temperature.
Discussion
Model suitability for predicting temperature
Abrupt changes in predicted values are also evident as the external wind speed increases and where the global solar radiation changes gradually. Similar to the NVG plots (Figure 4.1), the finding that the predicted values for ΔT are much lower than the actual measured values when the global radiation is reduced and the wind speed is increased and fogging is applied, corresponds to the findings reported by Bouzo et al.
Model suitability for predicting vapour pressure difference
This shows that the model cannot adequately predict the effect of deformation on the vapor pressure in the greenhouse. This shows that the effect of the change in air exchange has less of an impact on the actual measurements than the model represents.
Conclusion
The accuracy of the models developed to predict the difference between the internal and external vapor pressure was unsatisfactory in all three greenhouses. The complexity of specifically measuring the effect of misting applied to the internal greenhouse must be taken into account and complex models may need to be used to predict this more accurately.
The effect of evaporative mist cooling in a naturally ventilated greenhouse on air and leaf temperature, relative humidity and water consumption in a semi-arid climate. Modeling the thermal performance of a naturally ventilated greenhouse in Zimbabwe using a dynamic greenhouse climate model.
Abstract
Introduction
A large amount of data collection is required to perform a complete cost-benefit analysis on different greenhouse structures and designs. The purpose of this study is to compare costs associated with different greenhouse designs and their equipment requirements.
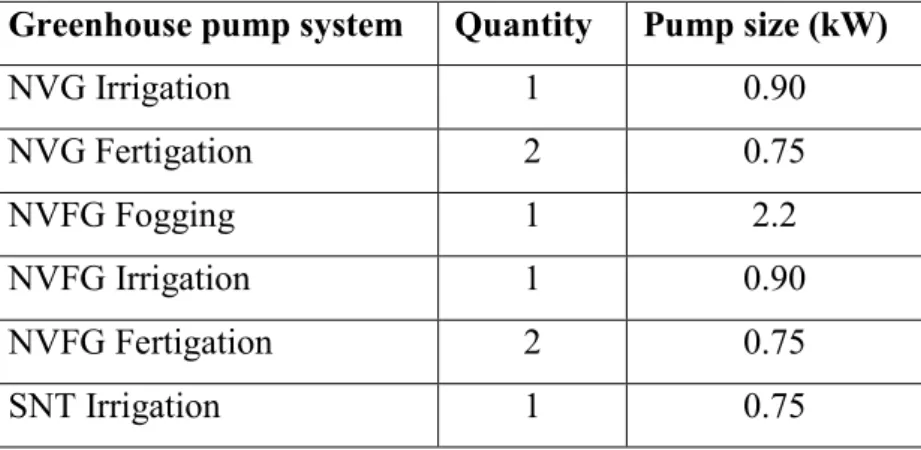
Methodology
The rates and time associated with the various rates for 2015/2016 can be found in Table 5.2 below. The overview of the costs associated with the various greenhouse system installations can be found in Table 5.4 below.
Analysis and Results
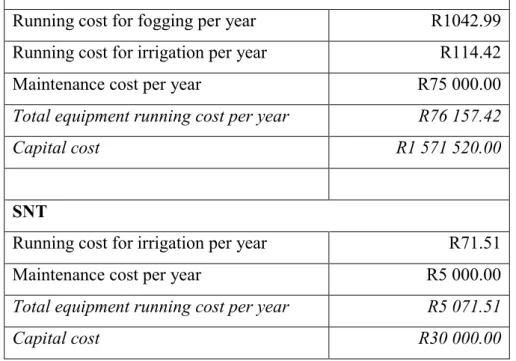
According to data collected from these three experimental greenhouse installations, maintenance can range from 5-15% of the initial capital investment per year. Therefore, the total cost of operating the equipment in a 1 ha greenhouse with the described specifications is estimated to be R per year, with an investment amount of R 4 550 000.
Discussion
However, if the capital and operational costs are compared to the shadow net tunnel, they are much higher.
Conclusion
Conclusion
The average internal daytime temperatures in SNT corresponded to the external temperatures. The daytime temperatures (11 - 24⁰C) in NVFG and SNT were on average acceptable for lettuce production.
Recommendations
Costs were predicted for a 1ha structure with precise design specifications and compared to the smaller greenhouse used for the experiments. It was found that, except for the SNT design, it is more cost-effective, in terms of operation and maintenance costs, to build larger greenhouses for crop production.
Appendix 1.1 ANOVA Tables for plant growth parameters
Appendix 1.2 ANOVA Tables for temperature and RH parameters
Appendix 1.3Tables for coefficients optimized for modelling