The existing credit rating process in the bank relies on the quality of qualitative and quantitative data provided by the sales staff. The primary task of the bank's credit manager is to assess the risk that the borrower (individual or company) will not be able to repay the loan (Falkena, Kok and Meijer 1989).
- International Multivariate and Univariate Research A. Univariate Financial Ratio Analysis
- Conclusion Univariate Studies
- The Altman 'Original' Z-Score model
- Altman's Critics
- ZETA Analysis
One of the classic works in ratio analysis was done by William Beaver. The determination of the 'original' Z-score for public companies is based on the market value of the equity as a numerator for the X4 ratio.
South African Univariate and Multivariate Research
Univariate Studies
Cash flow to total debt correctly classified 90% of companies one year before bankruptcy, 82% two years before bankruptcy, 79%. The cash flow to total debt ratio reflects the company's ability to repay its outstanding debt.
Multivariate Studies
- Katz and Nosarka (1978)
- Amiras, Aston and Cohen 'A-Ratio' (1978)
- De La Rey 'K-score' (1981)
This analysis will test the authors' hypotheses, namely: 'the models are able to indicate distress before the bank' (De Ratione Vol. A selection of failure prediction models will improve the traditional bank credit evaluation procedure by predicting business failure before the bank '.
Formal Study
The aim of the study is to verify whether the use of selected failure prediction models will actually help the bank in predicting failure before the bank credit rating process. Much of the information gathered at this meeting was based on a thorough discussion with a senior manager about the current credit assessment process used by the bank (please see Chapter 4 'Findings').
The Time Dimension
- Beaver 'Cash Flow to Total debt ratio'
- Altman 'Original' Z-score model
- Beaver's univariate 'Cash flow to total Debt ratio'
- Amiras, Aston and Cohen 'A-Ratio' multivariate model
- Model Distress Signal Timing
- Bank Distress Signal Timing
The dependent variable, namely 'emergency signal time', is performed using the independent variables, namely 'existing bank credit rating process' and 'selected failure prediction models' on a sample of failed and non-failed public companies. . The ultimate goal is to record one date and one emergency signal time of the model and bank. In a study by Strebel and Andrews (1977), application of Beaver's univariate relationship to a sample of South African firms produced a statistically significant classification of failed and non-failed firms.
The conditions and objectives of this study have resulted in the selection of the non-probability method 'Quota' for sampling design. The inclusion of the non-competitive companies is a check and comparison of the distress signal results. The sample was drawn from different business sectors, and the failed and non-failed were matched by industry sector, capitalization size, or firm age.
The models selected for this study were applied to the sample's financial data within a Microsoft Excel spreadsheet (Appendix A).
Operational Hypothesis
- Research Limitations A. Model limitations
This problem of separate credit criteria and decision-making is common to all major diverse groups, and therefore further suggests that the application of uniform credit assessment procedures should be applied across all divisions. The comparative data on the timing of distress signals, described in Table 4, Chapter 4, 'The Findings', are summarized in Tables 5, 6 and 7. This allows a numeric score to be recorded regarding the number of times the model or the bank predicted distress.
This study is designed to test whether the models will produce a distress signal before the bank and is not a test of the validity and accuracy of the models themselves. The models have already been subjected to a series of statistical tests on their formulation and their sensitivity to false classification.
Firm specific, Non-financial variables
The inclusion of the non-financial variables improved the predictive accuracy of the model from 66.7% to 100% in the year before failure. So we have the sequence: defects, failures, symptoms." The Argenti A-score takes a non-financial perspective to predict failure and is complementary to the Z and K-scores. This study did not consider the qualitative, company-specific, non- - financial variables for the sample of public companies, as listed in the Argenti A-Score model, and the research of.
Macro/Micro Economic variables
Academics are moving toward eliminating ratio analysis as an analytical technique in evaluating the performance of a business enterprise. A credit check system, namely the Information Trust Corporation (ITC), will provide a detailed credit analysis of a business entity applying for credit. The purpose of the application, including details of the movable or property that will be financed in this transaction.
The loan class is derived from a combination of customer quality and security quality. Data on the quality of insurance is provided by the evaluator, and data on the quality of the client is provided by the evaluator. If fraudulent information is provided at any stage of the process, it can lead to incorrect credit decisions.
Once a loan is approved, the various terms of the approval are added to the approval page so that the sales advisor can discuss these terms with the customer.
Distress signal timing comparison
The sales consultant can provide a lot of quality data, but this data can be subjective and open to manipulation. The sharing and pooling of ideas, views and experience throughout the credit assessment process is enhanced by and supported by the quality of information provided. Model and Bank Coding for Comparison of Disturbance Time A = Year in which Altman first signaled the disturbance.
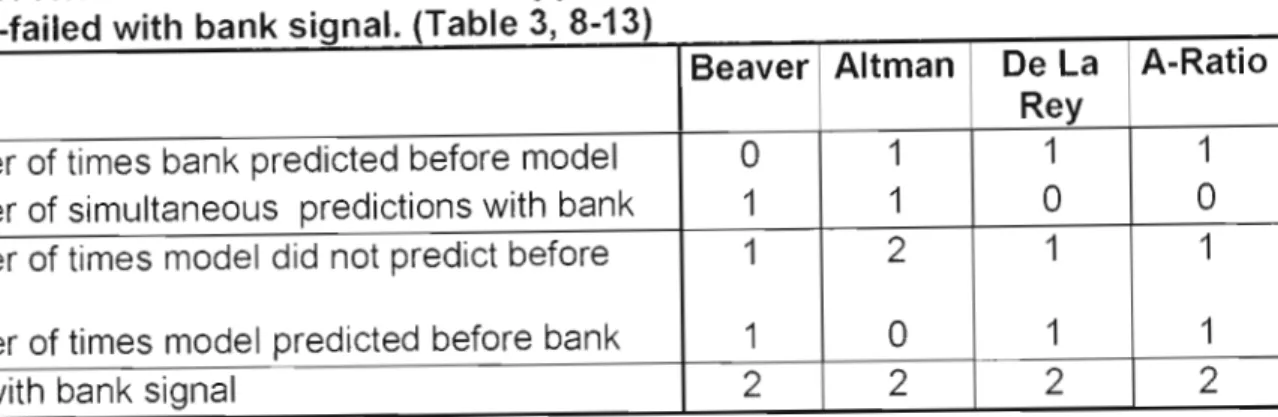
The bank's files had recorded distress signals in respect of only two companies out of a total of six non-failing samples. The overall predictive result is therefore drawn from nine public companies instead of the total of thirteen used in the complete sample. The non-failed sample is also a useful comparison to the failed sample based on size and industry type.
It is interesting to note in Table 4 with regard to the four remaining non-bankruptcies that some models identify problems even though the bank has.
Relative Success of Models: Table 5, 6 and 7
This means that the results in Table 6 include only these two companies, as both bank and model signals are necessary for the purposes of this study.
Ratio 2
Number of predictions by the bank before the model Number of simultaneous predictions with the bank How many times the model did not predict before the bank.
Ratio
COCD
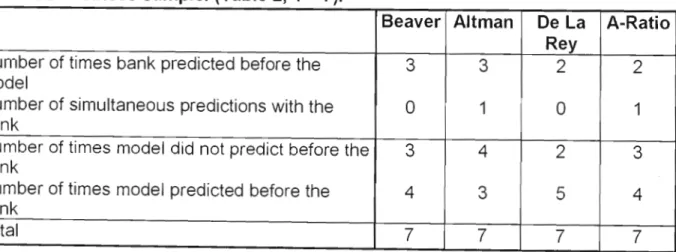
Table 5, Relative success of models applied to the failed business sample
Altman's famous model signaled on three occasions before the bank, while it did not signal before the bank on four occasions including one simultaneous occasion. This majority count of four versus three is the only result of the four models tested in this sample of failed companies that would actually support the null hypothesis. De la Rey's K-score model signaled five times ahead of the bank, while the bank signaled two times ahead of the model.
Report A signaled four times before the bank, while the bank signaled twice before the model. There was a concurrent forecast, which still leaves the model at a whopping four to three in its favor.
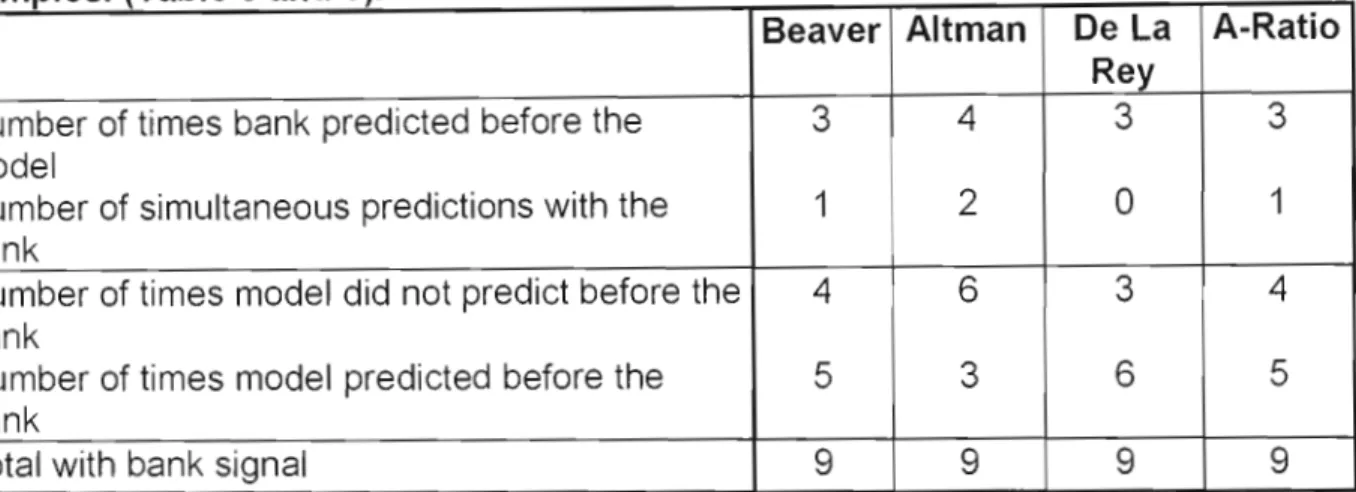
Table 6, Relative success of models applied to Non-Failed sample with bank signal
On one occasion, the model predicted ahead of the bank, while on one occasion the bank also predicted ahead of the model. The combined results of the failed and failed samples must be analyzed to understand this 50/50 result. Ratio A announces once before the bank, while the bank announces once before the model.
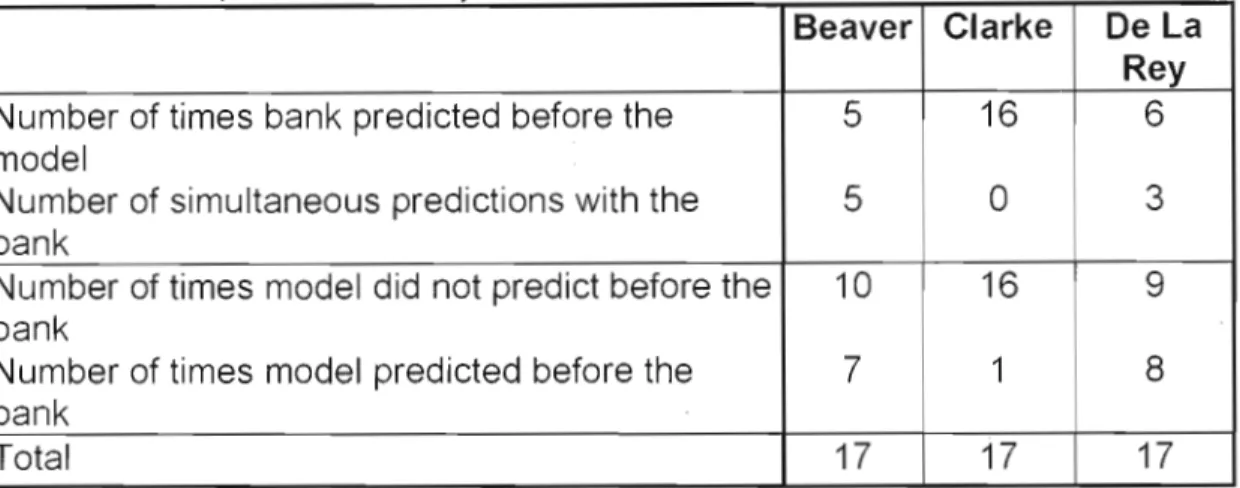
Table 7, Summary of the success of the model and bank signals across both the failed and non-failed samples.
Table 7, Summary of the success of the model's and bank signals over both the failed and non-failed sample
- Summary and Conclusions
The K-score model predicts bank money in six cases out of a total sample of nine. The model predicted failure before the bank in five cases out of the sample of nine, while the bank predicted failure before the model in three cases. There was a simultaneous forecast meaning the model missed the bank on four occasions.
The K-score model improves banks' credit assessment process by predicting bankruptcies before the bank. The A-ratio model predicted ahead of the bank five times, while the bank predicted ahead of the model three times. When the simultaneous predictions are counted, the number of times the model did not predict before the bank is four times.
The results for these three models favor the alternative hypothesis, improving the traditional bank credit assessment procedure by predicting business failure before the bank.
Suggestions for Further Research
- Financial Statements
- Interviews
Investigating the importance of certain firm financial variables in a failure prediction model. A note on failure prediction models as an aid to the credit assessment process in a South African commercial bank. Early warning indicators of corporate failure: A critical review of previous research and further empirical evidence.
Have they gone bankrupt or have the possibility of bankruptcy in the near future. Please identify non-distressed/non-defaulted borrowers that can be matched by industry, size or age to distressed/defaulted borrowers.
The existing credit evaluation procedure
The selected models have been applied to the respective financial year-end results for both the failed and non-failed sample of public companies. Please note that in the case of DeNim Textiles, Altman's Model 'A' Z-score was applied to the data instead of the selected 'Original' Z-score. 1999, and was therefore only listed as part of Coastal Group Ltd, at this time.
Altman Working Assets Total Assets Retained Earnings Operating Income/EBIT Mkt Value Equity Book Value Equity Total Debt. Altman Working capital Total assets Retained earnings Ebit/Ops profit Mkt value Capital Book value Capital Total Debt. Altman Working capital Total assets Retained earnings Ebit/Ops Profit Mkt value Capital Book value Capital Total Debt.
Altman Working Capital Total assets Retained earnings Ops Profit/Ebit Mkt value Shares Book value Shares Total liabilities.
- Ratio Rooo R1 R2
- Ratio Cash at Bank
- M.Moolla Group Ltd Year ended Feb 1998
- M.Moolla Group Ltd Year ended Feb 1999
- M.Moolla Group Ltd Year ended Feb 2000
- Ratio R000 R1 R2
Altman Working Capital Total Assets Retained Earnings Profit Ebit/Ops Value Mkt Equity Book Value Equity Sales.