Bidvest Panalpina Logistics (BPL) aims to provide world-class supply chain solutions to their customers. BPL operations can be divided into contract logistics and De-group operations. Annual volumes of operations peak at different times of the year and labor requirements will be highest during the peak period but not necessarily lowest during the slow periods of the year.
During periods of peak load, casual labor is employed to meet increased labor demands in the short term. Therefore, an annual labor forecast is necessary to reduce labor costs by optimizing the number of workers employed throughout the year. The main output of the project is a recruitment schedule for the company that will allow them to meet demand at the lowest possible cost.
This paper concludes by providing an annual workforce plan for 2013 that was generated with the help of the simulation model. This plan is the main product that management can use for hiring and firing the workforce.
- B ACKGROUND AND I NTRODUCTION
- W AREHOUSING VALUE ADDED SERVICES
- P ROBLEM S TATEMENT
- P ROJECT A IM
- P ROJECT S COPE
Annual volumes of operations peak at different times of the year and labor requirements will be highest during the peak period but will also be lowest during the slow times of the year. Using casual labor is sometimes not the best option for manpower recruitment as it slows down the productivity of the company. The main objective of the entire project is to determine an optimized capacity plan to be used for the employment of workers moving within the BPL divisions.
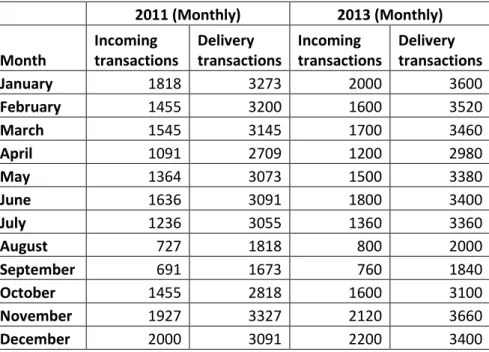
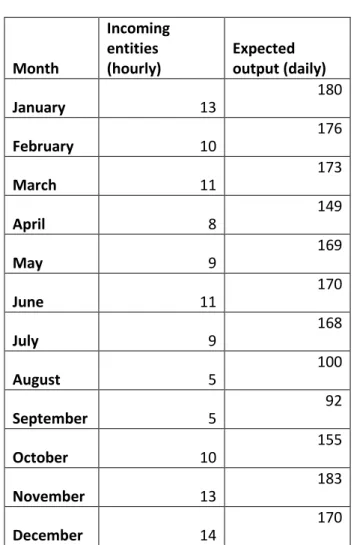
The forecast will be an annual plan outlining the number of people required in each warehouse at different times of the year. The purpose of the annual work plan is to assist the warehouses in achieving the best possible level of service with minimal labor costs for the company. Data for the number of transactions processed during the year 2011 was collected and documented according to various groupings available in the Unit 2 repository and it was grouped into monthly segments.
Investigate the skills gap that occurs during peak operations periods using a simulation model. The project will mainly cover the unbundling (consolidation) operations side of the Unit 2 warehouse at BPL and will not consider the contract logistics part of the warehouse.
L ITERATURE R EVIEW
- Investigation of current environment
- Forecasting
- Workforce Planning
- Simulation
- Using simulation to schedule resources
Forecasting is the estimation of the value of a variable (or set of variables) at a future point in time. Sometimes forecasts can help predict the expected future product or service mixes and also the specific locations where each of the specific products should be manufactured/manufactured. Industrial process control: predicted future values of hazardous quality characteristics of a manufacturing procedure can be useful in determining when important well-regulated variables in the process should be changed, or even when the process should be shut down. or even refurbished.
These kinds of forecasts form a crucial part of the regulation behind financial and economic strategy and accounting plans and judgments made by. Other business decisions can be made regarding forecasts of interest rates, currency exchange rates and options. Demographics: Most countries and regions usually have routine population forecasts, and these are stratified by factors such as age, race and gender.
Rowe and Wright (1999) is one reference available to readers who wish to learn more about subjective forecasting. Typically, in practice, we find that forecasting procedures may involve a combination of the above approaches.
- S OLUTION G ENERATION
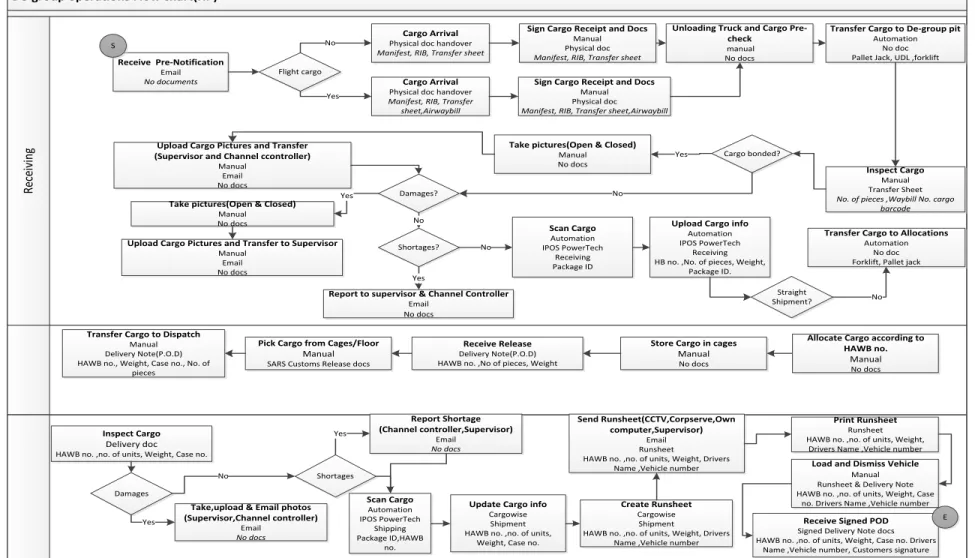
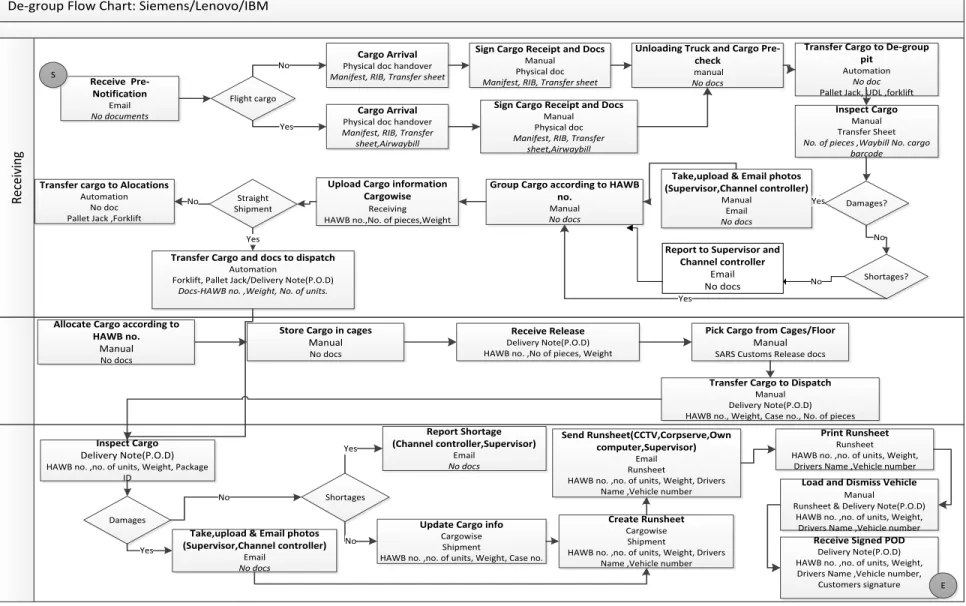
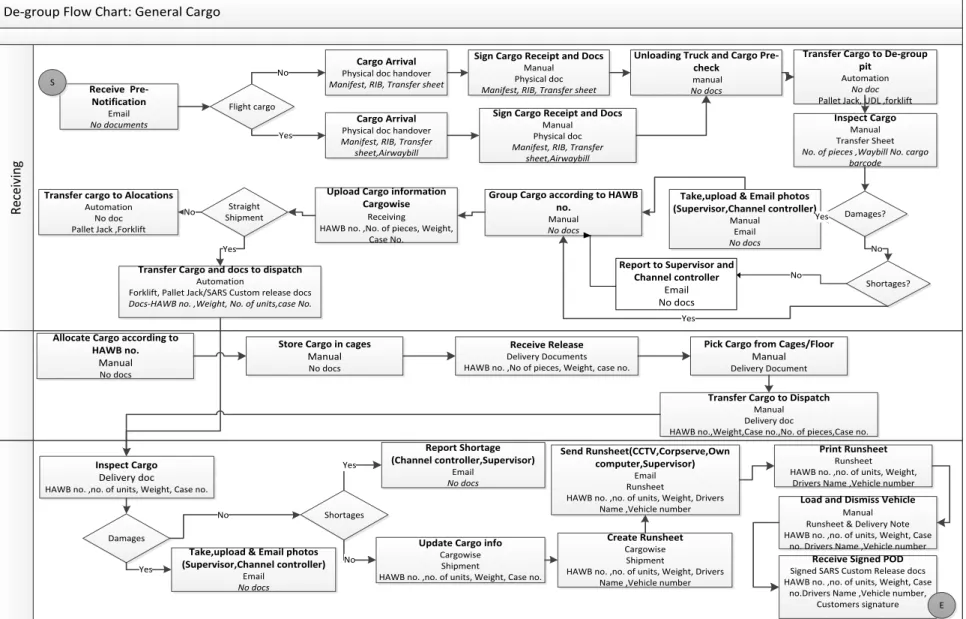
- P ROCESS F LOW D IAGRAM
- O PERATIONAL P ROFILING
- S IMULATION M ODEL
- S IMULATION D EFINITION
- Create Module
- Assign Modules
- Decision Modules
- Process Modules
- Dispose Module
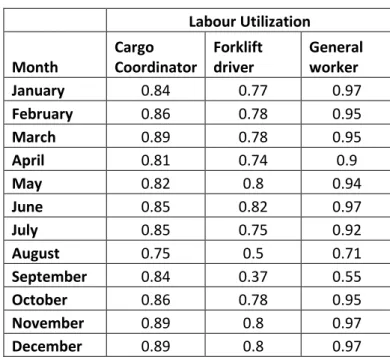
These utilization results will then be studied to find out if there is under- or over-utilization of labor resources. A list highlighting the number of workers required per skill set will be compiled for each of the months. Process flows will be useful in modeling warehouse operations in Arena.
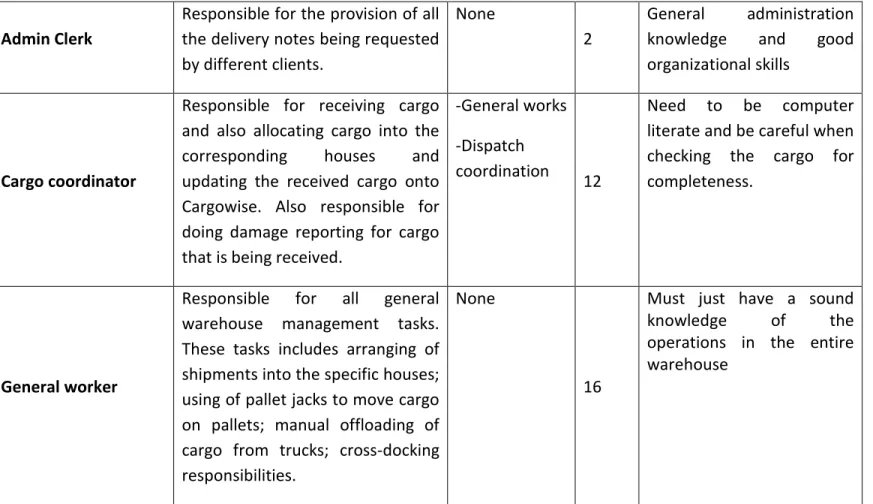
Must have a general overview of all the other tasks within the warehouse so they can know exactly what is expected of each of the workers in the warehouse. Responsible for arranging a landing sheet for the purpose of the cargo to be loaded onto a truck and delivered to the relevant customer(s). The process flow diagrams were combined together to form one simulation model of the warehouse as it is now.
Some of the processes in the flow diagram were combined to make the model simpler, but the model still represents the warehouse. The images of the simulation model are included in the appendix at the end of the document. This is the beginning of the process; it is actually the number of transactions (deliveries) made of inbound cargo coming from the airport or from a customer.
After the load has moved from assignments and is ready to be transferred, they track the number of cargo moved to shipping cages (it is assumed that once the load has been moved from assignments to shipment, it will be delivered automatically, so they note it ungroup as delivered items in the department). Some of the cargo received from the airport by horse and cart is said to be bonded cargo, so this cargo should be photographed while still wrapped in black wrapping paper. It is said that 75% of the load received from the horse and trailer is bonded load, so this means photos of 75% of the load should be taken before the load is unpacked.
Since the HP cargo has several different processes it has to go through in the warehouse, there must be a separation of the cargo when it is inside to decide whether it is from HP or not. The rest of the 29% of the pallets will be allocated to the 14-tonne truck house; i.e. One forklift goes inside the container and carries cargo to the door of the container and the other forklift does the movement of the cargo into the warehouse's receiving door.
The HP customer's freight has a different process than the rest of the other customers. After all cargo has been palletized and all damage control and scanning processes have been completed, the cargo is moved to the allocation area of the warehouse (the allocation is based on the house number, which determines the fleet size to be shipped in).
M ONTHLY TRANSACTIONS
D ATA I NPUT
At this point, we know what is happening in the warehouse right now, as we have a well-functioning simulation model and also have the statistics of historical transactions and the number of transactions expected for the year 2013. We have the utilization of the workers with data from the 2013 plan and we have tabled the data. This utilization will now help us to know whether we need to increase or decrease the number of workers per skill group.
TO-BE SITUATION
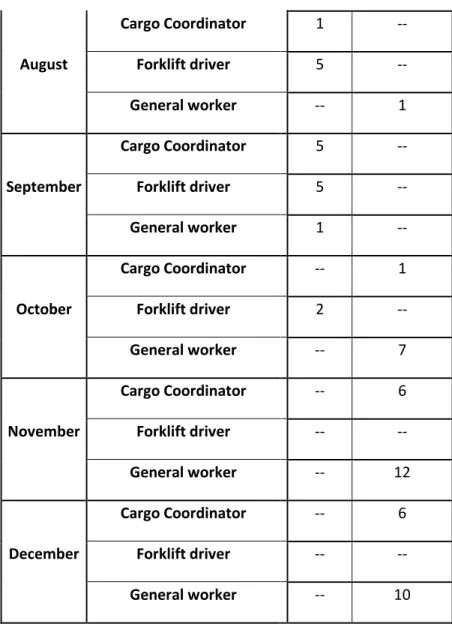
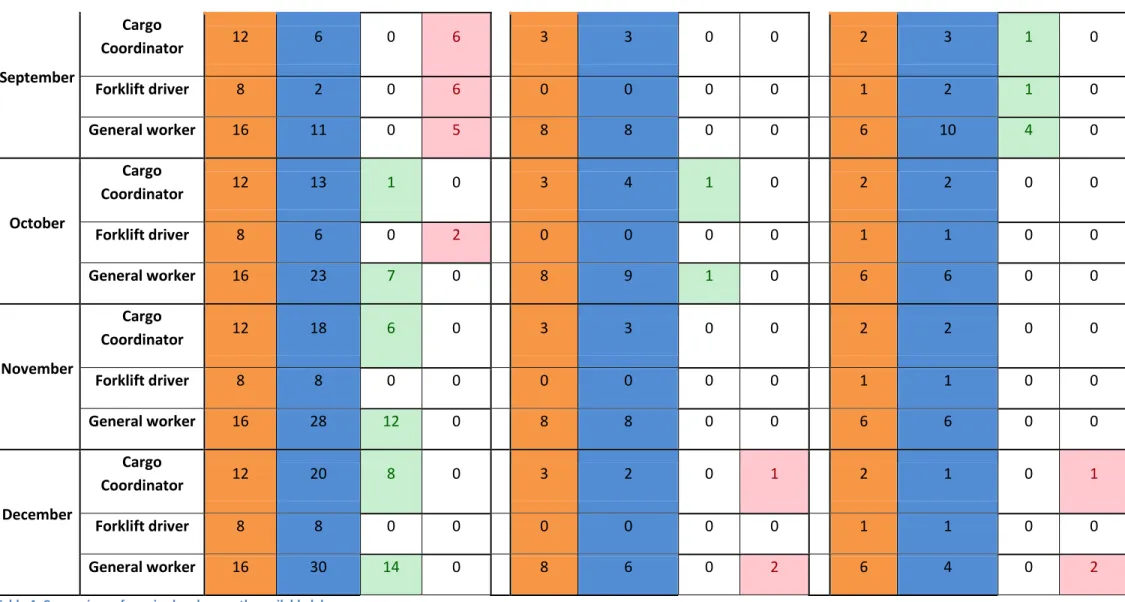
Y EARLY W ORKFORCE PLAN
This shows the scope for the expected number of workers that should work in the warehouse to avoid under-utilization and over-utilization of workers. This indicates the range of workers that should be added to the warehouse during a given month to avoid overutilization of workers. This shows the scope for workers that can be transferred from the warehouse to other warehouse warehouses during a given month to avoid underutilization.
C ONCLUSION AND R ECOMMENDATIONS
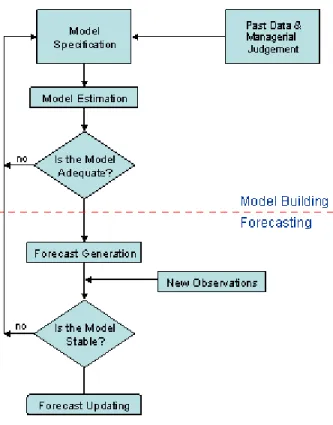
The model building and forecasting phases [Online]. lt;http://home.ubalt.edu/ntsbarsh/stat-data/forecast.htm#rintroductionf> [Accessed 15 April 2012]. http://www.people.brunel.ac.uk/˜mastjjb/jeb/or/forecasting.html. Simulation-Based Capacity Planning and Scheduling with AutoSched, Proceedings of the 1993 Winter Simulation Conference, Ed. The AMP+AKZO Company's Simulation-Based Finite Capacity Scheduling System, Proceedings of the 1994 Winter Simulation Conference, Ed.