Cape Town
UNEMPLOYMENI' IN BISHOP !AVIS
Andrea Blau, Jarres Thares et. al.
Saldru Working Paper No. 47
August 1982
,
,
-,
'J
This study originated as part of the 1981 third year Industrial Sociology CXJurse at the University of Cape TCMn. The basic research (April - August 1981) took the fonn of a project conducted by a group of seven students (Andrea Blau, Niven J3cMers, Barry Hill, Wayne Maddams, James Thomas, Rick Wedderburn and Brett Williams) . 'lWo of us prepared this paper for publication as a further CXJurse requirement.
We would like to express our appreciation to the Southern African Labour and Development Research Unit (Saldru) for the generous grant which made this research possible. We also wish to thank Eric Atm::>re and Lieb L:Jots for their invaluable guidance and assistance in defining the scope and field of our research. We are also grateful for the hard work of our team of social science undergraduates fran the University of the Western cape who administered the questionnaires (Stafford Issac, Marcelle Rinkwest, Rubert van Blerk, Derek Erasmus, Lionel Nicholas, Trevor Bailey, Charles Wilson, Cedric. Jewell, Rowina Fischer, Dilawer Latief, Imelda Taylor, Deborah Erasmus, Pat Kelly, Charmaine Mekleur).
Finally we thank members of the Sociology and Econanics departments at the University of cape TcMn. Special mention must be made of the constant support of Bill Cowan, our co-ordinator, who helped steer us through the various stages of this project.
James Thanas Jlndrea Blau
[!
I
J
,
t·
• I~
'\'
!
/ ) \
TABLE OF CQ.\lTENTS
LIST OF TABLES AND FIGURES ABSTRACl'
INl'ROOOCTICN MAP
BISHOP LAVIS lJ:X;ation
Historical Background and Development Bishop Lavis and the Western cape Mim!OOOLCGY
Unemployrrent Underemployrrent The Survey The Sanple UNEMPIDYMENT
Economically ,Active Unemployment results Discussion of Unemployment UNDEREMPIDYMENT
PROFILE OF THE UNEMPWYED
THE NATURAL RATE HYPOl'HESIS/STRUCTURALIST DEBATE The Natural Rate Hypothesis
The South African Structuralist Perspective REFERENCES
Page i i i
1 2 3 3 3 4
11 11 13 15 16 16 16 17 21 23 29 32 32 34 37
2 3 4 5 6 7 8 9 10 11 12 13 14 15 16 17 18 19 20 21 22 23 24 25 26 27
2
TABLES Page
Economic Situation of Cape Town's 'coloured' Townships (1970) 5 Bishop Lavis Age Pyramids - 1970 and 1981
Distributions of Households by Household Size Inccme of Male \'lage-earners (1981)
Income of Female Wage-earners (1981) Per capita Income (1981)
Occupations of the Employed (1981) Bishop Lavis Education Level - 1970 Bishop Lavis Education Level - 1981 Post-School Qualifications - 1981
Breakdown of Not Economically Active people (1981) The Goverrnnent Definition of Unerrployment
The Government Definition plus People not able to accept a job within one week
The Government Definition as in Table 13 - including pecple who did not look for work in the past lIDnth
Our Definition - Visible Unerrployment
OUr Definition - Visible and Invisible Unerrployment Unerrployment Rates according to the Varying Definitions C.P.S. Percentage Urban Unemployment 1980/1981
IIbnths Worked in the past Twelve - Unemployed Only (1981) Months Worked in the past Twelve - Employed Only (1981) Hours Worked by the Employed in the Past Week (1981) Length of Time Spent Looking for a Better Job - Employed Only (1981)
Number of Previous Jobs - Work Seekers Only (1981) Work Seekers' Reasons for Leaving Their Last Job Reason the Unerrployed Gave for not Working How the Unemployed Survive
Methods Used to Find Work
FIGURES .
Graph of Months Worked in the Last Twelve - Employed and Unemployed
Graph of Hours Worked in the Past Week
5 6 7 7 8 9 9 10 11 17 18 18 19 19 20 20 21 24 24 26 28 29 30 30 31 31
25 26
I:
I
II I
I.
,"
I
I'
II.
i:
I,
ABSTRAcr
This study centered on rreasurerrents of unemployrrent in the Western Cape, focussing on Bishop Lavis. There was also an investigation of the causes of unemployrrent, in tenT'S of the Structuralist/Natural Rate Hypothesis debate. The rrethod of enquiry adopted was a survey, which was conducted in June 1981 by enurrerators from the University of the Western Cape on a cluster sample of 2 086 econanically active people in Bishop laviS. Main findings were that the governrrent definition of unernployment generated an unernployrrent figure of 9,5%, while our wider definition o~ unemployrrent generated an unernployment figure of 13,9%
(a difference of 4;4%). SUbjective underemployment figures calculated were as high as 68%. These findings were discussed in relation to opposing theoretical views of unernployment in South Africa, and our conclusions were that the rejection of either the Structuralist or natural Rate Hypothesis perspectives as adequate explanations of the causes of unemployment could only be the result of an ideological value-judgerrent.
Unemployment has always been an emotive topic because it deals with the plight of people in distress. Argument about different theories waxes furious, always reinforced by statistics which tend irrefutably to bolster the particular stand taken. We have tried not so much to add to the fray, but to care to a better understanding of the social context behind the naked facts.
The unemployment question has been studied comprehensively among African people in South Africa and neasures of African unemployment have been calculated (although a universally accepted definition of unemployment has not yet been established, causing problems in this area). Little work has been undertaken on . 'coloured' unemployment and it was for this reason that our study focusses on the unemployment of 'c,')loured' people in the Western Cape. Governnent statistics using a very descriptive definition of unemployment tend to mask the problem. Although a number of First World countries (e.g.U.S.A.) adopt the sane definition of unemploynent, we contend that nerely superimposing this definition onto an underdeveloped Third World labour market, such as that in South Africa, is unsuitable.
Contextual criteria such as job availability, labour mobility, the state of economic development and the overall skill of the labour force have to be taken into account for any completely satisfactory neasure of unem- ploynent.
Our study compares statistics based on the S.A. governnent definition with figures based on wider definitions of unemploynent. We have set out to provide a context for understanding unemployment by calculating different neasures of employment, unemployment and underemploynent.
Our study is situated within the debate between two theoretical perspec- tives on unemploynent, nanely the Structuralist and the Natural Rate Hypothesis theories. The latter theory, held by certain economists, has been criticised as being distinctly inadequate in the South African context. However as it remains a widely held view in certain circles our study has in part been an attempt to submit this hypotheSis to empirical test.
OF BISHOP LAVIS TOWNSHIP (1981)
w
(f)
< --' lL
3.
Bishop Lavis TONnship, a self-contained and manageable area in the Western Cape, was chosen as the focus of our study. An advantage was that it afforded an opportunity for working with the Foundation for Social Development,an independent grassroots community organisation in
~le area. We hoped that this would give our research greater credi- bility in the eyes of the oommunity.
BISHOP LAVIS Location
Bishop Lavis is a tcwnship housing 'ooloured' people and is situated 16krn frcrn the centre of Cape Tcwn, near D.F. Malan Airpcrt. Its l=ation is close to the industrial areas of Epping, Parow and Belville Scuth and it is well serviced by public transport, both train and bus. (See map on page 2).
Historical BaCkground and DevelOpment
Bishop Lavis is cwned and administered by the Citizens' Housing League, a non-profit welfare organisation, which certain religious groups concerned abcut the housing and welfare of the citizens of greater Cape Town, started in 1927. Bishop Lavis developed in phases and the first 400 houses were built in 1941. These were four-bedroamed houses with electricity. In the early 1960s, with the proclamation of the Group Areas Act, the tcwnship acquired three-guarters of its present population who were rel=ated, rrostly frcrn Goodwood, ParON, Vasco .and the Transkei.
The Citizens' Housing League which began with such noble aims is now little more than a government institution.
Bishop Lavis nON contains 3 362 dwellings of which 24% are two-rocrned, 16% are three-rocrned and 60% four-roamed. Overcrowding has grcwn pro- gressively worse since the Group Areas influx and there is nON a four year backlog in housing applications. Houses are all=ated solely to Bishop Lavis males who may only apply once they are married.
l
,,.
~, .1
I t
j'
Harre a"mership is limited and most houses are rented. Only about 600 houses have electricity and the whole ta"mship is illuminated by approx- imately 12 very high flood-lights. There are a number of schools and churches and a oentral sports area which was completed in 1969. The tONnShip also boasts Cape TOwn's seoond 'Trimpark' (for overweight executives) . There is a oentral shopping area with a cinema, day- hospital and a library nearing completion. All roads have reoently been tarred at great expense.
Increased overcrCklding has brought with it a number of socially connected problems including a high incidenoe of crime and gangs.
Insofar as 'political' representation is concerned, the Management Ccmnittee and Ratepayers Association are both unpopular and seen to be largely unrepresentative. A new organisation, the Bishop Lavis Action Ccmnittee,. has managed to mobilize the cOmmunity around the issues of electrification. '
Although parts of the ta"mship have the basic facilities required for urban existence, there are significant gaps in these facilities in relation to wider needs of the comrunity.
Bishop Lavis and the Western Cape
In order to appreciate the relevance of our study Bishop Lavis should be related to other 'coloured' ta"mships in Cape Ta"m. Unfortunately no comparative statistics of unemployment are available. The following f'igures, based on the 1970 census, ShCM the econanic situation of Bishop Lavis in relation to other ta"mships in' the rretropoiitan area of Cape Ta"m as a whole.
Bishop Lavis
was
the third smallest 'coloured' ta"mship in the rretropoli tan area, in terms of population and the lowest but one in terms of income, although the proportion of earners was not much below average. This would tend to suggest that it is one of the poorest 'coloured' ta"mships.TABLE 1
Economic Situation of Cape Town's 'coloured' Townships (1970) i Township Total ,"1edian Income per % of population
i
population wage earner/year earning Ii
Tiervlei 22 276 R568,62 34,9%'!
Bishop Lavis 26 309 R585,36 34,6%
Elsies River 63 723 R589,02 35,2%
I Manenberg 36 919 R594,60 32,0%
Retreat 37 971 R616,84 35,9%
Bcnteheuwel 40 648 R619,81 32,9%
Grassy Park 31 555 R640,40 34,5%
Heideveld 17 484 R653,21 35,1%
Athlone 62 595 R692,30 41,6%
Metropoli tan
Area of Cape 606 075 R604,50 38,8%
TCMn
Source: 1970 Population Census.
Specific Characteristics of Bishop Lavis
The follCMing tables ShCM some of the social characteristics of Bishop Lavis, drawn from our survey and where possible compared with 1970 Population Census data.
TABLE 2
2000 Male 12848
Bishop Lavis Age Pyramids - 1970 and 1981
CENSUS 1970
1000 o 1000 2000
Female 13461
. - ' - - - - 3 0 ---'c.,
.--h-_____ 20 _ _ _ _ _ _ _ ~ '--~---10---_.---'
Male 2~2
200 o 200
Female 2403
I,
i I
I'
,f
J
If
~
.I I·
r !
Oamparison between 1970 and 1981 data shows a distinct tailing off of the birth rate over the past ten years. This is partly because of the acute housing shortage. Older families are remaining in the houses and the free flow of young married couples m:Jving in is inhibited.
Young people marrying face a four year housing backlog and many m:Jve out of the area when they get rrarried. Thus m:Jst of the families m:JVed into Bishop Lavis after the Group Areas Act (1964) have now passed the
'babY bcx:rn' phase.
TABIE 3
Distribution .of Households by Household Size (1981) Number of People N\mIber of Percentage of CuIrulative
in Household Households Households
%
1 - 3 80 11,4 11,4
4 - 6 283 40,3 51,7
7 - 9 238 33,9 85,6
10 - 12 70 10,0 95,6
13- 15 27 3,8
,
99,4
16 - 18 3 0,4 99,8
19 - 21 1 0,1 99,9
Total 703 99,9 99,9
Note: Rounding off accounts for discrepancy in totals.
The interpolated nedian value is 6,7 people per household, indicative of the high rate of overcrowding already rrentioned as typical of an economically depressed area.
TABIE 4
I
,Number of People
TABIE 5
Number of Peopl e
I
150 - 125 100 -
75 - 50 25 -
o -
150 - 125 - 100 - 75 - 50 -
Income of Male Wage-earners (1981) - - - _ . _ - - - -
10 20
Ranrls per week
Income of Female Wage-earners (1981)
2
~ ~ ld.J·
--L--LJ-L.--L-I10 20 30 40 50 70 80 90 100 over 100
L __________________________________________________
~Rands per week
There is a marked discrepancy between the income of males and females, the rrodal class for female inccme being R25 - R30 per week and the rrodal income for males being R35 - R40 per week. The overall income distrib- ution for Bishop Lavis taking males and females together gives a mean of R48,03 per wage-earner per week with an interquartile range of R25 between R30 and R55.
,,' I
ti
TABLE 6
Per Capita Incare (1981)
! Ineare Cumulative
. (Rands per week) M F M+F % %
0
-
5 1 193 1 705 2 898 63,6 99,936 - 10 1 5 6 0,13 36,87
11 - 20 28 70 98 2,13 36,74
21 - 30 106 201 307 6,68 34,61
31 - 40 226 216 442 9,61 27,93
41 - 50 224 107 351 7,63 18,32
51 - 60 121 32 153 3,32 10,69
61 - 70 85 31 116 2,52 7,37
71 - 80 64 14 78 1,69 4,83
81 - 90 27 8 35 0,76 3,16
91 - 100 36 6 42 0,91 2,4
101 - 150 36 5 41 0,89 1,49
151 - 200 i 17 5 22 0,47 0,6
201 + .
I .
6 0 6 0,13 0,13Totals 1 2 190 2 405 4 595 99,93 99,93
!
Note: Rounding off accounts for discrepancy in totals
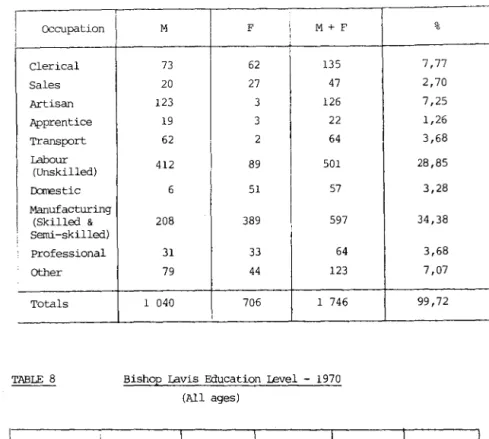
The largest employment cluster in Bishop Lavis (34,38% of those employed) is semi-skilled and skilled work in manufacturing. It is interesting howev!ll" to note that 55% of the women were employed in this category, while' only 20% of the ~ were so employed. Many nen (39,61%) described themselves as labourers (whether in manufacturing, constructi~n, connerce, etc.) • Relatively few employees are involved in more highly skilled work.
I
i
,
TABLE 7 Occupations of the Ehlployed (1981)
Occupation Clerical Sales Artisan Apprentice
I
Transport LabourI
(Unskilled) D::rnestic
I
Manufacturing (Skilled &! Semi-skilled) Professional Other Totals
TABLE 8
Std Passed i I 0
Less than Std 6 Stds 6 & 7 Stds 8 & 9 Std 10 University
Degree
Totals i I I
M
1
I F M+F73 62 135
20 27 47
123 3 126
19 3 22
62 2 64
412 89 501
6 51 57
208 389 597
31 33 64
79 44 123
1 040 706 1 746
Bishop Lavis Education Level - 1970 (All ages)
M F M+F
3 730 3 900 7 630 6 334 7 174 13 508 2 152 1 983 4 135
519 326 845
95 35 130
7
°
712 837
i
13 418I
26 255i !
Source: 1970 population Census.
%
7,77 2,70 7,25
1,26
I
3,68 28,85 3,28 34,38 3,68 7,07 99,72
% CUm. %
29,06 29,06 51,44 80,5 15,74 96,24
3,21 99,45 0,49 99,94 0,02 99,96 99,96 99,96
TABLE 9
I
Std. Passed0
I
Sub A I Sub B
I
I
Std 1 Std 2 I Std 3 Std 4 . Std 5 Std 6 Std 7 Std 8
I
I Std 9"!
Std 10
Bishop Lavis Education Level - 1981 (Excluding pre-schoolers)
M i F M+F
328 317 654
30 50 80
40 36 76
95 73 168
102 108 210
139 159 298
186 , 241 427
258 311 569
285
,
321 606179 193 372
145 133 278
49 35 84
67 41 108
1 903
.
, 2 018I
3 921I
% CUm. %
16,44 16,44
2,04 18,48
1,93 20,41
4,28 24,69
5,35 30,04
7,60 37,64
10,89 48,53 14,51 63,04 15,45 78,49
9,48 87,97
7,09 95,06
1,14 97,20
2,75 99,95
99,95 99,95
It is interesting to compare the difference in educational levels from
,
1970 (Census figures) to 1981 (our findings) • In 1970, 29,06% of the population had no formal education, while in 1981 this figure had dropped to 16,44%. The modal education category in 1981 was Std. 6 (15,45%), however the median was just over Std. 4. In 1970, 80,5% of the population had reached less than Std. 6, while in 1981, 63,04% were in this position.
The tables show a marked overall increase in the education level in Bishop Lavis from" 1970 to 1981.
The overiding feature of Table 10 is that 97,5% of the population have no post school qualifications. In comparing the Census figure for university degrees in 1970 (Table 8) to our findings in 1981, a slight improvement becanes apparent. In 1970, 0,02% of the population had university degrees and in 1981 this figure increased to 0,14%.
TABLE 10
Qualifications No qualifications University Technical Nursing Teaching Apprenticeship Secretarial Other Totals
Post-School Qualifications - 1981 (All ages)
M F M+F
2 171 2 398 4 569
6 1 7
17 5 22
2 10 12
4 12 16
15 2 17
6 2 8
24 11 35
2 245 2 441 4 686
MEI'HOOOWGY
%
97,50 0,14 I 0,46 0,25 0,34 0,36 0,17 0,74 99,96
Our study is an attempt to reveal the truth which the bald statistics conceal. The supposition is that existing measures of un~loyment in this region (where there is very little information other than govern- ment statistics) do not provide an accurate picture of the situation, largely because the conventional definition of unemployment is very narrow.
We have tried to test various definitions of unemployment and to investigate the extent of underemployment to reach a more meaningful picture of the employment-underemployment-unemployment relationship.
Unemployment
The official government definition of unemployment used for the Census figures and for the newly instituted, monthly, Current population Survey
(CPS) requires that a person:
1 . Desires to work.
2. Does not work (Le. has worked less than 5 hours in the past 7 days).
3. Has attempted to find work during the previous llDnth.
4. Is able to accept a position within one week.
5. Is between the ages of 15 and 64 i f male and 15 and 59 i f female.
If a respondent dces not satisfy all the above ccnditions and is not working (carrying out an occupation at the t:ime of the survey which includes: self-employment, unpaid family assistants, part-t:ime and temporary workers), he or she is classed as not eccnanically active.
This definition poses various problems. Exclusions from the definition are: (a) anyone~ who has worked for 6 hours during the previous week, (b) the chronically unemployed person who has given up looking for a job in the preceding llDnth (the discouraged worker phenomenon), (c) the migrant worker with family ties in the 'homelands', unable to accept a job within one week, and (d) the poverty stricken child under 15 years old unable to find employment, though desperately needing it.
These exclusions prompted our decision to adopt a broader social orien- tation in our definition in order to attain a llDre penetrating insight into the real situation. Our operational definiti~n of unemployment was:
Any member of the eccnanically active population who was not working and wanted to work regardless of whether they were looking for work or not. The only people we excluded from the category 'eccnanically active' were full-time students, those permanently medically unfit for work, those voluntarily retired and housewives not desiring work.
This fully developed poverty approach to unemployment is the International Labour organisation (110)· definition.
We planned to compare not only the governrrent measures of unerrployment with those of our own wider definition but also by progressively relaxing the government definition to examine how much each government exclusion actually contributed to the rate of unerrployment.
Undererrployment
There are as yet no official statistical figures on undererrployment although these are said to be forthcoming. Unofficial studies have revealed a high incidence of undererrployment. Sadie (1977) calculated an 8% unerrploy- rate, using the narrow definition, and a 25% undererrployment rate in South Africa in 1975. As with the definition of unerrployment there is no univer- sally accepted definition of undererrployment. However it is imperative to include the concept to reach a meaningful picture of the errployment - unerrployment relationship. This concept is difficult to tie down to an objective measure as it is open to a variety of interpretations.
We have adopted 'a fully developed poverty approach' (Bramberger, 1978) to capture the widest possible aspects of undererrployment. We have operation- alised a nwnber of measures.
1. People who wish to work for more hours for more pay whether they are actively looking for more work or not.
2. People whose present job is below their level of qualifications.
3. People who have been econanically active over the past twelve IIDnths but who have been unerrployed for same of that time.
4. People who have been less than fully errployed (involuntarily) based on the nwnber of hours worked in the past week.
Our operationalisation of undererrployment captures two distinct types of measurement of the concept.
(a) Underutilisation, i.e. working normal hours at a low level of
productivity or working below one's level of skill and qualifications.
I ~
l •
t
I
L
14.
This concept was only possible to neasure subjectively by asking respon- dents their opinions (see definition 2) .
(b) The second aspect is the neasurement of v.orking at full productivity for less than the desired arrount of time. This has been neasured both subjectively (by asking respondents if they wanted to work for more hours for more pay - see definition 1) and objectively, in terms of people v.orking for less than the full reference period (involun- tarily) in hours per week and month per year.
A further distinction can be rrade with regard to the tine period over which the undererrployrrent is measured. A' stock' neasurement indicates under- employment at any particular time (Le. definitions 1, 2 and 4) and a 'flON' measurement indicating underemployrrent over a reference period, Le. months v.orked in the past twelve (definition 3) .
We have included the subjective neasures as indicators as it is not possible to capture adequately the full picture of unerrployrnent by only using
entirely objective measures.
An additional dimension is introduced when considering the concepts of visible and invisible undererrployrnent. 'Visible' includes all those who have been working for less than the full reference period and have actively looked for nore errployrrent.
'Invisible' includes the follONing categories:
1. Underutilisation: people employed full time at a level that. does not use their skills.
2. Underproductivity: people employed full time at a very lON level of productivity for personal or structural reasons.
3. The discouraged worker phenClllE!non: those who have been working for less than the full reference period but who have given up looking for nore work, or those who have never looked for more work.
4. The working poor, poverty problem: people who v.ork full-time but who receive extremely lON wages.
The Survey
Our data was gathered by means of a survey questionnaire which was aimed at generating information concerning the government definition of unemploy- ment, wider definitions, underEmployment, as well as probing the nature of unernployment. The survey was designed to enable one member of the household to give the desired information adequately for the remainder of the house- hold menbers. We found that there were very few respondents who could not answer all the questions satisfactorily. I t soon became evident that information such as: deooc:rraphic details, job descriptions, IlDnths rut of work, incane, etc., were comron knowledge within each household. In order to min:imise biasing interviewer effects fourteen University of the Western Cape (U.W.C.) social science undergraduates (IlDSt having prior survey experience) were trained to conduct the survey. he attempted to involve them as fully as possible in the actual project. During their training, the information we hoped to generate from each question was fully discussed. The U.W.C. students translated the original questionnaires into Afrikaans and provided us wi th practical advice on the phraseology of particular questions.
A pilot study was used to:
1. Train the enumerators;
2. Test the questionnaire (two questions had to be rephrased to try to rEmOve ambiguity);
3. Enable open-ended questions in the pilot study to be pre-coded into specific categories.
The final questionnaire was administered by the enumerators during July 1981.
The following methods were used to control the quality of the information in the questionnaires:
1. As already explained, the enumerators were involved as fully as possible in the rationale and theory behind the survey;
2. Each ccrnpleted questionnaire was checked for anissions, faults and inccrnplete information. All problems were returned to the enumerators--' for correction.
1
J ..
~
households. Carparison of the paired questionnaires shcMed negligible minor differences;
4. On occasions, one of our research team acccmpanied enUllErators on their rounds;
5. SaTe households were visited by one of the research team to verify the contents of the questionnaire.
The Sairple
A multi-stage cluster sample was used for the survey, utiliSing the fact that Bishop Lavis has been divided into thirty-one official EnUllErator Sub-Districts (E.S.D. 's), each containing 600 to 800 people. We took a s:irrple randan sample of twenty-three households per E.S.D., giving a final sample of just over 700 households, in which we estimated (on the basis of a previous unpublished study of Bishop Lavis) that there would be about 2CXX>eoonanically active people. This was the sample size required for accuracy within ~I,5'1; at the 95'1; level of ronfidence (est:ilnating the unemployment rate to be in the region of 13'1;).
There were 42 refusals in the wrole survey (6%), which were replaoed. All refusals were noted in case we had to check for the possibility of systematic non-response. (The emnllerators were of the opinion that IOOSt of the
refusals had been due to respondents associating the questionnaire with the school boyrotts.) The . refusals were even! y spread over the E. S. D. 's with one exception being an E.S.D. in a relatively well-off area with a high percentage of professional and white collar workers where there were eight refusals. We did not think that this \\1Ould significahtly bias the results.
Econanically Active
This section deals with the determination of the economically active population, Le. all those in the labour market. A marked difference Can be seen in the government definition of unemployment as opposed to the wider definition we have used, precisely because the government definition excludes fran the economically-active sane of those wham the wider definition WJUld portray as tmemployed.
TABLE 11
1.
,2.
3.
'4.
,5.
6.
7.
8.
Breakdown of Not Economically Active Pegele (1981)
Classification No. of People Peroentage of Total
(Sample No. 4714) (Sample No. 4714)
Under 15, not at school 842 17 ,86
Full t:ime study 997 21,15
Housewife not wanting work 456 9,67
permanently medically unfit
for Y.Qrk 147 3,12
Voluntarily retiredl 186 3,95
OUR DEFINITION 2 628 55,75
(Unemployed) oot able to
accept job within 1 week 2 0,04
(Unemployed) not having looked
for Y.Qrk in previous month
i
32 0,68(Unemployed) not presently
looking for a job 67 1,42
CDVERNMENT DEFINITION 2 729 57,89
1. Voluntary, as opposed to people who have been officially retired due to age, but nevertheless desire to Y.Qrk.
The labour force participation rate (L.F.P.R.) is defined as the peroentage of the 15 years and older group who are eccnanically active. In te:r.rns of our broader definition, the L.F.P.R. for Bishop Lavis in 1981 is found to be 62,9%. A total of 1 395 (29,6% of the sample) VJere found to be under the age of 15. Altogether there were 1 796 employed and 2 918 people dependent on them, and a mean value of 2,53 employed persons per household.
Unemployment Results
The narrow government definition of unemployment excludes fran the definition of unemployed:
1. The person who has Y.Qrked for IIDre than 5 hours in the past 7 days;
2. The person who has not attempted to find Y.Qrk during the previous month;
~
I
r
4. Anybody who is not between the ages of 15 and 59, if ferrale, and 15 and 64, if male.
In the tables that follow, the numbers of economically active people increase because the government definition of unemployment excludes certain people as not economically active while the wider definitions include them as economically active and unemployed, e.g. people who are looking for work but who have not looked specifically in the past month.
TABLE 12
The Government Definition of Unemployment
Number economically active Nurrber unemployed
Percentage unemployed
1 985 99M 90F
9,5%
There is little difference when one adds to the government definition all those people who were not able to accept a job within one week. (This still excludes from the definition of unemployed: (1) the person who has worked over 5 hours in the past 7 days; (2) the person who has not attempted to find any work during the previous month and (3) anybody who is not between the ages of 15 and 64, if male, and 15 and 59, it:Jemale.) The unemployment rate generated in this case is 9,6%.
TABLE 13
The Government Definition plus People not able to Accept a Job within One Week
Number -economically active . Number unemployed
Percentage unemployed
1 987 1<XM 9lF
9,6%
A larger difference can be seen when one includes in the definition of unemploy- DEnt all those people who did not look for a job in the past llDnth. (This still excludes: (1) the person who has worked over 5 hours in the past 7 days, and
(2) anybody who is not between the ages of 15 and 64, i f male, and 15 and 59, i f female.)
TABLE 14
The unemployn-ent rate generated in this case is 11,13%.
The GoveI11IlEnt Definition as in Table 13, including People who did not look for Work in the past Month
Number economically active Number unemployed
Percentage unemployed
2 021 114M lllF
1l,13%
Orr
=
definition of unemployn-ent can be divided into two aspects, namely visible and invisible unemployment. .Visible unemployment was defined as being all those people who want to work (and who are looking for work) . The unemployment rate in this case remains ll,13%.TABLE 15
Our Definition - Visible Un~lqyment
Number economically active 2 021
Number unemployed 114M lllF
Percentage unemployed ll, 13%
Orr definition of invisible unemployment included all those people who want to work, whether they are actually looking for work or not. This drastically increases the unemployn-ent rate to 13,9%.
.'
~
t
1Our Definition - Visible and Invisible Unerrplqyment
Number economically active NlU11ber unerrployed
Percentage unerrployed
2 086 135M 155F
13,9%
we
did not stipulate any age limits in our definition of 'not economically active' due to our interest in investigating whether there were people outside the governrrent age limits who desired errployment. Results indicated, ha.ever, that nobody who wanted errployment fell outside the governrrent age limits.D.le to the fact that the variable concerning the nlU11ber of hours worked in the past week was seen as problematic in terms of any definition of unerrployment, it was decided that this category could best be discussed under the concept of undererrployment.
The results of this section of our survey can be sumnarised in the folla.ing Table.
TABLE 17
Unerrpl~t Rates according to the Varying Definitions
Definition of Unerrployed Male Female No. Econailically Percentage Active Unerrployed
l. The Govt. definition of 99 90 1 985 9,5%
unerrployed
i
2. The Govt. definition plus: 100 91 1 987 9,6%
people not able to accept
I
job in one week
!
3. Govt. definition as (2) 114 111 2 021 11,13%
including those who did not look for work in past nonth
4. OUr definition - visible 114 111 2 021 11,13%
unerrployment
5. Our definition - visible 135 155 2086 13,9%
plus invisible unerrployment
•
Discussion of Unerrployment Results
TI1e results of our survey enable us to compare the government measures of unemployment with those of our own definition, and also see how much each exclusion in the government definition contributes towards decreasing the measured rate of unemployment.
llie official government figure for unemployrrent is measured by the Current Population Survey (C. P • S .) and the IT'Onthl y Department of Lal:x:>ur returns.
llie C. P . 3., urban figures for • coloured' unemployment in the Cape Province are canputed frc::rn a sample of 2:3 700 people drawn in a cluster sample from the magisterial districts of Bellville, Cape Town, SiIT'Onstown, Wynberg, East London, KiJIDerley, Port Elizabeth and Uitenhage.
TABLE 18
C.P.S. Percentage Urban Unerrplgyment 1980/1981
Month R.S.A. Cape Province
July 1980 6,3% 7,0%
August 5,6% 6,7%
Septerrber 5,0% 6,0%
October 5,1% 5,4%
November 5,0% 6,3%
January 1981 5,7% 6,5%
February 5,0% 6,0%
March 5,0% 5,7%
April 4,7% 5,7%
May 4,7% 5,4%
June 4,1% 4,75%
July 4,2% 4,5%
Source: Dept. of Statistics, Statistical News Releases, p.27.
llie C.P.S. showed a steadily declining unemployrrent rate as the economy entered an expansionary phase.
, ,
r
I,
At first glOU1ce, the figure we obtained using the C.P.S. definition (9,5%) seems very high, but it must be remembered that Bishop Lavis is one of the lower income townships in the Western Cape.
Turning to the broader ~lications for South Africa as a whole, adding the variable 'people who are not able to accept a job within a week' to the government definition did not substantially increase the rate of unemployment in our survey. This was expected, however, as our survey was oonducted in an urban area. The ~act of this criterion would probably be ITOst dramatic aITOngSt prospective migrant workers in the 'harelands'. It has been suggested that the migrant worker, with social and family ties in the 'harelands' could well have difficulty in accepting a job in the urban area within one week and thus it is expected that excluding this category of people, as in the government definition of unemployrrent, would substantially decrease the measured rate of unemployment in such an area. Could this be seen as a government legitimation for returning pass offenders and 'illegal' job seekers, such as the 'Nyanga squatters' to the harelands? The political ~lications of this are oon- siderable when one takes into acoount the persistently high levels of unem- ployment unofficially estimated in the 'homelands'.
The increase in the measured rate of unemployment is apparent when one adds to the governrrent definition of unemployment those people who 'did not look for a job in the past ITOnth'. The people who are affected by the exclusion of this variable in the government definition of unemployment are those who can be described as chronically unemployed or disoouraged workers.
It is interesting to note that there were 58 people who said they were actively looking for work, but had not looked specifically in the last ITOnth.
Bearing .in mind the oosts of work-seeking to people in poverty, this suggests a possible weakness in the official definition as it would exciude a number of legitimate work seekers from being seen as eoonamically active and thus unemployed •
In our wider definition of unemployment, we felt it necessary to distinguish between visible and invisible unemployment.
OUr definition of visible unemployment included all those people who wanted a job and who were actually looking for a job. This definition generated an unemployment figure of 11,13%. This figure is the same as the totally relaxed government definition. The gap between the definitions widens
significantly when one includes invisible unemployment, seeing all people who want work as unemployed, whether they are looking for work or not. This fully developed poverty approach generates a 13,9% rate of unemployment in Bishop Lavis, an increase of 4,4% in corrparison with the governrrent definition.
Generalising these results to the population of South Africa as a whole, it is evident that our definition will always generate larger figures than the official government definition. The extent of the" difference, however, will be detennined by a number of factors related to search oosts, such as:
1. The accessibility of potential enployers to work seekers;
2. The efficiency of the job vacancy commmication system;
3. The transport infrastructure and distance from industrial centres.
In discussing the implications of the government definition of unenployment as opposed to a wider definition, one might query whether it is the governrrent' s intention to obtain a realistic unemployment figure. I f the governrrent unem- ployment figures are seen as a realistic measurement, then one must also accept that it is realistic to define people who cannot accept a job within one week, and people who have not looked for work in the previous m:mth as not economically active, while people working for six hours per week are fully employed. If one doubts that the governrrent intends to obtain realistic unenployment rates and is instead attempting to lower the unemployment figure by excluding a number of seemingly obviously unemployed people, conclusions could ?Oint in the direction of a political motivation for this.
UNDEREMPLOYMENT
Our first indicator is an objective flow measurement of visible under- employment. Table 19 shows the work status over the past year of the people we found to be unemployed. This is followed by a similar table
(Table 20) of those we found to be employed.
TABLE 19
l'bnths Worked in the past Twelve - Unenployed Only (1981)
l'bnths M F M+F %
o
58 73 131 60,361 2 1 3 1,38 ,
2 2 2 4 1,84
3 2 1 , 3 1,38
4 2 2 ! 4 1,84
5 3 6
i ,
9 4,146 6 6
I
12 5,52
7 3 2 5 2,30
8 6 9 I 15 6,91
I 5,99
9 8 5
·1
1310 8 7
I
15 6,9111 0 0 0 0
12 2 1 3 1,38
TOTAIS 102 115 217 99,9
TABIE 20
l'bnth Worked in Past 12 - Employed Only (1981)
l'bnths
o
1 2 3 4 5 6 7 8 9 10 11 12
M
3 33 9 16 10 15 68 10
9 7 11 17 812.
F M+F
2 5
14 47
16 25
16 32
15 25
7 22
48 1161
8 18
6 15
5 12
5 16
8 25
533 i 1 345
%
0,29 2,75 1,46 1,81 1,46 1,29 6,81 1,05 0,88 0,70 0,94 1,46 78,97
Cum %
60,36 61,74 63,58 64,96 66,80 70,94 76,46 78,76 85,67 91,46.
98,57 98,57 99,95 99,95
Cum %
0,29 3,05 4,52 6,40 7,86 9,16 15,97 17,02 17,90 18,61 19,55 21,02 99,99
lTOTAIS !
1 020 I 683 1 703 99,94I
99,991. This figure for unemployrrent in the past six roonths is high. This oould be either because of respondents' estimation error or because respondents inter- preted the question 'HON many ITOnths have you worked in the preceding 12?' as
'HON many ITOnths have vou worked this vear. 1981?'
Figure
Percent 00
60
40
20
Graph of Months Worked in the Past 12 - Employed and Unerrployed (1981)
UNEMPLOYED EMPLOYED
80
60
40
20
~/,
/:,,~2 4 6 8 10 12 2 4 6 8
Mooths Worked Months
..-!
10 12
Worked
To prevent an overlap between the errployed and the unerrployed, this measure of undererrployment focuses only on those people who were fully errployed at the time of the survey. Of the 1 796 fully errployed, only 79% had worked for the full twelve months. Thus, 21% (between 16% and 21% as a conservative estimate - see Note 1, Table 20), were in fact UI1errployed at same time in the past twelve rronths.
In comparing the graphs, it is interesting to note that the economically active population, viewed over a period of twelve rronths, shows a great division between full errployment and unerrployment. 60,36% of the unerrployed have not worked at all during the last twelve rronths, whereas 79% of the employed have worked for the full twelve rronths. A possible reason for this is that jobs are difficult to get and so, once employed, people tend to hang onto their jobs despite dissatisfaction, which is discussed later in this section.
There appears to be no significant difference in figures of underemployment between males and females.
In contrast to the previous measure of undererrployment over a twelve month flow, the following figures show a stock measurement.
1
j
i.
I
!
I
l l
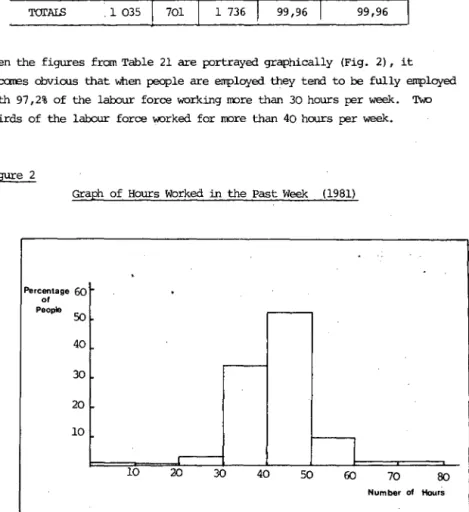
IHours Worked by the Enp10yed in the Past Week (1981)
;
,
!
Number Hours 1 - 10 11 - 20 21 - 30 31 - 40 41 - 50 51 - 60 61 - 70 71+
TOI'AIS
! M
7 4 13 321 547 113 16 4 .1035
!
;
i
i
I
J IF
9 5 18 258 354 42 6 9 701
M+F 16
9 31 579 901 155 22 23 1 736
i
%
0,92 0,51 1,78 33,35 51,90 8,92 1,26 1,32 99,96
Cum %
0,92 1,43 3,21 36,56 88,46 97,38 98,64 99,96 99,96
When the figures from Table 21 are portrayed graphically (Fig. 2), it becares obvious that when people are enp10yed they tend to be fully enp10yed with 97,2% of the labour force working !lOre than 30 hours per week. 'I'M:>
thirds of the labour force worked for !lOre than 40 hours per week.
Figure 2
Graph of Hours Worked in the Past Week (1981)
Percentage 60
01 People
50
40 30 20 10
I
10 20 30 40 50 60 70 80
Num ber of Hours
range). 8,5% of the people work for IlDre than 50 hours a week, i.e. more
U1~1 10 110urs a day for five days a week (85% of the workers work a five day week) .
In measuring underemployment, it is significant to point out that only 3,2%
of the employed worked for less than 30 hours per week. This can be expected in an urban area, such as Bishop Lavis, where people tend either to be fully employed in wage labour or unemployed.
We were unwilling to adopt an arbitrary cut-off point for unemployment, as the official definition does, when it categorises all those who have worked for less than 5 hours in the past week as unemployed. This does not deal adequately with the employment-unemployment continuum. For a more meaningful picture
(as our results show), anyone who is working for less than 30 hours per week involuntarily, should be regarded as underemployed as this seems to be a clear cut-off point.
Although women tend to work slightly fewer hours than men, there is no marked differenoe.
MJving on to the IlDre subjective evaluation of underemployment, respondents were asked whether household members would want to work longer hours for more IlDney. This measures two aspects of underemployment, namely, not working for the full reference period (visible underemployment) and working for the full reference period at a wage that is felt to be too low (invisible underemployment). ,
Of the employed people, 68% (1 221) said that they would like to work for a greater number of hours for more pay (visible and invisible underemployment) . Nearly 20% of these (341) said that they were actually looking for such a job
(visible underemployment) .
TABLE 22
Months
0 2
3
-
56
-
89 - 12 13 - 18 19 - 24 25 36 37 + 'lUl'AIS
28.
Length of Time Spent Looking for a Better Job E'"Ployed Only (1981)
M F M+F %
67 47 114 33.43
28 25 53 15.54
32 20 52 15.24
27 28 55 16.12
4 5 9 2.36
20 13 33 9.67
6 8 14 4.10
8 3 11 3.22
192 149 341 99.68
CUm. %
33.43 48.97 64.21 80.33 82.69 92.36 96.46 99.68 99.68
It is interesting to note that even though the labour force is working for a rredian value of 47 hours per week, 68% of them would be prepared to work longer hours for rrore pay. Evidently when the mean inc:are in Bishop Lavis per capita per week is ru8,74 people desperately need to supplement their meagre inc:ares.
Our final subjective measure of underemployment was another self-assessment - inquiring whether people felt that their particular skills or qualifications were being adequately used in their jobs. This was an attempt to get to grips with underutilisation of skills.
Three hundred and forty-two people, or 19.6% of the workforce, did not see their jobs as fully utilising their particular skills. The rrodal class for the whole population is an education level of Standard Six. It can be seen fran Table 9 that there were very few post school qualifications, i.e. 6.7%
of the labour force.
The underemployment section can be drawn together as follows: objective, visible underemployment seems to be at a rate of
:!:
20%. Thus, of the econanically active,:!:
14% are unemployed and 20% underemployed. This leaves 66% fully employed. Looking at a subjective self-assessment of underemployment (visible and invisible) 1 68% of the employed saw themselves as underemployed.1. There is strong resistence to this fully-developed 'poverty approach' to under- employment. (Bramberger, 1978, in Simkins and Desrrond (eds.) S.A. Unemployrrent:
A Black Picture) .
PROFILE OF THE UNEMPLOYED
Using our widest definition of unemployment we found 55.3% of the unemployed to be women and 44.7% to be male. The mean age of the unemployed was 26 years in a skewed distribution (interpolated median 22,3 years) with the rrodal age-group being 18 to 20 years. This canpares with the survey population as a whole, where the age distribution for those over 15 years is slightly lONer (mean 25, median 20,34). The education level of the unemployed is slightly lONer (mean = median = Standard 5) than for the over-15 survey population (mean 5,8, interpolated median 5,3). Of the workseekers 91% of the men and 81% of the wcrnen had worked before.
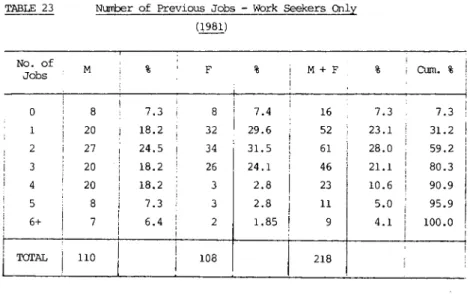
TABLE 23 Number of Previous Jobs - Work Seekers Only (1981)
No. of
M % F % M+F % Cum. %
Jobs
0 8 7.3 8 7.4 16 7.3 7.3
20 18.2 32 29.6 52 23.1 31.2
2 27 24.5 34 31.5 61 2B.0 59.2
3 20 18.2 26 24.1 46 21.1 80.3
4 20 18.2 3 2.B 23 10.6 90.9
5 B 7.3 3 2.B 11 5.0 95.9
6+ 7 6.4 2 loBS 9 4.1 100.0
TOI'AL 110 lOB 21B
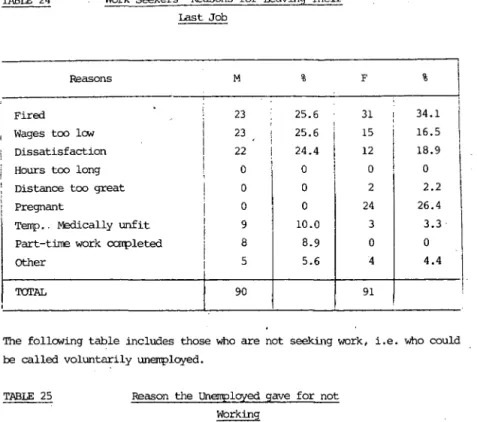
The reasons given for leaving their previous employment are given in the follONing table.
'I
I ~
~
t
i I I
i I
~
..I
I I
I
I
TABLE 24 Work Seekers 0 Reasons for Leaving Their Last Job
Reasons M %
Fired 23 25.6
Wages too low 23 25.6
Dissatisfaction 22 24.4
Hours too long 0 0
Distance too great 0 0
Pregnant 0 0
Terrp .. M2dically unfit 9 10.0
Part-time work cCXlpleted 8 8.9
Other 5 5.6
i
TOl'AL 90
F 31 15 12 0 2 24 3 0 4 91
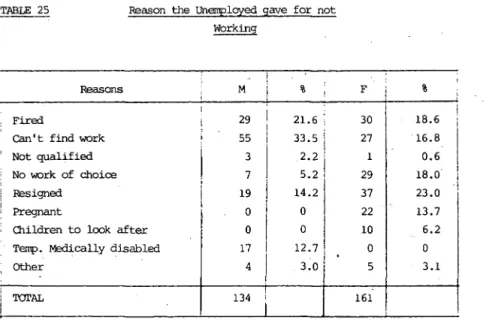
The following table includes those who are not seeking work, i.e.
be called voluntarily unerrployed.
TABLE 25 Reason the Unerrployed gave for not Working
Reasons M %
Fired 29 21.6
can't find work 55 33.5 :
Not qualified 3 2.2
i
No work of choice 7 5.2 !
Resigned 19
1~.21
Pregnant 0
ClIildren to look after 0
1~.
71Temp. M2dically disabled 17
3.0
i
Other 4
TOl'AL 134
i
F 30 27 1 29 37 22 10 0 5 161
%
34.1 16.5 18.9
0 2.2 26.4 3.3 0 4.4
who =uld
%
18.6 i 16.8
I
0.6 I 18.0
I
I 23.0 ! 13.76.2 0 3.1
wage labour.
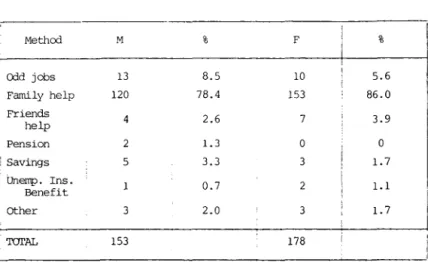
TABLE 26 How the Unemployed Survive
Method M % F %
Cdd jobs 13 8.5 10 5.6
Family help 120 78.4 153 86.0
Friends
4 2.6 7 3.9
help
Pension 2 1.3 0 0
: Savings 5 3.3 3 1.7
tJnemp. Ins. 0.7 2 1.1
Benefit
Other 3 2.0 3 1.7
TOI'AL 153 178 I 1
_ I I
From the above table it can be seen that the overwhelming majority, 78.4% of
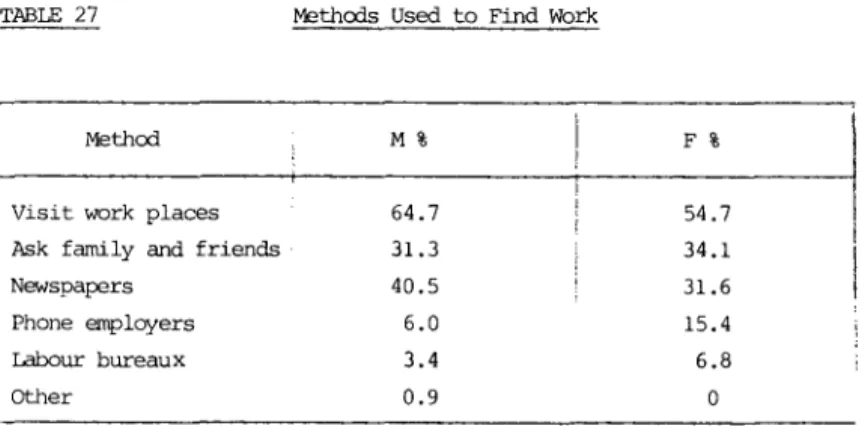
!lEn and 86.0% of warren, rely on their families to support them. It is interesting to note that only 1% claimed unemployrrent benefits as a rreans of subsistence. The following table outlines the different rrethods used by work seekers to look for work.
TABLE 27 Methods Used to Find Work
Method M % F %
Visit work places 64.7 54.7
Ask family and friends 31.3 34.1
Newspapers 40.5 31.6
Phone employers 6.0 15.4
Labour bureaux 3.4 6.8
Other 0.9 0
Note: The categories are not mutually exclusive i.e. more than one rrethod of work seeking was possible.
Visiting work places was the most carmon rrethod of looking for work, while very few work seekers made use of the official labour bureaux.
THE NATURAL RATE HYPOl'HESIS/srRUCI'URALIST DEBATE
In turning to causes of unemployment we have tried to shed more light on the debate between the proponents of two theoretical perspectives on the subject, narrely the Natural Rate Hypothesis and the Structuralist pers- pective. No meaningful understanding of the problem can be derived unless each of the perspectives is fully examined in its
=
context and the underlying assumptions of each are understood.The Natural Rate Hypothesis
The Natural Rate Hypothesis must be seen in tenns of its base in neo- classical econanic theory. As such, the main actors in society are seen as being individual producers and consumers and thus the focus of analysis falls on the process of exchange. The actions of econanic actors are detennined by their psychological preferences, factors exogenous to society.
Thus the decision to work is freely detennined by subjective preferences for inoame or leisure. Neoclassical econanics is an analysis of static equilibrium as a capitalist economy is seen as being in equilibrium or moving t.ONards it.
Based on these broad underlying assumptions, the specific assumptions of the model are as follONS:
1. The =ket is made up of buyers and sellers who have perfect knONledge and are free to maximise their individual utility.
2. There are"many small buyers and sellers (no monopolies).
3. All workers are seen as identical.
4. There are no constraints or barriers to entry into the =ket.
The Natural ~te Hypothesis is derived from an analysis of the supply and demand for labour. According to this theory, labour supply and demand will inevitably move towards a point of equilibrium where supply equals demand.
At this point, under ideal conditions, there is full employment at a wage
level which clears the market. If, for eXarI1Jle, there is an excess supply of labour, the market will clear by wages being reduced, which will increase the demand for and decrease the supply of labour.
According to the Natural Rate Hypothesis, those who are nat errployed at the market clear~~g wage are voluntarily unerrployed. This section is made up of three categories, namely:
1. 'pure voluntary' unerrplayment - those people who voluntarily withhold their labour power, not being prepared to accept a jcb at the market clearing wage (the rate at which supply and demand for labour reaches an equilibrium).
2. Frictional/Search Unerrployment - those workers who are for a time unerrployed while looking for a new job.
3. Institutionally-induced unemployment - those workers who are voluntarily unemployed due to man-made constraints, such as the influence of government policy (e.g. apartheid laws).
This model only recognises involuntary unerrplayment in the short term, when wages are above the market clearing point. A reduction in wages would restore the equilibrium. It is irlteresting to note that the market can clear at a wage level below that of subsistence.
The institutionally-induced category of unerrployment can be directly traced to atterrpts to deal theoretically with market imperfections. In the South African situation, none of the assumptions of the neoclassical model is met in reality. Buyers and sellers are not free to bargain to maximise their utility for a number of reasons. There is a tendency for wages to be sticky dONTlwards and thus before the market clearing wage is reached there is an up.vard pressure on wages. This can OCOlr due to minimum wage legislation (affecting about 14% of the working population), and social pressure (errployers remaining hesitant to employ blacks, even at lower wages, for fear of negative errployee or customer reactions (Schlemmer, 1976) and work seekers not being able to undercut others for fear of reprisal and social ostracism). Additional factors impeding individual freedom to maximise utility are institutionally induced factors preventing
labour nobility, both geographical (influx control, Group Areas) and occupational (job reservation) . Furthermore, contrary to the neo- classical model, buyers and sellers do not act as individuals as they form trade unions and employer organisations which bargain corporately.
The market is artificially segmented into urban and migrant workers who are therefore not equal. The assurrptibn that buyers and sellers are rational is also violated in reality as people do not know what is in their best interest because they do not have perfect information.
The South African Structuralist Perspective
In contrast to the Natural Rate HypothesiS, a neoclassical econanic concept, the so-called structuralist perspective adopts a more radical framework.
Classes rather than individual producers and consumers are regarded as the basic units of analysis and the focus is on production rather than exchange. M;)st inportantly for this debate, man is seen as being locked into his social context and his actions are thus determined by his position in SOCiety (owner or non-owner of the rieans of production). Thus his decision to work is determined primarily by his lack of access to the means of production and hence self support. One can contrast this directly with the neoclassical notion that a worker's decision to participate in wage earning activity is determined by his psychological preference for income or leisure.
For the structuralists, conflict and disharmony are seen as endemic to society, as opposed to the neoclassical View of there being :irrperfections in the market.
'!he structuralists maintain that unemployment is created by sane basic long term change in demand or technological conditions in the econany. ~st
of this is inVOluntary in that conditions causing unemployment are beyond the worker's control. The structural features which cause unemployment are based on technology, politics or aspects of theeconanic structure such as:
1 . Short term cyclical unemployment.
2. Surplus of black labour.
3. Skil.l.ed labour shortage and a =rresponding trend tcwards increasingly capilal-intensive technology.
4. Government decentralisation policy and influx =ntrol.
These structuralist features can te ccmpared to the institUtionally induced features used to explain market inperfections in the Natural Rate analysis, for example:
(a) Both see cyclical unerrployment as affecting unenployment in the short tenn, hcwever the structuralists see this as teing involuntarily inflicted on the workers as they are laid off in times of recession.
The Natural Rate proponents see this as teing 'tough' for everyone as wages go dcwn and workers refuse to participate in the labour market, voluntarily choosing leisure.
(b) The structuralists trace the surplus of black labour to historical factors which have resulted in few black fanners teing able to survive in Ule 'hanelands' with a =nsequent migration to look for jobs in the urban areas. The Natural Rate proponents would attribute such unenployed black labour to the fact that workers have unrealistically high expectations and are not prepared to accept a job at the market clearing rate, thus voluntarily withholding their labour.
(c) The structuralists argue that the skilled labour shortage has resulted in increasingly capital-intensive technology in South Africa, causing rising unerrployment. The Natural Rate proponents would argue that i f South African technology is too capital-intensive, this is a result of institutionally induced factors rather than a direct cause of unenployment.
(d) The structuralists propose that further involuntary unenployment is caused by the government decentralisation policy and influx control, while the Natural Rate proponents maintain that these institutionally induced constraints merely increase the rate of voluntary unenployment.