The central research question was: which specific factors hinder managers in the use of analytics in organizations. Daily login statistics collected from the electronic survey questionnaire provided quantitative results on the use of analytics within the organization.
CHAPTER ONE: INTRODUCTION
- Introduction
- Rationale of Research
- Business Background
- Problem Statement
- What is the Problem?
- How did the problem come about?
- Why should the problem be solved?
- Research Objectives
- Research Questions
- Research Design and Methodology
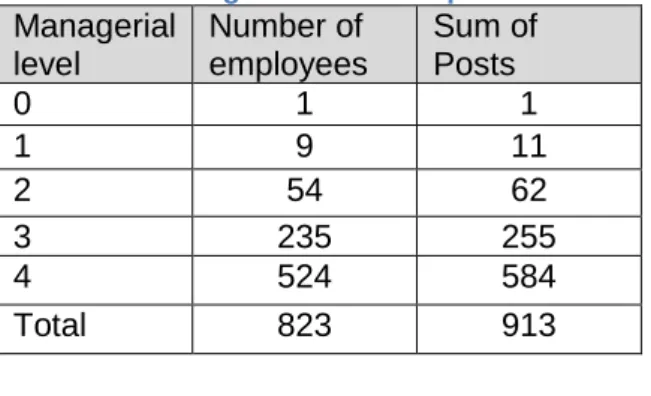
- Research Population / Site
- Data Collection Methods
- Unit of Analysis
- Data Analysis
- Qualitative Analysis
- Quantitative Analysis
- Ethical Considerations
- Summary
This is based on a performance measure of the monthly number of applications per job category to the SAP Business Intelligence system compared to actual management level applications. The findings from the datasets increase the validity and reliability of the study and complement the qualitative results.
CHAPTER TWO: LITERATURE REVIEW
Introduction
Within the studied organization, managerial use of analytics is at a low level of maturity. The organization needs to mature in analytics usage to gain greater benefits for success.
What is Business Intelligence?
Benefits of Business Intelligence
The inventory of SAP Business Intelligence reports has grown to one hundred and sixty, covering the following functional areas: finance, human resources, customer relationship management, public sector management, logistics, real estate and industry solution services. This is achieved by ensuring that all key performance indicators are validated with evidence of values derived from SAP Business Intelligence reports.
Management Functions
- Management accountability to analytics
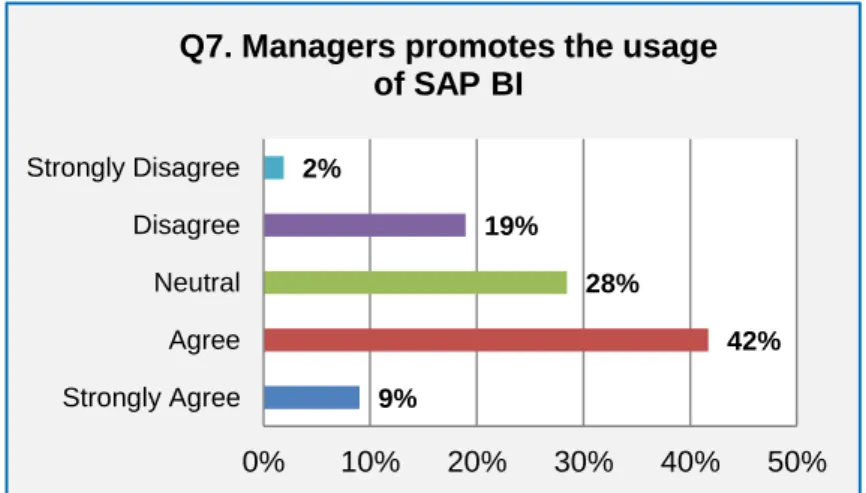
Therefore, one can conclude that the organization is not capitalizing on the wealth of information available to support management functions within the organization. Within the organization under study, it is clear that the management compliments do not support SAP Business Intelligence, as is evident from the low use of the analytical tool.
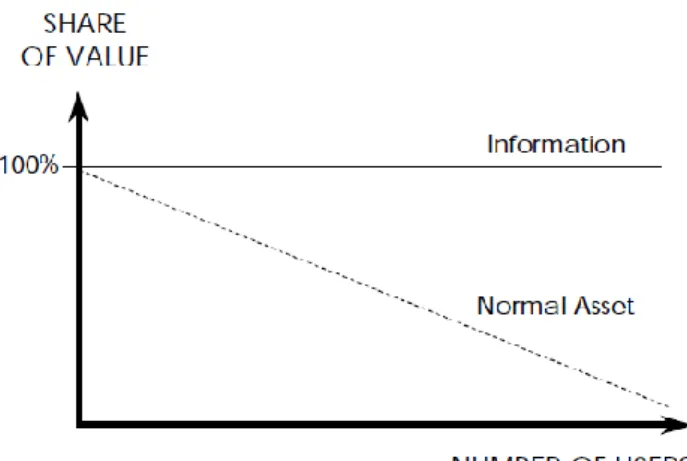
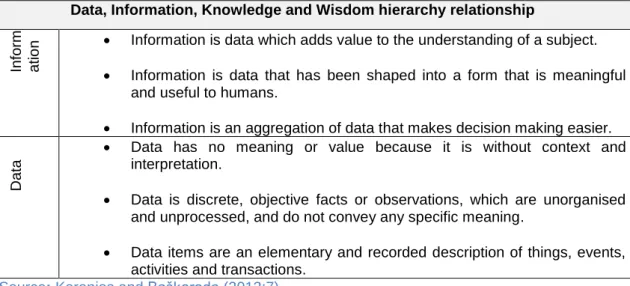
Information as an Asset
Information management should be a core function, cross-cutting for the organization, subject to control and resources in the same way as other functions. In the studied organization, information is considered as an asset that is important for operational processes.
The Nature of Information
Within the organization studied, the information culture is one of transparency within SAP Business Intelligence. In the context of the organization under study, information within SAP Business Intelligence can generate more information.
Types of Data
- Master Data and Transactional Data
Transaction data is current and outstanding transaction data that must be captured from the legacy system and defined for the SAP ECC6 applications for business process completion. Within the researched organization, master data, transaction data and historical data are the drivers of information reporting within SAP Business Intelligence.
Information Security Readiness
All production systems are external, while development and quality assurance customers are on site to mitigate any risk. These systems are at the core of the organization's operations and the Information Technology Department ensures that all systems are secure.
Corporate Performance Management
To make sure that the computers are properly protected, the Information Technology department has created a series of security measures, including antivirus software for all the computers and servers.
Theoretical Framework
- Individual Characteristics
- Age
- Computer literacy
- Education
- Prior experience
- Attitude
- Computer self-efficacy
- Personal innovativeness
- Computer anxiety
- Readiness for change
- Business Intelligence Systems Quality Characteristics
- Compatibility
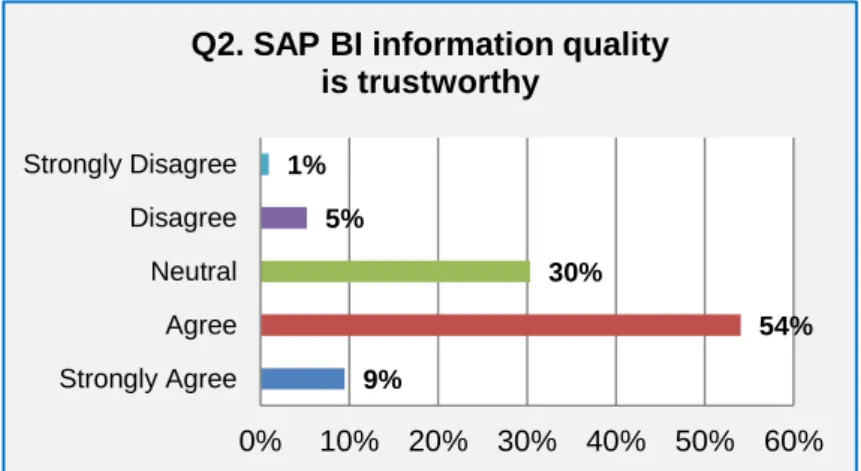
- Information quality
- Output quality
- Relevance
- System quality
- Complexity
- Accessibility
- Trialability
- User interface
- Organisational Factors
- Focus on the Customer
- Management Support
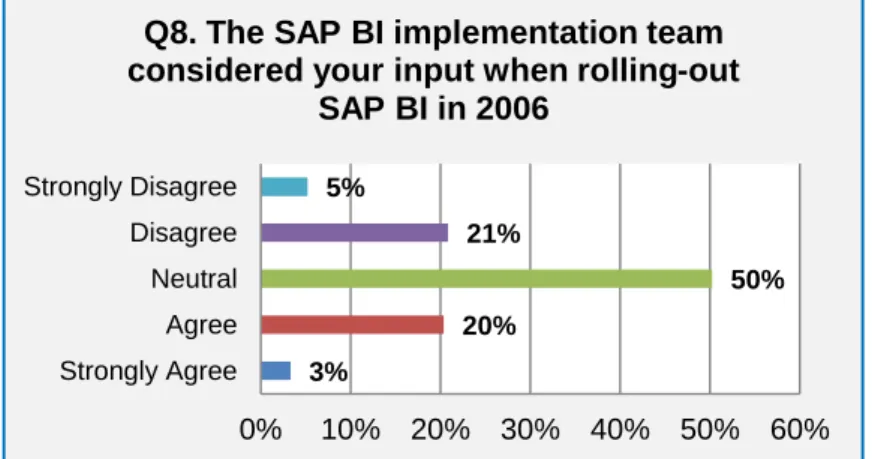
- User participation in implementation
- Iterative development approach
- User Training
- Organisational Culture
- Information Culture
- Information Integrity
- Change Management
- Resistance to Change
- Organisation resources / organisational size
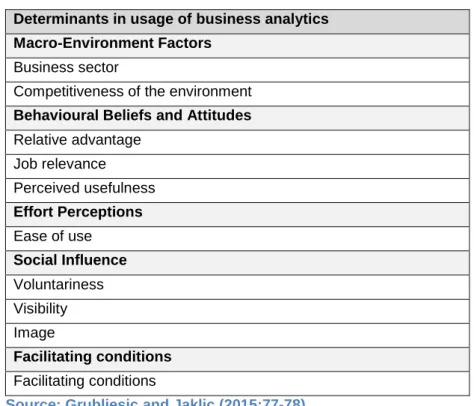
- Macro-Environment Factors
- Business Sector / Competitiveness of the Environment
- Behavioural Beliefs and Attitudes
- Relative advantage / Job Relevance
- Effort Perceptions
- Social Influence
- Voluntariness
- Visibility / Image
- Facilitating Conditions
The extent to which people seek information and the availability of reports are incentives for the use of analytics (Grubljesic & Jaklic, 2015:79). Accessibility is the access and prerequisites that managers require to operate and use the organization's analytical tools. CIOs must insist on focusing the organization's resources on this goal of using analytics to create, ultimately, a more advanced organization.
Business involvement in the implementation of any IT functionality or software is essential for the new toolset to be adopted and taken out of the business. They must interact with actual customers, that is, the users of the reports and dashboards, to achieve successful implementations. Organizational culture is a set of important shared understandings (mostly unspoken) between members of the organization.
Employee understanding, participation, and support are needed, and some of the changes must be incremental, step-by-step, and consistent with the existing culture in order to maintain some form of stability (Swanepoel et al.
Summary
Leaders must set the tone from the top and actively manage their areas using analytics tools to create an environment where staff will follow. Easier conditions mean that the environment is conducive to business learning and adopting new skills. It is about education and technical support for end users in a business environment for the use of the mentioned system.
If support is available, it is easier and more beneficial for management to use the analytical tool (Grubljesic & Jaklic, 2015:79).
CHAPTER THREE: RESEARCH METHODOLOGY
- Introduction
- Research Philosophy
- Research Approach
- Strategy
- Research Population / Site
- Data Collection Methods
- Research Instrument
- Unit of Analysis
- Data Analysis
- Qualitative Analysis
- Quantitative Analysis
- Elimination of Bias
- Ethical Considerations
- Research Contribution
- Limitations
- Summary
This approach of using multiple sources of data collection increases the validity and reliability of the study. The mixed approaches of qualitative and quantitative techniques confirm and maintain the findings of the study. Interviews and an electronic questionnaire were used to collect information from the level 4 managers in the organization.
The electronic survey questions were directly informed by the underlying theoretical framework and are representative of the themes in Table 3-2. The interview questions were directly informed by the underlying theoretical framework and are representative of the themes in Table 3-2. The importance of the research was introduced in the email itself to the respondents.
Before starting the data collection process, the participants were informed about the purpose of the research and asked for their consent.
CHAPTER FOUR: STATISTICAL DATA PRESENTATION
Introduction
Descriptive Analysis
- Individual Characteristics
- Business Intelligence Systems Quality
- System quality characteristics
- Access to SAP BI
- User Interface
- Execution response times of reports
- Organisational Factors
- Focus on the customer
- Management support
- User participation in the implementation
- Iterative development approach
- Business requirements
- User training
- Organisational Culture
- Change Management
- Macro-Environment Factors
- Business sector / competitiveness of the environment
- Behavioural Beliefs and Attitudes
- Relative advantage
- Job relevance
- Effort Perception
- Ease of use
- Social Influence
- Visibility
- Image
- Facilitating Conditions
- Other
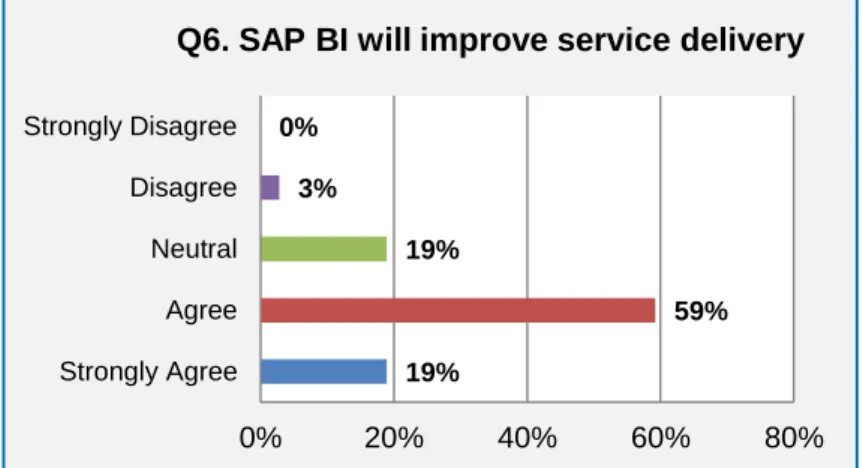
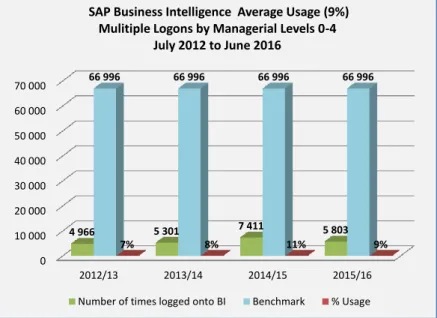
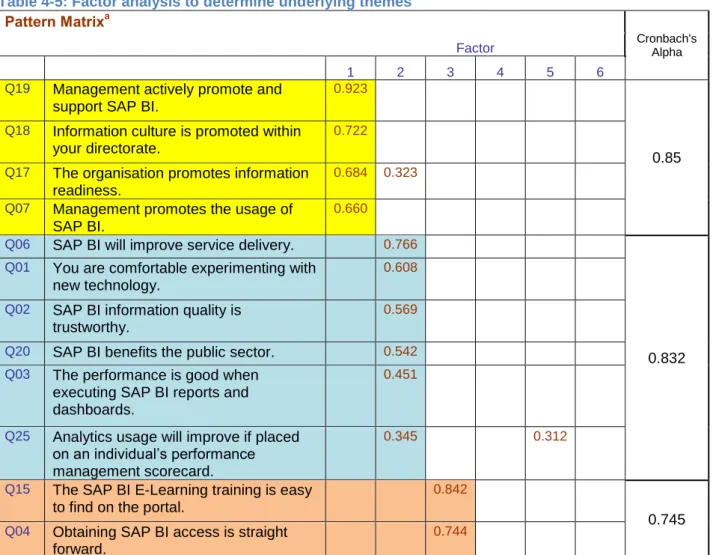
The Information Technology (IT) department purchased SAP Business Intelligence Accelerator (SAP BI-A) in 2011 to address poor performance of the SAP BI reports. This contradicts the low use (average of 7%) of the SAP BI tool, if it could increase service delivery. According to responses to question 15, 57% of managers confirmed that the SAP BI E-Learning training is easy to find on the portal (see Figure 4-17).
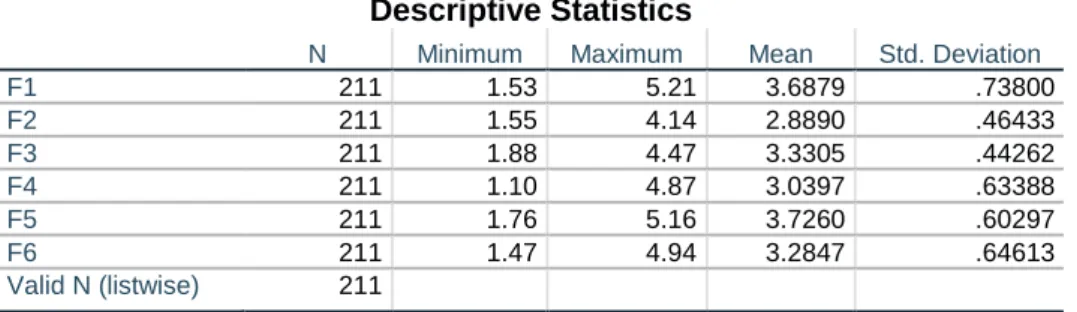
Factor analysis
- Cronbach’s alpha
Q23 You need to use SAP BI reporting to document daily business reporting activities. Job relevance Q09 You have requested to develop a SAP BI (report or . dashboard) for your specific business needs. Q09 You have requested to develop a SAP BI (report or dashboard) for your specific business needs.
Summary
CHAPTER FIVE: THEMATIC ANALYSIS OF QUALITATIVE DATA
Introduction
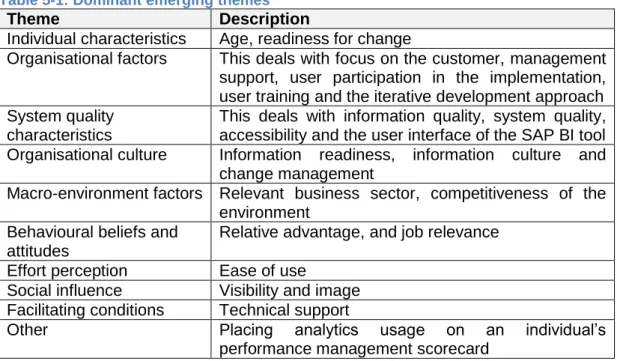
Thematic Analysis of the Interview Documents
This addresses information quality, system quality, accessibility and user interface of the SAP BI tool Organizational culture Information readiness, information culture and. Do you think usage would improve if SAP BI were on an individual's IPM scorecard? They don't use the tools often, so they find the user interface difficult and cumbersome to use.
The managers indicated that the SAP BI training should be adapted to their specific environment. This raises doubts about the reliability of the data and leads managers to use SAP R/3 as their main source of information instead. Some managers found the performance of the reports to be a problem, so managers did not use SAP BI.
Some strongly believed that this would force the use of the tool, while others felt that it would be counterproductive, as managers would merely log into the tool to "appear" to be using SAP BI.
Summary
They therefore turn to help from their staff as the latter can extract the required information much faster than they can. Reporting from R/3 is often slow due to the volume of data and results in managers not being able to make timely decisions or react quickly to changing circumstances.
CHAPTER SIX: FINDINGS, RECOMMENDATIONS AND CONCLUSION
Introduction
Findings
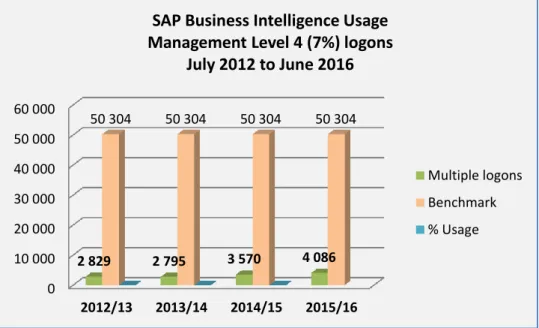
As a result, the statistics for management use of SAP BI are skewed and an average of 7% of level 4 managers use the SAP BI tool. This study showed that SAP BI usage among level 4 managers is low and provides reasons for the low usage. The key problem areas identified are data quality, user training and the SAP BI user interface.
Recommendations
System quality attributes are about information quality, system quality, accessibility and the user interface of the SAP BI tool. First, it is recommended to implement SAP BI batch monitoring to ensure information and system quality. If companies want to use analytics as a version of the truth, data integrity is critical to building user confidence in SAP BI.
The final recommendation is to address the user interface by empowering managers to use the tool by offering refresher SAP BI training that meets specific needs and requirements. This ensures that the right information is available at the right time to managers and will create a foundation for information readiness and adoption of the SAP BI tool. The establishment of a process owner for SAP BI is essential as previously mentioned in organizational factors and organizational culture.
SAP BI usage can be monitored by the number of SAP BI registrations in a month.
Conclusion
The main objective is to find out what the reasons are for the use of SAP BI among level 4 managers. The main objectives are to find out what are the reasons for the use and adoption of SAP BI among level 4 managers. Because I am a systems type of person, I rely on other sources beyond SAP BI, but for others who don't have it and need to use SAP BI.
At the end of the month I cannot get the actual figures for a period in R/3 - period related reporting I need SAP BI. I deal with CFOs and they don't see the need to learn it because I always give them the information - I should refer them to SAP BI more. So to answer your question, being on IPM or a directive from the City Manager is that we only use SAP BI.
It is a difficult approach, but it is the only way to change the mindset of managers. Third, if you are an ED you are supposed to be using SAP BI - you are not. Perhaps you could add this right to the front of the page giving an overview of what you need to do to get SAP BI access while providing the user with clear instructions and guidance on what to do.