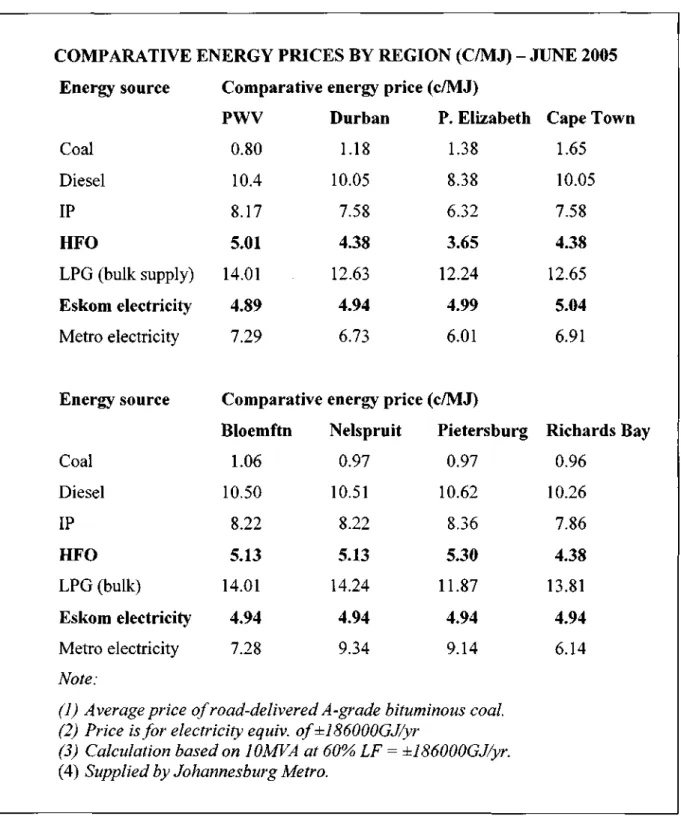
Consideration of the price structures of energy sources available to the industrial sector, namely coal, diesel, illuminating paraffin (IP), heavy fuel oil (HFO), liquefied petroleum gas (LPG) and electricity. Energy sources available to the industrial sector, namely coal, coal gas, diesel, lighting paraffin, heavy fuel oil, liquefied petroleum gas and electricity, will be compared in eight geographical areas.
MARKET STRUCTURE AND PRICING
Interest Groups
In addition, they argue that we expect the weight of regulators to be positively correlated with the efficiency of the different consumer classes. Becker finds that relative taxes will depend on the political effectiveness of the interest group, as well as the deadweight loss of taxation associated with each interest group.
Alternative Sources
For example, because industrial consumers are more concentrated, we would expect industrial consumers to have a higher weight than residential consumers, who are more dispersed. Therefore, we expect that organizations with more elastic demand will experience lower regulated prices, because the loss of costs due to price increases is proportional to electricity demand.
ENERGY VERSUS ECONOMIC ANALYSIS
Energy Analysis and Policymaking
Chapman et al. 1974) cited three reasons why net energy analysis of energy technologies is desirable. Changes in any of these factors will undoubtedly change the energy costs of goods and thus change the results of the net energy analysis.
Energy Aggregation and Energy Quality
The quality of electricity has received considerable attention in terms of its effect on the productivity of labor, capital and on the amount of energy required to produce a unit of GDP (Schurr & Netschert 1960; Jorgenson 1986; Devine 1986 ; Rosenberg 1998). The concept of energy quality must be distinguished from the concept of resource quality (Hall et al. 1986).
Economic Approaches to Energy Quality
In theory, the market price of a fuel reflects the myriad factors that determine the economic utility of a fuel from the perspective of the end user. Kaufmann 1994) investigates this question in an empirical analysis of the relationship between relative marginal product and price in US energy markets.
DESIGN OF ENERGY SYSTEM
- Classical Energy Systems Engineering
- Works Advocating Energy Efficiency
- Examples of Public Policy Works Considering Energy Efficiency
- Changing the Energy System
- Swedish Studies of Energy Utilities
- Energy Systems engineering called into Question
They suggest that by improving energy efficiency it is possible to provide useful energy for a future. However, recommendations on the design of the energy system must also consider control of the system.
BOTTOM UP VERSUS TOP DOWN
He concludes that "energy saving programs focus more on the market outcome than on the market process". The top-down models "focus on financial flows across the entire economy" (while sectional models) "focus on market dynamics".
INTERNATIONAL TECHNOLOGY TRANSFER
- Technological Perspectives
- Multilateral Agencies with Development Goals
- Market/Transactions Perspectives
- Market Barriers
But many in the field of technology transfer share the view of technology as knowledge (Krantzberg 1986). The World Bank's policy on energy efficiency places technology transfer in the context of encouraging proper economic incentives.
DEMAND SIDE MANAGEMENT ON A COMPETITVE MARKET
The International Experience of DSM
For more than a decade, US regulatory commissions (called Public Utilities Commissions) have directed utilities to implement DSM plans. Since 1992, US regulatory commissions have monitored the peak load reduction and energy savings resulting from DSM programs initiated by major energy companies.
CONCLUSION
Some fuel prices are regulated by the government and others are not, some fuel prices are based on an area pricing structure, some have a "base" wholesale price and delivery costs are calculated for the area price difference, and fuel prices other fuels are very much at the supplier's discretion. The degree of price negotiability of different fuels varies and is also very specific to suppliers and customers (Stigler 1971).
METHODOLOGY
The price structures of energy sources available to the industrial sector namely coal, oil, illuminating paraffin (IP), heavy oil (HFO), liquefied petroleum gas (LPG) and electricity are analyzed in this chapter. The main price variation in energy costs in South Africa is between coastal and inland prices, mainly due to transport or delivery costs.
COAL
Comparative Prices (excluding transport charges)
Transport Charges and Prices of Delivered Coal
Coal Price
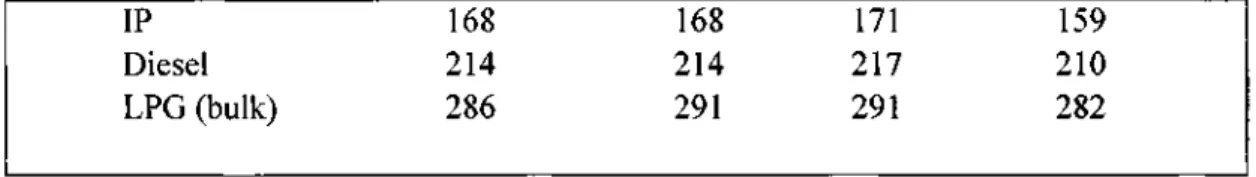
DIESEL
Price Basis
The zone price structure is an extension of the IBLC principle of linking local prices to international prices and includes the costs of transporting fuels from the coastal oil refineries. To facilitate the regulation and management of prices, the price zones are based on the magisterial districts of South Africa.
Diesel Price
For this reason, Sasol tends to market the product in an optimized distribution area, which lies more inland than towards the coast.
Price Negotiability
ILLUMINATING PARAFFIN
Price Basis
The IP price is unregulated although the Department of Minerals and Energy publishes a recommended wholesale price or reference price on a monthly basis. Retailers often add a significant margin to the wholesale price for low-volume customers.
IP Price
HEAVY FUEL OIL
HFO Price
Price Negotiability
LIQUEFIED PETROLEUM GAS (LPG)
Price Basis
The distribution of LPG to virtually all the populated areas of South Africa is a very capital intensive industry. Since the distribution costs are a significant part of the final costs, LPG prices increase significantly in relation to the distance between the refineries and the customer.
LPG Price
Cylinder and plant investment Bulk and cylinder filling operations Plant and cylinder maintenance and repair Marketing, office and management costs Skilled training requirements.
Price Negotiability
As a general rule, major distributors are unlikely to provide discounts higher than 15-20% to high-volume wholesale customers (end users and resellers) due to the distributor's margin constraints as a result of a variety of costs incurred in the distribution chain.
ELECTRICITY
ESKOM TARIFFS
Johannesburg: Industrial Tariffs
A limited demand rebate of R12.34/kVA is applied to the difference between the notified maximum demand (NMD) and the actual maximum demand. Maximum demand charge (not measured during off-peak) for winter (April - September): R22,77/kVA.month, and for summer (October - March): R20,53/kVA.month.
Cape Town: Industrial Tariffs
This is the highest tariff for the supply of electricity at low voltage (LV) or high voltage (HV) at llkV or 33kV. The following charges apply: Maximum demand charge: R44.89/kVA.month measured in 30 minute integration periods or R12.55/ampere.month measured at 3 ampere meters per consumer.
Pietersburg (Polokwane): Industrial Tariffs
CONCLUSION
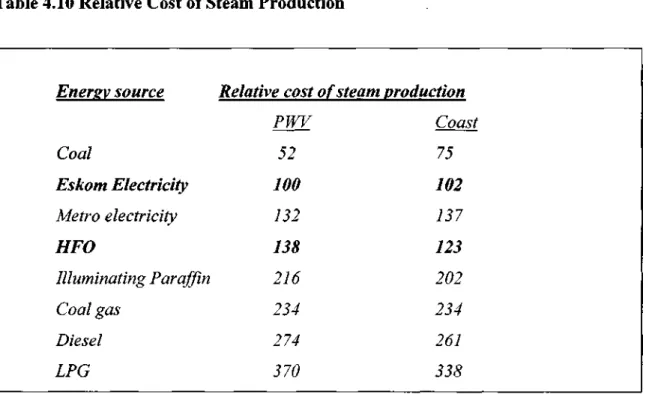
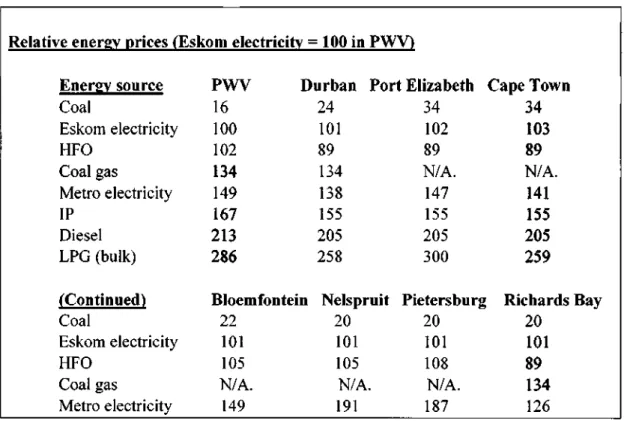
The level of price negotiation of different fuels varies and is very specific to the supplier and the buyer (Peltzman 1976). Below is a summary of the results for the various areas expressed in relative terms where Eskom electricity in PWV is equal to 100 price units per MJ (Cleveland et al. 1984).
METHODOLOGY
This study was undertaken to compare the latest available energy prices in South Africa and to determine energy costs in relation to the use of different energy sources. The issue of energy utilization efficiency and the idea of determining energy costs per production unit as the fairest basis for comparing energy sources are examined.
ENERGY COST ANALYSIS FOR STEAM GENERATION
INDUSTRIAL BOILERS
Coal-Fired Boilers
Higher turn-down ratio, resulting in less fuel wastage (especially in the case of gas-fired boilers). These boilers are used to produce steam and hot water from 30 kg/hour to 6400 kg/hour or more at a pressure of up to 10 bar.
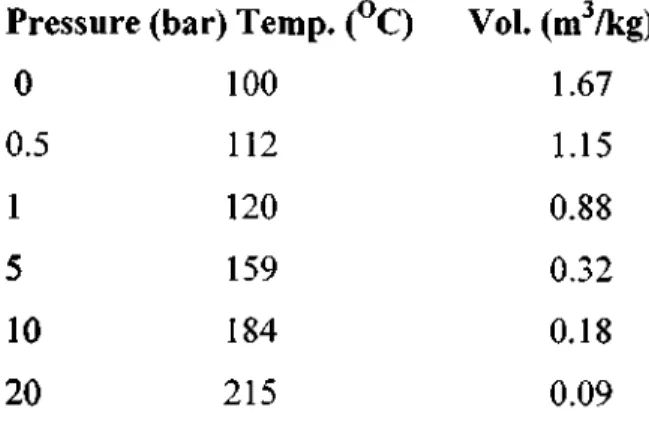
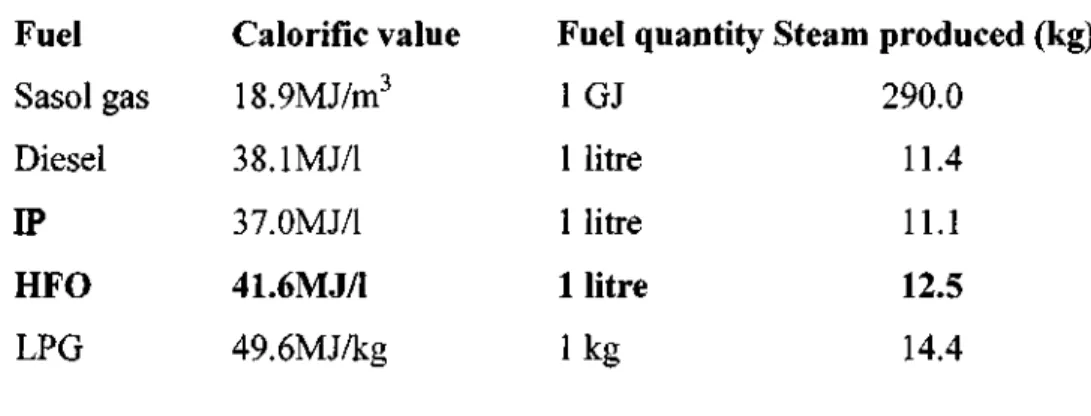
ENERGY REQUIREMENTS FOR STEAM GENERATION
The amount of steam generated by 1 kg of fuel using a boiler of efficiency r|e is found by multiplying the gross calorific value of the fuel by r\e and dividing it by the enthalpy of the steam at the given pressure.
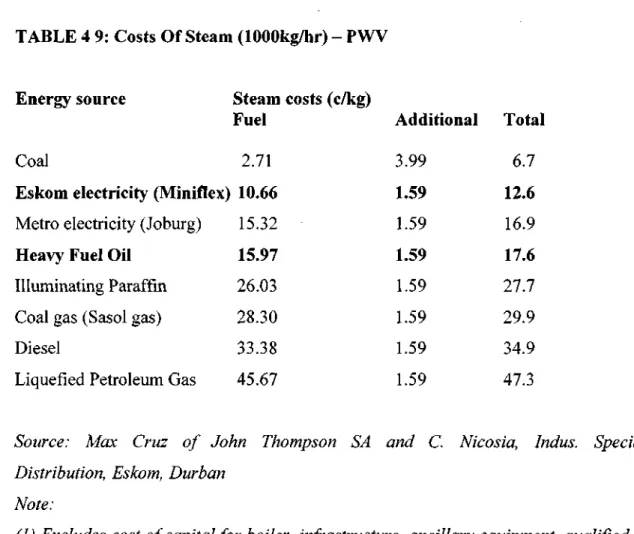
COMPARISON OF STEAM COSTS FOR DIFFERENT BOILERS
Coal-Fired Boiler Fuel cost
The efficiency of a coal-fired boiler operating at 10 bar is around 80% (gross) when new or very well maintained, and provided good quality coal with a calorific value of 26 - 28MJ/kg) is used. Based on several case studies for 1 OOOkg/hour steam production, this cost appears to be around R230/tonne of coal consumed, or around R2127.59/month.
Gas and liquid Fuel-Fired Boilers Fuel cost
The cost of a large HV electrode boiler for steam production in the order of 50 tons/hour is likely to be well above the Rim. Comparative estimates of the total monthly costs of operating an electrode boiler producing 1000 kg/hour of steam continuously, excluding management/qualified personnel, fixed costs and miscellaneous minor expenses are shown in Table 4.8.
PRICE OF CONTRACT STEAM
ELECTRODE BOILER POTENTIAL
This increases the effective cost of the electricity and the cost of the steam due to the low electrical load factor.
CONCLUSION
Demand Side Management programs are being implemented and promoted around the world with the aim of reducing peak demand and promoting energy efficiency. This will ensure the effective implementation of Demand Side Management initiatives and provide the necessary structure to a currently (often) failed strategy.
METHODOLOGY
CURRENT IMPLEMENTATION
The success of implementing and promoting Demand Side Management process is mostly the result of casual participation rather than deliberate enforcement.
PROCESS
OBJECTIVE AND CHALLENGES .1 Objective
Challenges
Since many energy users do not know about the implementation process and the benefits of a demand-side program, we may find that they are reluctant to undertake this process, so regulation is recommended. Many business people are so busy running their businesses that spending time discussing Demand Side Management is often considered the same as discussing a new insurance package with a broker, an unproductive waste of time.
CLASSIFICATION
In addition to the challenge of convincing energy users to subscribe to a demand-side initiative, the growth of the commercial and industrial sectors, as seen in the number of factories and office buildings being constructed annually, makes monitoring and controlling the effective implementation of energy suppliers' demand-side targets almost impossible. The time has come to structure the process and ensure that participation is no longer voluntary but mandatory.
PROACTIVE APPROACH .1 Target Market
- Pre-building Preparation
- Monitoring and Verification Equipment
- Post Building Data Collection
- Demand Side Management Program
- Bi-annual Audits
- Non Compliance
- Benefit
After the completion of the construction process, the ESCO will assist the energy user to ensure that the monitoring and verification equipment is properly put into operation so that the data necessary for the design and effective implementation of a site management program of the request. By strictly regulating the process from the moment the building is erected, the otherwise cumbersome and inefficient procedure to ensure the implementation of the demand side management program has been bypassed.
REACTIVE APPROACH .1 Energy Users without ESCO's
- Appointment of ESCO
- Data collection
- Demand side management program
- Bi-annual audits
- Non-compliance
- Energy users with ESCO's .1 Target market
- Bi-annual auditing
- Non-compliance
However, before submitting the demand side management plan, it is essential to gather certain data. Where energy users have already designated and implemented a Demand Side Management program, the problem of existing contracts that may exist between the ESCO and the energy user.
CONCLUSION
BACKGROUND
ENERGY PRICES
Elizabeth 1.38
DEMAND SIDE MANAGEMENT
DSM means: the implementation of planning and monitoring of end-user activities intended to encourage consumers to change patterns of electricity consumption, including the timing and level of electricity demand. DSM's main goal is to demonstrate consistent, efficient use of electricity, resulting in smaller amounts of electricity during peak times, effectively managing demand.
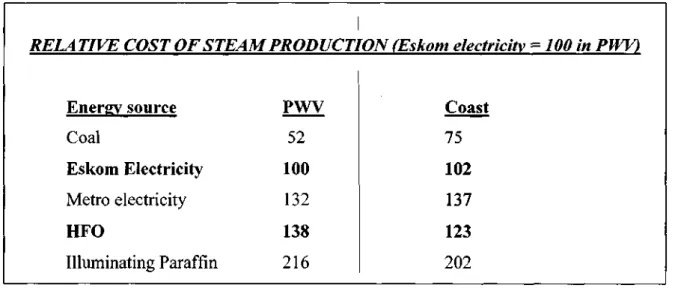
STEAM COST COMPARISON
A typical industrial application of steam generation (Tissot 1979) was chosen to evaluate different energy sources on an effective cost basis, taking into account energy price and indirect costs and efficiency of use. In assessing the total cost of using different energy sources as opposed to comparing costs based on simple energy equity, an analysis of energy costs and fixed and variable costs, efficiency of use and equipment related to the use of these energy sources for steam generation was carried out. to implement.
CONCLUSION
The most important issue from the point of view of the industrial consumer is the relative cost associated with the use of one energy source compared to another, per unit of output (Owen 1970). The second cheapest energy source is Eskom electricity, which costs about the same as HFO and is on average 4 times the price of coal.
OPTION 1
- Justification of option 1
OPTION 2
- Justification of options 2
Comparative prices for HFO onshore and in the PWV area for bulk deliveries are given in Table 6.4 below.
OPTION 3
- Justification of options 3
In addition, the customer will realize immediate and future savings by reducing the demand for electricity by being energy efficient. The customer will achieve further savings by keeping power generation and transmission costs down through more economical load management.
OPTION RECOMMENDED
SYMTEMATIC APPROACH FOR AN ELECTRIC BOILER INSTALLATION .1 Electrode Boilers
- Action 1
- Action 2
- Action 3
- Action 4
- Action 5
- Action 6
- Action 7
The author and pricing managers will compile rate comparisons to identify the most cost-effective rate applicable to Inca Lime and ensure that the necessary documentation is completed. The author will work closely with suppliers and Eskom to ensure that the project meets the target dates and is correctly authorised.
REACTION VISIT ACTION PLAN
THE STRATEGIC PROCESS FOR THE INSTALLATION IS AS FOLLOWS
Swedish Government, Bill for the Swedish Parliament, Energihushallning m.m. Swedish Government, Bill for the Swedish Parliament, Energisparplan for existing bebyggelse. Exploring the gap: Top-down versus bottom-up analyzes of the cost of global warming mitigation.
Indirect Labour Cost
Working Capital Costs
Cost of Capital Replacement
Other Costs to be considered: (Might have some figures) 1 Environmental Impact
This would be done in comparison to the existing coal boiler used by Inca Lime. The cost is estimated at approximately R188.00 per ton of steam during the high demand period and approximately R149.33 per ton of steam during the low demand period.