The total gross value of agricultural production (total production in the production season valued at the average base prices received by producers) for 2015/16 is estimated at R247 098 million. compared with R226 531m. the year before - an increase of 9.1%. This increase is primarily attributable to an increase in the value of horticultural products. The gross value of animal products, horticultural products and field crops contributed 24.3% respectively to the total gross value of agricultural production.
Intermediate expenditure refers to the value of goods and services purchased during the production process for consumption as inputs. Value added is the value of total production minus the value of intermediate consumption during the production period. In 2015/16, the Netherlands, with exports worth R8 615 million, the UK (R7 714 million), Mozambique (R6 021 million), Zimbabwe (R5 116 million) and China (R3 946 million) were the South's five largest trading partners Africa in terms of export destinations for agricultural products.
About 19.7% of the total value of agricultural exports from South Africa for the period July 2015 to June 2016 went to the Netherlands and the UK combined. About 18.1% of the total value of agricultural imports from South Africa in the period July 2015 to June 2016 was from Argentina and the UK combined.
FIELD CROP HUSBANDRY
The main reason for the decline in corn production is severe drought conditions in the major corn-producing areas. Production levels in the Southern African Development Community region (South Africa is usually the main source of white maize for these countries in times of shortage). Due to the irregular weather conditions in the country, there are significant variations in local production.
This is 736,390 tonnes above the amount imported in the previous year and a significant increase compared to the average. Sorghum, like other grains, has two basic markets that it serves, namely the human component and the animal feed component. For the 2016 production season, weather conditions in South Africa's wheat growing areas have been quite favorable. In particular, the Western Cape, which is the largest wheat growing area in RSA, received rainfall which is favorable for the wheat crop.
Currently, five varieties are recommended for malting barley production in the Southern Cape, viz. The global production in the 2016/17 marketing season is mainly driven by the larger harvests in the European Union (60.3 million tons) and Russia (18.5 million tons). Sunflower seed can be planted from the beginning of November to the end of December in the eastern parts of the production areas and until mid-January in the western part.
This is probably the main reason for the popularity of the crop in the marginal production areas of South Africa. The increase in 2016 plantings can be largely attributed to lower plantings of other summer crops such as yellow corn, soybeans, peanuts and dry beans. The decrease in plantings can be mainly attributed to the increase in plantings of other summer crops, especially sunflower seeds.
Since domestic production of soybean meal was limited in the past, almost all domestic consumption had to be imported. The slight decline in world production can be attributed mainly to smaller crops in India, Argentina and China. About 99% of the canola crop in South Africa is produced in the Western Cape province, particularly the Southern Cape.
In such crop rotation systems, oilseed rape usually results in an increase in the yield of subsequent crops. The Dry Bean Producers' Organization is a national trade organization that advocates for the interests of dry bean producers in the country.
HORTICULTURE
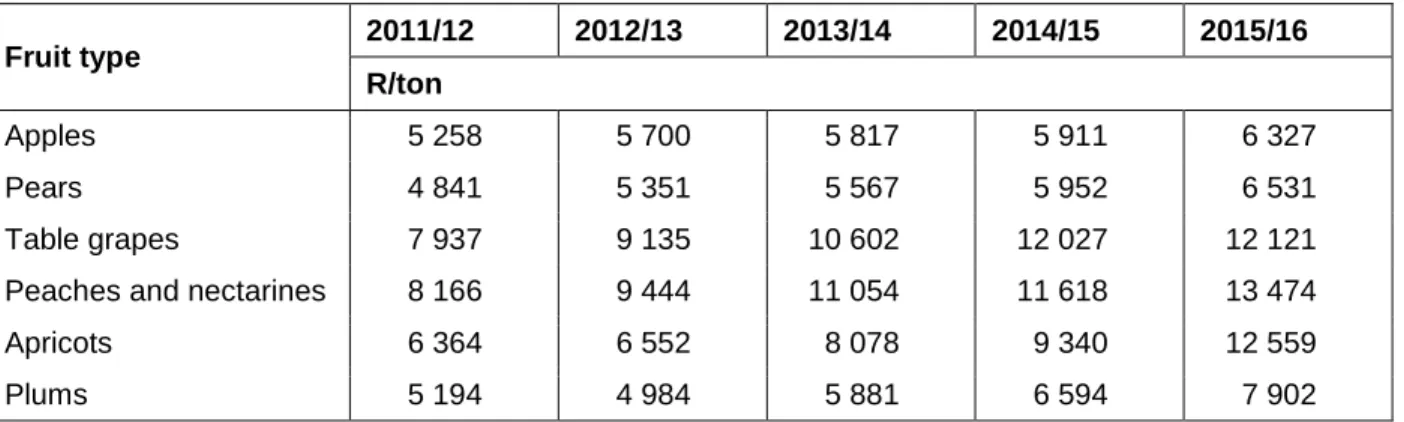
The increase in newly established orchards and the replacement of old orchards has led to growth in total production. Dried fruit is produced mainly in the western and southern parts of the Western Cape Province and the Lower and Upper Orange River areas of the Northern Cape Province. Apricots are grown mainly in the Little Karoo and prunes are produced almost exclusively in the Tulbagh district of the Western Cape.
According to the Dried Fruit Technical Services (DFTS), this drop was due to unusual rainfall during the dry season, especially in the Orange River region. South Africa is the eighth largest producer of wine in the world, contributing 4.1% of global wine production in 2015. Wine is mainly produced in the Western Cape Province and along parts of the Orange River in the Northern Cape Province. .
The best areas for the production of these fruits in South Africa are the provinces of Limpopo, Mpumalanga and KwaZulu-Natal. In 2015/16 (July to June), pineapple accounted for 56.4% of the total intake of subtropical fruits for processing. Citrus fruits are grown in the provinces of Limpopo, Eastern Cape, Mpumalanga, Western Cape and KwaZulu-Natal in areas where subtropical conditions (warm to hot summers and mild winters) prevail.
As shown in the chart below, approximately 47% of the volume of vegetables produced is traded in major fresh produce markets. The importance of vegetables in a healthy diet is being strongly promoted by all stakeholders in the fresh produce marketing chain. Sales in fresh produce markets accounted for about 47.9% and direct sales for about 25.9% of the total tomato sales volume.
Approximately 72% of the total production in the 2015/16 season was sold on major fresh produce markets, and 17% was exported. This was mainly due to the increase in the supply of onions in the markets. About 1% of the total onion production was accepted for processing in the 2015/16 season.
During the 2015/16 season, the volume of onions exported represented approximately 13.2% of the total onion harvest. The main regions are located in the Free State, Western Cape, Limpopo and Mpumalanga provinces.
ANIMAL PRODUCTION
The Milk Producers' Organization (MPO) is the leading producer organization in the South African dairy sector. Although sheep farms exist in all provinces, they are concentrated in the more arid parts of the country. In the Western Cape, the inland Karoo and Overberg produce wool and mutton as well as the Merino breeding stock breed.
Goats are mainly found in the Eastern Cape, Limpopo, KwaZulu-Natal and North West provinces. The total number of employees in the formal pig production industry in South Africa is estimated to be approximately 10 000, including approximately 4 000 farm workers and 6 000 workers in the processing and slaughterhouse sectors. The red meat industry is one of the most important growing industries in South Africa's agricultural sector.
In the case of mutton, for example, the level of wool prices also affects the domestic supply of mutton. The average weighted basic gross price (before rebates, advertising and distribution costs are deducted) received by broiler producers fell by 2.9%, from R21.64/kg in 2015 to R21.01/kg in the first nine months of 2016 According to the Milk Producers Organization (MPO), the estimated number of commercial milk producers in the country decreased by 8.2% from 1,834 in January 2015 to 1,683 in January 2016.
However, in terms of the value of agricultural production, it is currently the seventh largest agricultural industry in the country. The local commercial production figures of milk from 2012 to 2016 are shown in the following graph. Milk production is expected to increase in the remaining three months of 2016 (October to December) due to favorable weather conditions.
Wool is produced throughout South Africa; however, the main production areas are in the drier regions of the country. Alternative sales mechanisms, such as contract growth, forward deliveries and futures contracts, have not been established in the South African wool industry. Mohair production in South Africa mainly takes place in the Eastern Cape province as well as the adjacent part of the Western Cape province.

