The Influence of Surfactants on the Solubility of Acenaphthene and Phenanthrene and their Extraction from Spiked Soils
by
Sudika Ragoonandan B.Sc. (Hons 2001) UNP
Submitted in partial fulfilment of the requirements for the degree of Master of Science in the Faculty of Science and Agriculture, University of KwaZulu-Natal, Pietermaritzburg, 2005
DECLARATION
I hereby certify that this dissertation is my own work, except when specifically acknowledged in the text. Neither the present dissertation, nor any part thereof has been submitted to any other University for a degree.
Author: ^Af>in*#«eU«
S. Ragoonandan
I hereby certify that this statement is correct.
Supervisor:
Prof. D. Jaganyi
Co-Supervisor:
Dr. F. Khan
ACKNOWLEDGEMENTS
The author wishes to express her gratitude to the following persons for their assistance in her research:
Prof. D. Jaganyi, especially for arranging the manufacture of the specialised laboratory equipment and for his supervision during the thesis compilation
Dr. F. Khan, for proofreading the initial drafts and her recommendations
Mr. V. Dorasamy, for the analyses of the soil samples and his assistance regarding the soil science aspect of the thesis
Mr. E. Abib and the other users of the Postgraduate Soil Science Laboratory, for their assistance in the usage of the centrifuge and centrifuge tubes and for the usage of bench space
Mr M. Somaru and all the technical staff and Mr D. Reddy and all other postgraduates at the Chemistry department for their assistance
Sasol for the funding of this research and Mr Martin Ginster and team at Sasol for their assistance and advice during the research
My parents for supporting me throughout this work, I would have not made it without you
Sadhna, for being a friend when I really needed one
Finally to God Almighty for seeing me through it all, Hare Krishna!
TABLE OF CONTENTS
Chapter One: Introduction Page 1.1. Polyaromatic Hydrocarbons 1
1.1.1. Introduction 1 1.1.2. Physical Properties of Acenaphthene and Phenanthrene 1
1.2. Soils 4 1.2.1. Introduction 4
1.2.2. Composition, Structure and Composition of Soil Solids 5
1.2.3. Inorganic Soil Matter 6 1.2.4. Soil Organic Matter (SOM) 8 1.2.5. Factors Affecting Contaminant Sorption and Desorption 8
1.3. Surfactants 12 1.3.1. Introduction 12 1.3.2. Surfactant Behaviour in Water 13
1.3.3. Properties of Surfactants and their Applications 15
1.3.4. Surfactant Classification 16 1.3.5. Surfactant Parameters 17 1.3.6. Surfactants in Soil and Aquifer Remediation 18
1.3.7. Micellar Solubilisation of Organic Compounds by Non-ionic Surfactantsl9
1.3.8. Factors Affecting the Micellar Solubilisation of PAHs 19
1.3.9. Adsorption of Surfactants onto Surfaces 20 1.3.10. Surfactants and The Environment 21
1.4. Soil Washing 23 1.4.1. Introduction 23 1.4.2. The Soil Washing Process 23
1.4.3. Factors Affecting Soil Washing 29
1.4.4. Soil Washing Studies 30
1.5. Bioremediation 32 1.5.1. Introduction 32 1.5.2. Factors Affecting Microbial Processes 32
1.5.3. Methods of Bioremediation 34 1.6. Aims and Objectives of Study 35
1.7. References for Chapter One 36
Chapter Two: Experimental Methods and Analysis
2.1. Experimental Procedures 48 2.1.1. Solubility Studies in Aqueous Media 48
2.2. Desorption Studies 52 2.2.1. Determination of Soil Moisture Content 52
2.2.2. Determination of Soil Clay, Silt and Sand Content 52
2.2.3. Quantification of Organic Matter 54 2.2.4. Identification of Organic Compounds in API Sludge 55
2.2.5. Soil Washing 57 2.3. Analysis of Polyaromatic Hydrocarbon Compounds from Solubility 58
Studies
2.3.1. Introduction 58 2.3.2. The Principles of UV-Vis Spectophotometry 58
2.3.3. Calibration Curves for Phenanthrene and Acenaphthene 60
2.4. Analysis of PAH Compounds from Soil Washing 64
2.4.1. Introduction 64 2.4.2. The Principles of the HPLC 65
2.4.3. Experimental Conditions for HPLC in the Current Work 66
2.4.4 Calibration Curves for the PAH Compounds 69 2.5. Analysis of PAH Compounds from Sludge Washing 72
2.5.1. Introduction 72 2.5.2. The Principle of the GC-MS 74
2.5.3. Summary of Experimental Conditions for GC-MS in the Current Work 75 2.6. References for Chapter Two
Chapter Three: Theory
3.1. Partitioning of PAHs Between Micellar and Aqueous Pseudophase 79
3.2. Theory of Soil Washing 81 3.3. References for Chapter Three
Chapter Four: Results, Discussion, Conclusions and Recommendations
4.1. Solubility Studies of Phenanthrene and Acenaphthene in Aqueous Media 84 4.1.1. Calculation of Molar Solubilisation Ratios and Partition Coefficients 87
4.1.2. Effect of pH on Phenanthrene Solubility 92 4.1.3. Comparing the Solubility of Phenanthrene in Water and Safol Surfactant 95
4.2. Analyte Desorption Studies 97 4.2.1. Determination of Moisture Content 97
4.2.2. Determination of Clay, Silt and Sand Content 97
4.2.3. Quantification of Organic Matter 98 4.2.4. Determination of Organic Compounds and Quantification of
Phenanthrene in the Sludge 99 4.2.5. Soil and Sludge Washing 100
4.3. Conclusions 109 4.4. Recommendations 110 4.5. References for Chapter Four 112
LIST OF FIGURES l.l.a
l.l.b 1.2.a 1.3.a 1.3.b 1.3.c 1.3.d 1.3.e 1.3.f 1.3.g 1.3.h 1.4.a 1.4.b 1.4.C 1.4.d 1.4.e
Figure
Molecular Structure of Acenaphthene Molecular Structure of Phenanthrene
Classification of Soil According to Texture and Particle Size Sodium Dodecylsulfate Surfactant Molecule
Sodium Dodecylsulfate Micelle
Hydrogen Bonding in Water Molecules Forces Acting on Water Molecules Micelle Formation in Water Admicelle
Hemimicelle
Solubilisation Sites in a Micelle Trommel
Cross-Section of a Grizzly
Schematic Diagram of a Hydrocyclone Belt Filter
Concentration of Polychlorinated Biphenyls in
Page 2 3 6 12 13 13 14 14 15 15 19 24 24 25 25 Different Soil Size Fractions
1.4.f 2.1.a 2.2.a 2.3.a 2.3.b 2.3.c 2.3.d 2.3.e 2.4.a 2.4.b 2.4.c 2.4.d 2.4.e 2.4.f
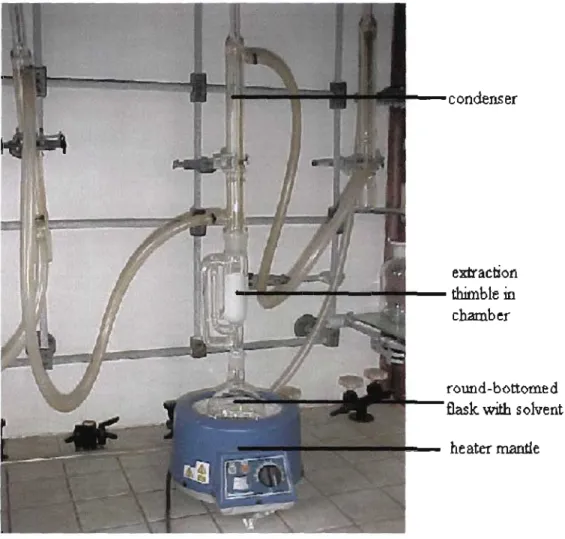
Schematic Diagram of a VRU Unit Experimental Setup for Solubility Studies Experimental Setup used for Soxhlet Extraction
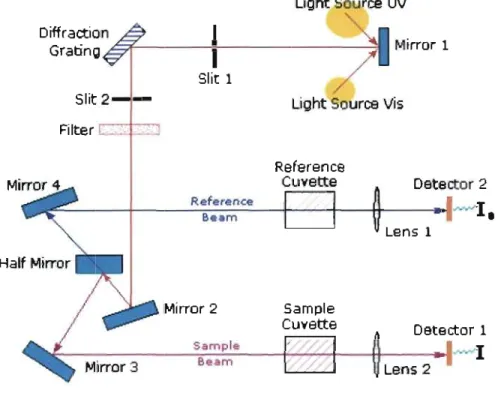
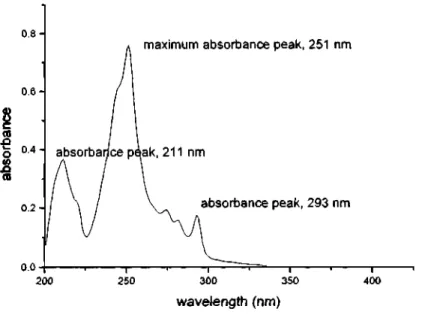
Schematic Diagram of a Double Beam UV-Vis Spectrophotometer The UV-Spectrum for Phenanthrene
The UV-Spectrum for Acenaphthene
Calibration Graph of Phenanthrene in a Water-Ethanol Solvent System Calibration Graph of Acenaphthene in a Water-Ethanol Solvent System Schematic Diagram of an HPLC Unit
HPLC Chromatogram of Phenanthrene HPLC Chromatogram of Acenaphthene
HPLC Chromatogram of Acenaphthene and Phenanthrene Calibration Graph for Phenanthrene
Calibration Graph for Acenaphthene
26 27 49 56 59 61 61 63 63 64 67 68 68 70 71
2.4.g HPLC Trace of Spiked Standard Soil Extracted with 1 mM 71 Surfactant Solution
2.5.a Schematic Diagram of a GC System 72 2.5.b: Schematic Diagram of an MS System 73 4.1 .a Phenanthrene Solubilisation Curve For Safol 45E3 85
4.1 .b Graph of Phenanthrene Concentration vs Surfactant Concentration for 85 Safol 45E3
4.2.a Phenanthrene Solubilisation Curve For Safol 45E5 85 4.2.b Graph of Phenanthrene Concentration vs Surfactant Concentration for 85
Safol 45E5
4.3.a Phenanthrene Solubilisation Curve For Safol 45E7 86 4.3.b Graph of Phenanthrene Concentration vs Surfactant Concentration for 86
Safol 45E7
4.4.a Phenanthrene Solubilisation Curve For Safol 45E9 86 4.4.b Graph of Phenanthrene Concentration vs Surfactant Concentration 86
for Safol45E9
4.5.a Phenanthrene Solubilisation Curve For Safol 45E12 87 4.5.b Graph of Phenanthrene Concentration vs Surfactant Concentration for 87
Safol 45 E12
4.6 Solubility of Acenapthene in Safol 45E7 and Safol 45E12 91 4.7 Solubility of Phenanthrene in Safol 45 E7 and Safol 45 E12 at pH 5 93
4.8 Solubility of Phenanthrene in Safol 45 E7 and Safol 45 E12 at pH 6 93 4.9 Solubility of Phenanthrene in Safol 45 E7 and Safol 45 E12 at pH 7 94
4.10 Solubility of Phenanthrene in Water 95 4.11 Phenanthrene Aqueous Solubility as a Function of Temperature 96
4.12 GC-MS Analysis of Soxhlet Extracted Unwashed Dry Sludge 99
4.16 and 4.17 101 Phenanthrene and Acenaphthene Desorption Curves for Washed
Longlands Sand
4.18 and 4.19 101 Phenanthrene and Acenaphthene Desorption Curves for Seasand
4.20 and 4.21 102
Longlands Soil
4.22 and 4.23 102 Phenanthrene and Acenaphthene Desorption Curves for Standard Soil
4.24 and 4.25 104 Graph of Phenanthrene and Acenaphthene Concentration vs
Safol 45E7 Surfactant Concentration for Seasand
4.26 and 4.27 104 Graph of Phenanthrene and Acenaphthene Concentration vs Safol 45E7
Surfactant Concentration for Longlands Sand
4.28 and 4.29 105 Graph of Phenanthrene and Acenaphthene Concentration vs Safol 45E7
Surfactant Concentration for Standard Soil
4.30 and 4.31 105 Graph of Phenanthrene Concentration vs Safol 45 E7 Surfactant Concentration
for Unwashed Longlands Soil
LIST OF TABLES
Table Page 1.1.a Physical Properties of Acenaphthene 2
1.1 .b Physical Properties of Phenanthrene 3 1.2.a Classification of Soils by Particle Size 5
1.2.b List of Silicates 7 1.3.a Classification of Surfactants 16
1.4.a Effectiveness of Soil Washing in Relation to Particle Size Distribution 26
2.1 .a Concentrations of Surfactant Solution Prepared 50 2.3.a Calibration Concentrations used to Generate Calibration Graph and 62
the Corresponding Absorbance Values
2.4.a The HPLC component specifications and conditions used during 69 routine analysis
2.4.b Results of Analyte Calibration 70 2.5.a Instrument Operating Conditions 76 4.1 Molar Solubilisation Ratios of Phenanthrene in Safol 45E3 88
4.2 Molar Solubilisation Ratios of Phenanthrene in Safol 45E5 88 4.3 Molar Solubilisation Ratios of Phenanthrene in Safol 45E7 88 4.4 Molar Solubilisation Ratios of Phenanthrene in Safol 45E9 88 4.5 Molar Solubilisation Ratios of Phenanthrene in Safol 45E12 89 4.6 Molar Solubilisation Ratios of Phenanthrene in Various Surfactant 90
Solutions
4.7 Equilibrium Concentrations of Phenanthrene and Acenaphthene in 92 Safol 45E7 and Safol 45E12
4.8 pH of 1 raM solutions at 20.5 °C 92 4.9 Comparison of Equilibirum Phenanthrene Concentrations at pH 5, 6, 7 94
and 8
4.10 Comparison between Phenanthrene Solubilisation in Water and 96 Safol Surfactants
4.11 Moisture Content of Different Soil Samples in Weight Percent 97
4.12 Particle Size Fractions of Soil and Sludge Samples 98 4.13 Organic Matter Content of Soils and Sludge 99
4.14 Phenanthrene Area Percent as Determined from Screening of Sludge 100 4.15 Equilibrium Concentrations of Acenaphthene and Phenanthrene in 106
Sorbent Washing Studies
4.16 Soil Washing Performance Indicators 108 4.17 Equilibrium Concentrations of Phenanthrene and Acenaphthene in 109
Safol 45E7
LIST OF ABBREVIATIONS USED
API American Petroleum Institute CEC cation exchange capacity CMC critical micelle concentration DPE dual phase extraction
EO ethylene oxide
HLB hydrophile-lipophile balance HOC hydrophobic organic compound LTTD low- temperature thermal desorption MSR molar solubilisation ratio
NOM natural organic matter PAH polyaromatic hydrocarbon PCB polychlorinated biphenyl PCP pentachlorophenol POE polyoxyethylene SDS sodium dodecylsulfate
SEAR surfactant enhanced aquifer remediation SOM soil organic matter
SVE soil vapour extraction VOC volatile organic compound VRU volume reduction unit
ABSTRACT
In the first phase of the study, the effect of five Safol surfactants on the aqueous solubility of phenanthrene and acenaphthene was determined. The fixed variables were temperature and ionic strength, while surfactant concentration and pH were varied. Quantification of the polyaromatic hydrocarbons (PAHs) was conducted by UV-Visible spectrophotometry.
The surfactants had little or no effect on analyte solubilisation below the critical micelle concentration (CMC) while a linear relationship between surfactant concentration and amount of solubilised phenanthrene was observed above CMC concentrations. Safol 45E5 had the highest phenanthrene molar solubilisation ratio (0.83) of the five surfactants tested. The solubilisation of phenanthrene increased marginally (4.1 % for Safol 45E12 and 15.2 % for Safol 45E7) by decreasing the pH from 8 to 5. The concentration of solubilised acenaphthene was 8.4 % higher than phenanthrene in a 1 mM solution of Safol 45E7. The aqueous solubility of phenanthrene was enhanced 11.0, 21.2, 19.6, 15.9 and 14.7 times in 1 mM solutions of Safol 45E3, 45E5, 45E7, 45E9 and 45E12 respectively.
Seasand, Longlands sand, Longlands soil and a standard soil sample were spiked with the two PAHs and aged for two weeks. API sludge provided by Sasol and unspiked samples of the above mentioned sorbents were subjected to determinations of organic matter content, particle size distribution and moisture content. The spiked soils and sands and the sludge samples were then washed in various concentrations of Safol 45E7 (0.5, 1.0 and 2.0 mM) at the same temperature used in the solubility studies. A soil mass to solution volume of lg to 10 mL was used. Analyses of the soil and sand samples were conducted by High Pressure Liquid Chromatography (HPLC).
Using a 2 mM Safol 45E7 surfactant solution, 100 % and 90 % of phenanthrene and acenaphthene were respectively extracted from Longlands sand and 88 % and 100 % of phenanthrene and acenaphthene were removed from seasand. 8.4 % phenanthrene
and 8.17 % of acenaphthene was removed from Longlands soil, while 7.03 % phenanthrene and 6.64 % acenaphthene was removed from the standard soil sample.
In the sand desorption studies, the amount of desorbed contaminants initially increased rapidly with increasing surfactant concentration, before levelling off at equilibrium. The amount of desorbed acenaphthene and phenanthrene increased exponentially with increasing surfactant concentration while contaminant concentrations decreased with increasing time in the Longlands soil and standard soil desorption experiments.
Dry API sludge samples were also subjected to soil washing studies. The washed samples were Soxhlet extracted and analysed by gas chromatography. The 0.5 mM and 1 mM Safol 45E7 washed sludge samples showed respective phenanthrene peak area percent reductions representing a 44 % and 47 % extraction of phenanthrene from the API sludge.
CHAPTER ONE
INTRODUCTION
1.1. Polyaromatic Hydrocarbons (PAHs)
1.1.1 Introduction
The products of heating coal to high temperatures in the absence of air are coke, coal gas and coal tar. Coal tar consists mainly of hydrocarbons, including benzene and other aromatic hydrocarbons.1 Polyaromatic hydrocarbons (PAHs) are characterised by two or more fused benzene rings. In order for a compound to be classified as aromatic, it has to obey Huckel's Rule, which states that for any compound to be aromatic, it must have {An + 2) 7i electrons (where n is any whole number). 2 PAHs are planar molecules with delocalised electrons in the benzene ring.3
PAHs with three or more benzene rings are poorly soluble in water and have a high K0
(octanol-water) partitioi defined in Equation 1.1:
(octanol-water) partition coefficient.4 The octanol-water partition coefficient, ^ow, is
^„w=%H 5 2 L 0-1)
water
Where Coctanoi is a compound's solubility in octanol and Cwater is the compound's aqueous solubility. Compounds with low Kow values (< 10) are considered hydrophilic and those with high Kov/ values (> 104) are considered hydrophobic
The two analytes studied were acenaphthene and phenanthrene.
1.1.2. Physical Properties of Acenaphthene and Phenanthrene
Acenaphthene is found naturally in crude oil. It is also emitted from petroleum refineries, coal tar distillation, coal combustion and diesel-fuelled engines.5 Acenaphthene is used as a dyestuff intermediate; in insecticides and fungicides and in the manufacture of plastics.6 Acenaphthene is toxic to fish at minimum concentrations of 600 - 1700 ug L"1. It has been reported to be moderately toxic to humans via the intraperitoneal (area that contains the
abdominal organs) route.7 It also acts as an irritant to the eyes, skin and mucous membranes5 and is reported to be carcinogenic.6
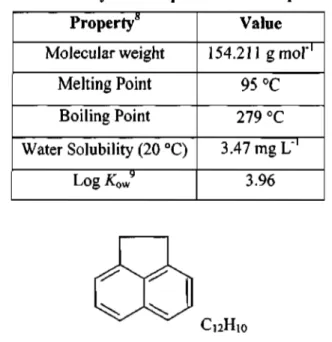
Table 1.1.a. displays the physical properties of acenaphthene, while Figure 1.1.a. is the structural representation of an acenaphthene molecule.
Table l.l.a. Physical Properties of Acenaphthene Property8
Molecular weight Melting Point
Boiling Point Water Solubility (20 °C)
Log A:owy
Value 154.211 gmof1
95 °C 279 °C 3.47 mgL"'
3.96
Figure l.l.a: Molecular Structure of Acenaphthene
Phenanthrene is a component of crude oil and is used in the manufacture of dyestuffs and explosives; in biochemical research and in drug synthesis.10 The compound has been reported to be toxic to fish at 3.2 mg L"1 and invertebrates at 0.6 mg L"1.11 In humans, experimental tumorigenic data via skin contact has also been reported.12
Table 1.1 .b. displays the physical properties of phenanthrene, while Figure l.l.b. is the structural representation of a phenanthrene molecule.
Table 1.1.b. Physical Properties of Phenanthrene Property"
Molecular weight Melting Point Boiling Point Water Solubility (20 °C)
Log Kov?
Value 178.233 gmor1
99.5 °C 340 °C 1.18 mgL"1
4.52
C14H10
Figure 1.1.b: Molecular Structure of Phenanthrene
cyt)
1.2. Soils
1.2.1. Introduction
Soils are porous, heterogeneous mixtures of inorganic and organic matter, water and air.
Due to increased concern about inorganic and organic contaminants in soil and water and their impact on plant, animal and human health, the emphasis of soil chemistry now includes environmental soil chemistry, along with the traditional studies on plant and growth nutrition. The basis of environmental soil chemistry is the study of chemical reactions between soils and environmentally important plant nutrients, radionuclides, metals and organic chemicals.14
Biological, geological and hydrological weathering processes lead to the formation of soil at the land surface. Soils exhibit an approximately vertical stratification (the soil horizons) produced by the continual influence of percolating water and living organisms and therefore differ from weathered rock. Soils are open systems because they exchange matter with the surrounding atmosphere, biosphere and hydrosphere and undergo continual biological and chemical transformations that link them physically with the atmosphere and hydrosphere.15
Knowledge of environmental soil chemistry enables one to predict the fate of contaminants in the surface and subsurface environments. An understanding of the chemistry and mineralogy of inorganic and organic soil components is necessary to comprehend the multitude of chemical and physical transformations that contaminants may undergo in the soil environment, viz. equilibrium and kinetic processes such as dissolution, precipitation, polymerisation, adsorption/desorption and oxidation-reduction.
Dissolution is the separating of a soil solid into its component parts into the soil solution.
Precipitation occurs when supersaturated conditions exist in the soil solution resulting in the deposition of a substance from the soil solution.1 Polymerisation occurs when chemical species involving molecular units in a repetitive structure form polymers.
Examples of polymers are Al2(OH)24+, Fe2(OH)24+ and biopolymers such as proteins and polysaccharides.16 Adsorption occurs at the solid-liquid interface. In physisorption, one
material will sorb onto another material by weak Van der Waals forces of attraction.
Chemisorption involves adsorbed molecules held to the surface by stronger covalent forces similar to those occurring between atoms and molecules.17 Oxidation-reduction reactions involve the transfer of electrons from one substance to another. H, C, N, O, S, Mn, Fe and Cu are elements that commonly undergo redox reactions.16 These processes affect the solubility, mobility, speciation and toxicity of contaminants in soils, surface waters and groundwaters.14
1.2.2. Composition, Structure and Classification of Soils
About 50 - 67% of the soil volume is made of solid matter. Of this material, typically more than 90% is represented by inorganic compounds, except for peat and muck soils wherein organic material accounts for more than 50% of the solid matter.15
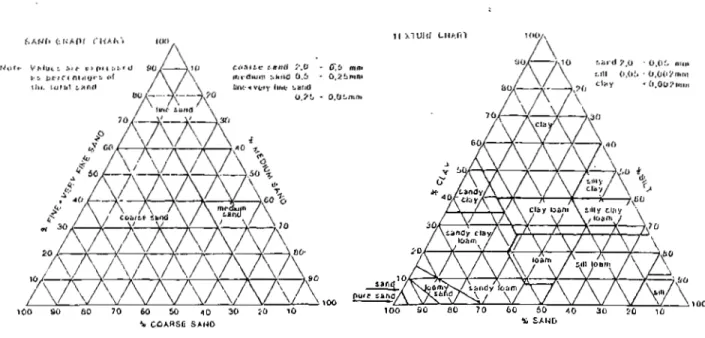
The different soil size fractions generally used in the mechanical analysis of fine earth samples are the coarse sand, fine sand, silt and clay size fractions. Table 1.2.a. lists these soil fractions and particle size diameters.18'19
Table 1.2.a: Classification of Soils by Particle Size
Fraction Coarse Sand
Fine Sand Silt Clay
Particle Size Diameter 2.0 - 0.2 mm 0.2 - 0.02 mm 0.02 - 0.002 mm
O.002 mm
Figure 1.2.a. shows the Sand Grade Chart and Texture Chart which enables the classification of soils according to texture and particle size.
100 SO BO 70 60 50 40 30 SO 10 100 90 80 70 CO 60 40 30 20 10
% COARSE SAND * SAND
Figure 1.2.a: Classification of Soil According to Texture and Particle Size
1.2.3. Inorganic Soil Matter
Inorganic or mineral soils are generally very low in organic matter (1-10% m/m), and occupy a much greater proportion of the total land area compared to organic soils.13 Although soils have a variable nature, a number of solid phases of relatively uniform mineral composition have been identified in soils. Oxygen and silicon are the most abundant elements in soil that combine with other elements to form the fifteen common minerals listed in Table 1.2.b.15
Table 1.2.b: List of Typical Soil Minerals15 Name
Quartz Feldspar
Mica
Amphibole
Pyroxene Olivine Epidote Tourmaline Zircon Rutile Kaolinite Smectite Vermiculite Chlorite Allophane Imogolite Gibbsite Goethite Hematite Ferrihydrite
Birnessite Calcite Gypsum
Chemical Formula Si02
(Na,K)A102[Si02]3, CaAl204[Si02]2
KjAbOstSisOslsAUCOHK K2Al205[Si205]3(Mg,Fe)6(OH)4
(Ca,NA,K)2,3(Mg,Fe,Al)5(OH)2[(Si,Al)40„]2
(Ca,Mg,Fe,Ti,Al)(Si,Al)03 (Mg,Fe)2Si04
Ca2(Al,Fe)3(OH)Si3012
NaMg3Al6B3Si6027(OH,F)4 ZrSi04
Ti02
Si4Al4O10(OH)8
Mx(Si,Al)8(Al,Fe,Mg)402o(OH)4> where M= interlayer cation
Si3Al40i2.«H20 Si2Al40,o.5H20 Al(OH)3
FeO(OH) Fe203
Fe,0Oi5.9H2O
(Na,Ca)Mn70i4.2.8H20 CaC03
CaS04.2H20
Importance
Abundant in sand and silt Abundant in soil that is not leached extensively
Source of K in most temperate-zone soils
Easily weathered to clay minerals and oxides
Easily weathered Easily weathered
Highly resistant to chemical weathering, used as index mineral in pedologic studies
Abundant in clay as products of weathering, source of exchangeable cations in soils
Abundant in soils derived from volcanic ash
Abundant in leached soils Most abundant Fe oxide Abundant in warm regions Abundant in organic horizons
Most abundant Mn oxide Most abundant carbonate Abundant in arid regions
Quartz, feldspar, mica, amphibole, pyroxene and olivine are primary minerals because they are inherited from parent material as opposed to being precipitated through weathering processes. The key feature in these minerals is the Si-0 bond, which is more covalent and stronger than most metal oxygen bonds. These minerals show greater resistance to both chemical and physical weathering. The minerals listed from kaolinite to gypsum are classified as secondary minerals because they almost always result from the weathering of primary silicates. These secondary minerals are often less than 0.002 mm in diameter (c.f.
clay) and have a relatively poorly ordered atomic structure.15 1.2.4. Soil Organic Matter (SOM)
Plant tissue is the primary source of soil organic matter and becomes part of the soil horizon upon decomposition and digestion by soil microorganisms. Animals are secondary sources of soil organic matter (SOM) because they feed on the primary plant tissue, thereby creating waste products and also contribute their own bodies to SOM at the end of their life cycles.13
SOM forms stable complexes with micronutrient elements such as zinc, iron and copper. It exhibits low bulk density and low particle density. SOM possesses extensive surface area for adsorption and many other reactions while exhibiting low specific heat and low conductivity which mean its surface warms up easily. It has the greatest affinity for hydrophobic contaminants compared to other soil solids, and thus plays a crucial role in contaminant sorption kinetics. SOM resists compaction and improves water filtration, and improves soil structure. Organic matter decomposes and thus elements are recycled.22 1.2.5. Factors Affecting Contaminant Sorption and Desorption
The extent of the sorption of chemicals onto soil particles affects their mobility, bioavailability and toxicity. The physical availability of organic contaminants is affected by their rates of sorption and desorption onto solids. Properties affecting the sorption of contaminants onto soil are solute concentration and residence time and soil physical properties and chemical properties.
In a study to determine the effect of concentration on the sorption of pentachlorophenol (PCP) on soil, the rate of sorption was observed to increase with increasing PCP concentration, but only up to a concentration of 13 mg L" . Weber et al2A, Braida et al25 and Schlebaum et al26 have reported that the sample with a higher initial PAH content always reached equilibrium faster than the sample with the lower PAH concentration.
Sorption of hydrophobic organic compounds (HOCs) can be divided into two phases, a rapid initial sorption phase followed by a slow sorption stage. Increased residence time results in slow increases in sorption.22 As the contact time between the soil and contaminant increases, the contaminant could become more difficult to remove from the matrix.
The physical properties of soil include particle size, soil temperature, pore volume and soil moisture content. These properties can affect sorption and desorption of contaminants.
Generally, adsorption increases with decreasing particle size because of the increase in surface area per unit volume. Particle size therefore becomes an important property in silt (2 urn < particle diameter < 75 um) and clay (particle diameter < 2 urn).27 Finer particles also tend to have higher organic matter content, which generally leads to a higher adsorption of organic contaminants.
The rate of chemical reactions in soils is enhanced at higher temperatures.29 Under dry conditions, high temperatures lead to the upward movement of capillary water, bringing dissolved salts to the surface, which may lead to increased precipitation. Very low temperatures inhibit microbial activity and the movement of organic matter into the soil.30 In a study to determine the effect of temperature on organic compound adsorption to soil, Sleep et al31 reported a decrease in sorption coefficients for toluene, perchloroethylene and naphthalene by 35, 40 and 60 % respectively when the temperature was changed from 25 °C to 90 °C. This suggests that thermal remediation techniques such as hot-water and steam flushing could assist in the removal of sorbed organic soil contamination.
The pore volume is the volume of soil occupied by air and water and is determined by the packing of the soil solids. If the particles are closely packed as in sands or compact
There are two types of pores, micropores and macropores. Micropores are defined as having a diameter of 0.06 mm or less and are filled with water that inhibits the movement of air within the soil.13 Macropores, in contrast, allow for the movement of air and water.
Thus, larger pores can be emptied out quicker than smaller pores. The movement of a molecule within a channel of soil pores is dependant on its size relative to the soil pore size.32
As soil moisture content increases, the amount of air filled pore space is reduced.
However, as water content increases, water molecules displace contaminant molecules and sorption decreases, thus increasing the volatilisation of contaminants.33 Water also mobilizes contaminants through the soil. Upward mobility of contaminants may occur through capillary action.
Chemical properties of soil include cation exchange capacity (CEC), pH and ionic strength. These properties can also have a profound effect on contaminant sorption and desorption.
Soil colloids that are made of clay and humus particles tend to possess nett negative surface charges, causing the particles to behave like giant anions. Cations such as Ca2+, Mg2+,K+and NH4+that are associated with the soil minerals are attracted to these charged surfaces. The strength of this attraction may lead to some cations being exchanged with others. The total negative charge on the surface is known as the cation exchange capacity, CEC. Soil organic matter contributes significantly to the soil's cation exchange capacity.
As discussed in Section 1.2.4, soil organic matter (SOM) has the highest affinity for hydrophobic organic contaminants compared to other soil solids, and thus an increase in SOM results in an increase in HOC sorption. As the pH increases, the CEC increases and the preference for polyvalent cations increases. An increase in fractional organic carbon content of the soil leads to an increase in the CEC and the soil surface becomes more negative34; the CEC also increases with an increase in the clay mineral content, especially montmorillonite.29
Materials between structural layers of minerals, including cations, hydrated cations, organic molecules, and hydroxide octahedral groups and sheets are defined as the interlayer. The sorption capacities of clays are affected by the type of interlayer cation
present. Hundal et al demonstrated that the sorption capacities of K-saturated smectites were greater than those of Na-saturated smectites. The hydrophobicity of a smectite was affected by the amount of layer charge, the location of the charge i.e. tetrahedral or octahedral site and the hydration energy of the cation that hydrated the charge.
Sorption has been shown to decrease with increasing soil pH.36 This behaviour has been related to the surface charge of humic materials. As surface charge increases, humic materials are thought to become less hydrophobic by charge repulsion. This makes the humic materials more hydrophilic and reduces their sorption affinity for hydrophobic solutes.37
Lee et al demonstrated that at a higher ionic strength the sorption affinity between soil and naphthalene was increased. Stauffer et a/39 also observed a marginal increase in hydrophobic organic compound (HOC) sorption with increase in ionic strength. This was attributed to a 'salting out' effect, i.e., a decrease in aqueous solubility of HOCs at an increased ionic strength.
1.3. Surfactants
1.3.1. Introduction
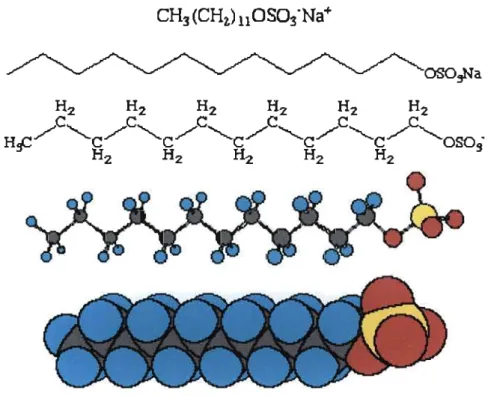
The word surfactant is derived from the phrase surface-active agent.40 The surface activity of a surfactant is due to its amphiphilic nature.41'42 Amphiphiles contain both a hydrophobic hydrocarbon tail group and a hydrophilic head group,39 thus making them semi-soluble in both aqueous and organic solvents. Figure 1.3.a. shows different representations of a common surfactant, sodium dodecylsulfate.43
CH3(CHi)11OS03-Na+
w v w ^
Figure 1.3.a: Sodium Dodecylsulfate Surfactant Molecule
As can be seen in Figure 1.3.a, the surfactant tail group consists of a long lipophilic hydrocarbon tail. Surfactants are also amphipathic compounds because they avoid the organic and aqueous phases, congregating instead at the organic/aqueous interface, or forming micelles.44 Micelles are dynamic clusters that form once a critical concentration of surfactant monomers is exceeded. This concentration is called the critical micelle concentration or CMC. Figure 1.3.b is a two dimensional representation of a sodium dodecylsulfate micelle.42
Figure 1.3.b.: Sodium DodecylSulfate Micelle
1.3.2. Surfactant Behaviour in Water
To understand micelle formation and surfactant behaviour in water, one has to understand the concept of surface tension. Water molecules are very strongly associated in the aqueous phase due to hydrogen bonding. This is illustrated in Figure 1.3.c.
A ® ©
Figure 1.3.c: Hydrogen Bonding in Water Molecules
>
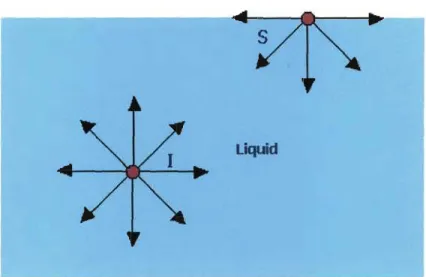
Water molecules at the surface behave differently to the water molecules below the surface. If one considers the surface water molecule S in Figure 1.3.d45, the net force acting on it is directly inward. This net inward force acting on all surface water molecules causes water to seek the minimum surface area per unit volume, thus water has the tendency to form droplets or spheres. This is known as surface tension. Surface tension thus slows the wetting of a surface, thereby inhibiting the cleaning process.
Free surface
w
* \
^
¥
i
\
/
1
i
J» X
\V
m \Liquid
/
Figure 1.3.d: Forces Acting on Water Molecules
Surfactants aid the cleaning process because they reduce the surface tension of a liquid by reducing the contact angle (angle formed between two substances in contact, as determined by their surface tensions) thus making wettability easier. Figure 1.3.e shows the alignment of monomers at the water's surface and the formation of a spherical micelle in water.46 The hydrophilic heads of the surface surfactant monomers are attracted to the water molecules while the hydrophobic tails are oriented away from water. In a spherical micelle, the hydrophilic head points to the water, while the hydrophobic tail is directed inward to the core of the micelle.
Figure 1.3.e: Micelle formation in water
In addition to spherical micelles, other types of micelle include reversed micelles, admicelles and hemimicelles. A reversed micelle has the surfactant heads pointing inward toward the core and the tails pointing outward. This micelle would form in a nonpolar liquid. Admicelles (Figure 1.3.f) and hemimicelles (Figure 1.3.g) form at the liquid-solid interface.39 Hemimicelles are a single layer of monomers sorbed onto a solid surface whilst admicelles are aggregated layers of surfactant monomers.
7 / 7
Figure 1.3.f: admicelle
7 / /
Figure 1.3.g: hemimicelle
1.3.3. Properties of Surfactants and their Applications
Surface-active properties of surfactants include foaming, emulsification, dispersion, detergency and solubilisation.47
Foaming, emulsification and dispersion involve surfactants suspending, respectively, a gas, immiscible liquid or a solid in liquid.45 A foam is a gas dispersed in a liquid. It is formed when gas introduced beneath the surface of the liquid is enclosed by the expansion of the liquid around the gas in a thin film.48 Foaming is desirable in shaving foams, bubble baths and shampoos, but is undesirable in applications where agitation or high pressure spraying is used. In the latter, foaming will reduce the contact between the liquid reactants, thus reducing the contact time. In high pressure spraying application foaming reduces the pressure from the jet stream.
An emulsion is a reasonably stable suspension of two immiscible liquids. Emulsion stability could range from minutes to years.46 Two types of emulsions exist, macroemulsions and microemulsions. Macroemulsions (particle size range 0.2 to 50 urn) are physical dispersions of one fluid in the other and are relatively unstable.
Microemulsions (particle size range 0.01 to 0.20 um) on the other hand are composed of
submicroscopic particles that are suspended by Brownian motion and hence are thermodynamically stable. Macroemulsions are frequently highly viscous dispersions, whereas microemulsions are extremely fluid with relatively low viscosities.
Dispersion is the suspension of a solid in liquid. Two types of dispersions exist, lyophobic and lyophilic. In lyophobic dispersions, the dispersed solids are not well solvated; in lyophilic dispersions, the dispersed solids are well solvated by layers of solvent molecules, thus making them less susceptible to aggregation and thus more stable.
Detergency involves three steps. The soiled substrate is first wetted; then the soil is removed from the substrate and finally soil is suspended and prevented from redepositing on the substrate. Solubilization refers to the micellar uptake of an insoluble compound to form a clear and stable solution.49
As a result of these properties, surfactants are used in the chemical manufacturing industry and are important constituents of toiletries and detergents. Surfactants are also used in the stabilisation of emulsions {e.g. convenience foods, paints) and oil-well drilling.50
1.3.4. Surfactant Classification
Surfactants are classified according to the nature of their head group in aqueous media. 40,51 Table 1.3.a lists the surfactants according to their head group.
Table 1.3.a: Classification of Surfactants
Charge on head group Positive (+) Negative (-) No charge (0) Positive and negative
Classification of surfactant
Cationic (ammonium chlorides, amine acetates) Anionic (fatty acids, sodium dodecyl sulfate)
Nonionic (polysorbates, cholesterol) Zwitterionic/amphoteric (ammonium sulfates, amine oxides)
Anionic surfactants are the most widely manufactured surfactants because of their low manufacturing cost and their detergent action. They have higher critical micelle
concentration (CMC) values than with nonionic surfactants. This is advantageous because monomers diffuse rapidly compared to large micelles. Also, the soil molecule is electrostatically attracted to the anionic head, thus making soil removal easier.40,48
Cationic surfactants are expensive to manufacture and have a poor detergent action;
applications include softeners, anticaking agent in fertilisers, dispersing agents in bitumen and corrosion inhibitors in oilfields.49 They are readily adsorbed onto solids from aqueous solution.
Nonionic surfactants are most widely used in the food and animal feed industries. Other areas of use include mining, flotation, oil recovery, textiles and fibres, cosmetics, paints and polymers because of their ability to form extremely stable emulsions.46
In acidic solutions, amphoteric surfactants form cations and in alkaline solutions they form anions. These surfactants are used with anionic surfactants in shampoos, foam baths, shower gels and washing powders. Amphoteric surfactants are milder on the skin than anionic surfactants.
1.3.5. Surfactant Parameters
An in-depth understanding of surfactant properties viz. hydrophile-lipophile balance (HLB number), cloud point, aggregation number and turbidity are required to optimise surfactant selection for any given application.
HLB Number
The HLB number predicts the emulsifying properties of a nonionic surfactant and is applicable to nonionic surfactants only and a proposed formula for charged surfactants has proved to be unsuccessful. Equation 1.2 can be used to estimate the HLB number.49
molar % of the hydrophilic group
HLB = (1-2)
Surfactants with low HLB numbers have a weak hydrophilic end and a strong lipophilic end and are therefore oil soluble. Conversely, surfactants with high HLB numbers have a strong hydrophilic end and a weak lipophilic end and are therefore water-soluble.4 The
HLB number effectively compares the polyaromatic (PAH) solubilisation powers of surfactants. The lower the HLB number, the greater the solubilising power of the surfactant.
Cloud Point
The cloud point temperature is an indication of the maximum temperature to which a surfactant solution should be heated and is only applicable to non-ionic surfactants Ethylene oxide derivatives are soluble in water due to the hydrogen bond between water and the ethylene oxide group. When an ethylene oxide derivative solution is heated, dehydration takes place and the product precipitates out of solution. The temperature at which this occurs is known as the cloud point, as the solution becomes cloudy. Above this temperature, solubility decreases rapidly. The product dissolves again on cooling.
Aggregation Number
The aggregation number is the average number of monomers making up a micelle.52 This number is dependant on the nature of the surfactant and the temperature of the aqueous solution and is important because it determines the size of the core of the micelle, which in turn, determines how much solute it can accommodate. Turbidity is the cloudiness caused by suspended particles in solution.
1.3.6. Surfactants in Soil and Aquifer Remediation
Due to environmental concerns, surfactants have assumed an important role in the remediation of PAH-contaminated soil and aquifer material.
Surfactants have been found to be useful in soil washing and bioremediation studies54 and can be used in various ways to enhance the remediation of hydrophobic organic compound (HOC) contaminated soils or sediments. Cationic surfactants can be irreversibly sorbed onto soils to enhance HOC sorption and immobilisation; nonionic surfactants can reduce the interfacial tension between water, sediment and non-aqueous phase liquid (NAPL) to induce two-phase flow;40 surfactants can increase the bioavailability of a substrate in bioremediation and the HOCs can be desorbed from soil by micellar surfactant solutions.55
1.3.7. Micellar Sol utilisation of Organic Compounds by Non-ionic Surfactants
Micelles are dynamic aggregates, with sizes ranging typically in the nanometre range. The residence time of a monomer within a micelle at a given coordination number is of the order of 0.2 - 10 \\s, and the mean lifetime of a micelle is in the millisecond time scale.
The rate of transfer of hydrophobic organic hydrocarbons (HOCs) between the aqueous and micellar phases is rapid. A first order rate coefficient of 10 (is-1 was measured for the transfer of pyrene into a sodium dodecylsulfate micelle.56
Micellar solubilisation involves the transfer of the soluble compound from the aqueous phase to the micellar phase. Solubilisation can occur at different sites in a micelle as shown in Figure 1.3.h. These sites have been identified as: a) the micelle-water interface, b) between the hydrophilic head groups, c) in the micelle palisade layer and d) the inner core of the micelle.5
micelle-liquid interface
Figure 1.3.h: Solubilisation Sites in a Micelle
The site at which solubilisation occurs depends both on the surfactant and the solute, e.g. in an ethoxylated non-ionic surfactant, nonpolar HOCs will be solubilised into the micellar core, while polar HOCs will be solubilised in the polyoxyethylene (POE) shell.58
1.3.8. Factors Affecting the Micellar Solubilisation of PAHs
The amount of solute that can be accommodated by a micelle depends on the surfactant structure, aggregation number, micelle geometry, ionic strength, temperature, solute polarity, solute hydrophobicity and solute size.51
The aggregation number increases with increasing temperature below the surfactant cloud point. Thus, the hydrodynamic radius and the core volume of the micelle also increase.59 Increasing the temperature also increases the aqueous solubility of the organic compound and the thermal agitation of the surfactant molecule. These factors serve to enhance PAH solubilisation.
Pennell et al 60 demonstrated that surfactants with a larger alkyl chain length are able to solubilise more hydrocarbons than shorter chain surfactants with similar HLB values. The longer hydrophobic chain creates a larger micelle core volume. In the study of the solubilisation of compounds of differing polarity in non-ionic surfactant solution, the authors concluded that larger quantities of the less hydrophobic compound were solubilised. This is explained by the fact that the more hydrophobic compound will only be solubilised into the core of the micelle, while the less hydrophobic compound can be solubilised into the core of the micelle and the polyoxyethylene (POE) shell.
The solubilisation rate of an organic molecule into a micelle is dependant on the size of the molecule because larger molecules move slowly. Fewer large molecules can be accommodated by the micelle than a smaller molecule.61
1.3.9. Adsorption of Surfactants onto Surfaces
Surfactants may be lost during soil and aquifer remediation processes due to mechanisms such as precipitation with natural hardness in groundwater, sorption onto soil and biodegradation by soil microorganisms.62'63 A micelle, being an aggregate, will break up on contact with soil because of monomer adsorption at the soil-water interface.
Factors affecting surfactant sorption onto surfaces include surfactant chain length, pH, ionic strength, surfactant concentration, soil organic matter and in the case of nonionic surfactants, the number ofethoxylate groups.
In a study of cationic surfactant adsorption onto silica, Goloub and Koopal64 found that increasing the aliphatic chain length resulted in an increase in the hydrophobic attraction with the surface as well as an increase in the lateral attraction with the hydrocarbon chains
of surfactant. As the pH increased, the amount of surfactant adsorbed onto the surface also increased. There was a steeper increase in adsorption at higher ionic strengths. In another study of factors affecting surfactant sorption onto surfaces, at low ionic strengths, anionic surfactant adsorption decreased with an increase in pH.65 For high sorption capacity soils (e.g. clays), surfactant adsorption increased with increasing ionic strength. However, adsorption remained independent of ionic strength for low sorption capacity soils.
Changes in nonionic surfactant sorption were inversely proportional to changes in pH, since changes in pH can change the surface properties of a soil.
The sorption of nonionic surfactants was shown to reach a maximum at a surfactant concentration just below or at the CMC.67 At low surfactant concentrations, sorption of surfactant as monomers may occur, while at higher surfactant concentrations, surfactants sorb as bilayer aggregates or admicelles. At concentrations greater than the CMC, the amount of sorbed surfactant may reach a constant.
John et at1 concluded that nonionic surfactant adsorption is inversely proportional to the number of surfactant ethoxylate groups, especially in soils with a high sorption capacity.
The nonionic surfactant bonds to the soil via hydrogen bonding. Nonionic surfactant adsorption is also inversely proportional to the ethylene oxide chain length. This is because long chains hinder the formation of admicelles due to chain-chain interactions.
Soil organic matter enhances the sorption process. This could be due to hydrophobic interaction with the hydrocarbon chains of the nonionic surfactant.
1.3.10. Surfactants and The Environment
In order for surfactants to be environmentally acceptable, they should ideally be biodegradable, non-toxic to human, animal and plant life and be recyclable. If biodegradable, the biodegradation products should also be non-toxic. Some surfactants have the ability to interact with cell membranes68 by adsorbing at interfaces and binding through hydrophobic interactions with proteins. This can cause disruption in normal cell function and also affects enzymic activity.69
While some surfactants could be environmentally agreeable, others may prove to be
Nonylphenol ethoxylates have been banned in Western Europe because they have been found to have endocrine disrupting effects in freshwater organisms at concentrations of 20 Ugl"1.69'72
Two primary alcohol ethoxylate non-ionic surfactants, Dobanol 45-7 and Dobanol 45-11, were tested for biodegradability and 96 - 98% degradation was achieved in the 5 to 10 °C temperature range. The toxicity of the degradation products was tested on rainbow trout over a period of 7 days. No adverse effects were noted on the fish.69
Warisnoicharoen et af3 investigated the toxicity of the nonionic surfactants, polyoxyethylene-10-oleyl ether (C18:1E10), polyoxyethylene-10-dodecyl ether (C12E10), and jV,iV-dimethyl-dodecylamine-N-oxide (C12AO) to human bronchial cells. Systems containing C12E10 and C12AO were toxic at concentrations around or below their critical micelle concentrations. Surfactant toxicity was suggested to be due to the disruption caused by the partitioning of monomeric surfactant into the cell membrane.
1.4. Soil Washing
1.4.1. Introduction
Soil washing incorporates a combination of physical and chemical techniques to clean contaminated soils.74 Soil washing may be done ex-situ or in-situ. Ex-situ soil washing involves excavating contaminated soil, which is then fed into a soil-washing unit.
Contaminants are removed by contacting the soil with a washing solution.
In-situ soil flushing is applied to unexcavated soils using a groundwater extraction and reinjection system. A solvent and/or a surfactant solution is added to the soil and the contaminants in the leachate or groundwater are then recovered.75
Chu et al76 identified two distinct stages in which soil washing could occur.
• In the first stage, hydrocarbons can be extracted from the soil by surfactant monomers. It was noted that the washing performance was directly proportional to the available monomer content.
• In the second stage, the soil is saturated with surfactant so micellization can occur.
The HOCs can then be solubilised by the micelles. These two stages are analogous to the soil rollup and solubilisation mechanisms discussed later in Section 1.4.2.d..
1.4.2. The Soil Washing Process
Although different soil washing processes vary slightly from each other, the basic unit processes and principles are standard. These unit processes are particle size separation, washing of sand size fraction, treatment of fines and effluent treatment.
1.4.2.a. Description of the Equipment Used in Soil Washing
A trommel (Figure 1.4.a)77 is a large mechanically operated screen that consists of a rotating perforated cylinder with its axis at a slight angle to the horizontal. A grizzly (Figure 1.4.b)78 is a large hand operated screen. It has a plane screening surface composed of longitudinal bars (up to 3 metres long) fixed in a rectangular framework. In a
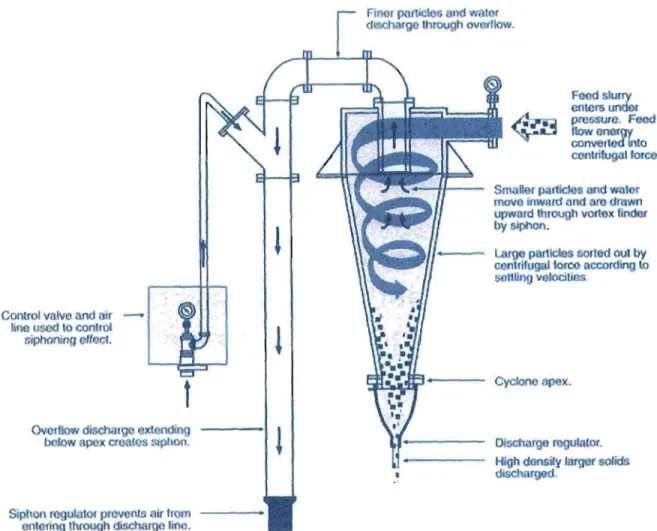
hydrocyclone (Figure 1 Ac)79, feed is introduced at a high tangential velocity. Separation
on
of particles is effected in the centrifugal field. A belt filter (Figure 1.4.d) is an endless belt arranged in the horizontal plane and running over pulleys. Rubber or wiper blades drag against the cake surface and can be used to isolate the filtrate and washing zone from each other. The abovementioned equipment is used to screen oversized soil fractions.
Figure 1.4.a: Trommel
®+®, *®
Figure 1.4.b: Cross-Section of a Grizzly 1. Plate Feeder
2. Vibrating Grizzly Screen 3. Oversize to the crusher 4. By-pass of the crusher 5. Waste
I — Finor particles and water discharge Ihrough overflow.
Control valve and air line used to control siphoning effect.
Ovoiltow dischaige extending below apex creates siplvon.
Siphon rogulatot prevents air Iron*
entering through discharge line.
<$Si
Food slurry enters undor pressure Feed Dow energy converted into centrifugal lorce.
Smaller particles and water move inward and are drawn upward through vortex Under by siphon.
Large particles sorted out by centrifugal force according to settling velocities
Cyclone apex
Discharge regulator High density larger solids discharged.
Figure 1.4.c: Schematic Diagram of a Hydrocyclone
Figure 1 Ad: Belt Filter
1.4.2.b. Particle Size Separation
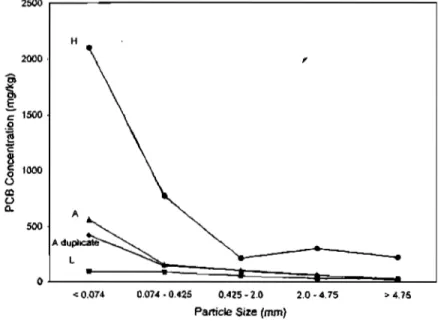
The concentration of contaminants in the soil matrix increases with decreasing particle size as demonstrated for soil samples L, A and H in Figure 1.4.e.81 This is due to an increased surface area per unit volume (Section 2.4). The three soil fractions significant to soil washing are the oversize fraction (particle diameter > 5mm), the sand fraction (0.063 um <
particle diameter < 5mm) and the fine particle fraction (particle diameter < 0.063 um).74 If fines constitute a small fraction of the bulk soil, the fines could be washed from the soil particles, leaving behind a clean, coarse fraction.82
2500
< 0.074 0.074-0.425 0.425-2.0 2.0-4.75
Particle Size (mm)
Figure 1.4.e: Concentration of Polycblorinated Biphenyls in Different Soil Size Fractions
Noyes83 related the effectiveness of soil washing to particle size distribution (Table 3).
Table 1.4.a: Effectiveness of Soil Washing in Relation to Particle Size Distribution Particle size distribution (mm)
>2.00 0.25-2.00 0.063-0.25
<0.063
Effectiveness
Oversize pretreatment requirements Effective soil washing
Limited soil washing
Difficult soil washing (Clay fraction)
Only contaminated soil is fed to the soil washing plant, therefore, the gross oversize debris must be removed in-situ. The pre-screening can be achieved using a hopper mounted with a vibrating grizzly, and a trommel screen to screen out particles of diameter greater than 50 mm. 74
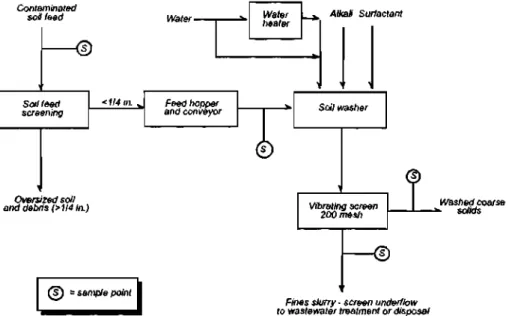
Since smaller particles adhere to larger particles, the soil can be broken up in an attrition scrubber.84 Attrition forces arise from the friction of particles against one another or against a rigid surface.85 In a volume reduction unit (VRU) shown in Figure 1.4.f,86 high attrition is achieved by blending soil with a small volume of water and washing additive in a trough bottom hopper fitted with a ribbon blender. The washed mixture then moves on to a trommel that is sprayed with additional wash water. Particles of diameter greater than 2 mm are screened out. Thus, the clean coarse fraction is removed from the fines.82 Sandscrews combine countercurrent washing of the soil with hydrosizing and flotation to remove fines from soil slurry.84 Hydrocyclones have also been employed in particle size separation. In the cyclone, the sand is able to exit from the bottom and the fines from the top.74'82 Froth flotation may also be used for particle size separation. A flotation surfactant reduces the surface tension binding the sand and contaminant. The froth is generally passed onto the fines management stream. If there is a significant density difference between the sand and contaminant, spiral concentrators may be employed.
Contaminated soil feed
• o
Soil feed screening
Oversized soil and debris (>1I4 in.)
^) = sample point
Water-
Feed hopper and conveyor
Water
heater Alkali Surfactant
©
Soil washer
Vibrating screen 200 mesh
"©
©
Washed coarse
*• solids
Fines slurry - screen underflow to wastewater treatment or disposal
Figure 1.4.f: Schematic Diagram of a Volume Reduction Unit (VRU)
1.4.2.C Treatment of Fines
The fine particles are managed in a separate system. This is a difficult fraction to treat because of the high contaminant concentration and complex binding and speciation of contaminants. Soil particles finer than 20 urn can only be washed if the contaminants can
84
be solubilized by the wash water or separated by flotation.
Alternatively, fines are treated like wastewater sludge by polymer addition, sedimentation, thickening and dewatering. The use of biological additives to bioremediate the fines 'sludge' can also be considered. The sludge is thickened to approximately 15 % dry solids and the water is recycled to the screening area. The thickened solids are then filtered under pressure using a belt filter press. The influent is then converted to an approximately 50 % dry solids filter cake, within which the contaminants are contained. The cake can be treated ex-situ?*
1.4.2.d. Wash Water Additives
Additives should be avoided if plain water can be used to achieve appreciable volume reduction of contaminants. Additives complicate recycling of wash water, however, it is necessary to use additives if the contaminants are greatly hydrophobic. Commonly used additives include acids, bases, surfactants, dispersants and chelating agents. (Acids and chelating agents are used in metal contaminated soil washing.) 82
Two mechanisms are involved in surfactant enhanced soil washing. Below the critical micelle concentration (CMC), washing occurs with the soil rollup mechanism and above the CMC, washing occurs via solubilization. In the soil rollup mechanism, the first step involves surfactant monomers aligning at the soil-contaminant and soil-water interfaces thus increasing the contact angle between the soil and the contaminant. Monomers adsorbed on the contaminant's surface cause repulsion between the monomer's head group and the soil particles, thereby loosening the hygroscopic bond between the contaminant and the soil. In the second step, convective currents displace the contaminant from the soil. In solubilisation, contaminants are partitioned into the hydrophobic core of the surfactant micelles.87