COMBINED EFFECT OF BIOCHAR AND PHOSPHORUS ON GROWTH AND YIELD OF WHEAT UNDER DIFFERENT
IRRIGATION REGIME BY
ISHRAT ANJUM
DEPARTMENT OF AGRONOMY
SHER-E-BANGLA AGRICULTURAL UNIVERSITY SHER-E-BANGLA NAGAR, DHAKA, BANGLADESH
JUNE, 2021
COMBINED EFFECT OF BIOCHAR AND PHOSPHORUS ON GROWTH AND YIELD OF WHEAT UNDER DIFFERENT
IRRIGATION REGIME
BY
ISHRAT ANJUM Registration No: 13-05607
A Thesis
Submitted to Department of Agronomy
Sher-e-Bangla Agricultural University, Dhaka.
In partial fulfilment of the requirements For the degree of
MASTER OF SCIENCE IN
AGRONOMY
SEMESTER: JANUARY-JUNE, 2021 Approved By:
_______________________ _______________________
Prof. Dr. Md. Abdullahil Baque Prof. Dr. Md. Fazlul Karim Supervisor Co-Supervisor
_________________________
Prof. Dr. Tuhin Suvra Roy Chairman
Examination committee
CERTIFICATE
This is to certify that the thesis entitled, ‘COMBINED EFFECT OF BIOCHAR AND PHOSPHORUS ON GROWTH AND YIELD OF WHEAT UNDER DIFFERENT IRRIGATION REGIME’
submitted to the Faculty of Agriculture, Sher-e-Bangla Agricultural University, Dhaka, in partial fulfilment of the requirements for the degree of MASTER OF SCIENCE in AGRONOMY, embodies the result of a piece of bona fide research work carried out by ISHRAT ANJUM, Registration No. 13-05607 under my supervision and guidance. No part of the thesis has been submitted for any other degree or diploma.
I further certify that such help or source of information, as has been availed of during the course of this investigation has duly been acknowledged.
Dated: _______________________________
Place: Dhaka, Bangladesh. Prof. Dr. Md. Abdullahil Baque Prof. Dr. Md. Abdullahil Baque
Department of Agronomy, Sher-e-Bangla Agricultural University Sher-e-Bangla Nagar, Dhaka-1207 Mobile no: +8801747837095 E-mail: [email protected]
i
AKNOWLEDEMENTS
At first the author would like to express her gratitude to the Almighty Allah who enabled her to complete her research work successfully as well as to submit this thesis paper for achieving the degree of Master of Science in Agronomy from Sher-e-Bangla Agricultural University.
The author expresses her heartiest gratitude, sincere appreciation and immense indebtedness to her Supervisor Professor Dr. Md. Abdullahil Baque, Department of Agronomy, Sher-e-Bangla Agricultural University for his sincere guidance, scholastic supervision, constructive criticism and continuous inspiration thorough out the course and during compiling this thesis paper.
She would like to express her heartfelt respect to her C0-Supervisor Professor Dr. Md. Fazlul Karim, Department of Agronomy, Sher-e- Bangla Agricultural University for his cordial suggestions and constructive criticism during research work and preparing this thesis paper.
The author expresses her sincere respect to the Chairman Prof. Dr. Tuhin Suvra Roy & former chairman Prof. Dr. Shahidul Islam for providing all facilities to conduct this experiment and sharing their valuable advices.
She expresses her wholehearted gratefulness to all the teachers of department of Agronomy for their teaching, encouragement and co- operation during the whole course. Her special thanks to Prof. Dr.
Parimal Kanti Biswas, former Dean, Post-Graduation, Sher-e-Bangla Agricultural University for his countless support during the whole research period.
The author expresses her sincere gratitude and heartfelt indebtedness from core of heart to her parents whose blessing, inspiration, sacrifice, and moral support always inspired her to complete the higher study.
The author feels pleasure to convey thanks to her friends and well- wishers specially mentioning Moumita Sarkar, Wasika Afrin & Tanvir Ahmed for their active support and encouragement.
ii
ABSTRACT
A field experiment was conducted at Sher-e-Bangla Agricultural University, Dhaka- 1207, to evaluate combined effect of biochar and phosphorus on growth and yield of wheat under different irrigation regime during November 2019 to March 2020. The experiment was laid out in two factor split plot design with three replications. Irrigation regime under main factor were I0 = Control, I1 = At Crown Root Initiation (CRI), I2 = At CRI +Flower Initiation (FI) stage, I3 =At CRI+FI+ Grain Filling (GF) stage and four different combinations of biochar and phosphorus doses were in sub factor viz., BP0= 5 ton Biochar ha-1, BP1 =5 ton Biochar + 20 kg Phosphorus ha-1, BP2=5 ton Biochar +15 kg Phosphorus ha-1, BP3 =20 kg Phosphorus ha-1. There were 16 treatment combinations.
The tallest plant (100.16cm), maximum number of tiller (5.64), highest leaf length (16.92cm), maximum ear plant-1 (5.36), highest ear length (14.86cm), maximum spikelet spike-1 (17.76), highest grains spike-1 (50.77), highest 1000-grain weight (47.86g), highest grain yield (3.67tha-1), highest straw yield (4.03tha-1), highest biological yield (7.71tha-1) and harvest index (47.75%) were obtained from I2BP2 (Irrigation at CRI +FI stage and 5 ton biochar +15 kg phosphorus ha-1). It can be concluded that treatment I2BP2
is recommendable for improved wheat production.
iii
LIST OF CONTENTS
CHAPTER TITLE PAGE
ACKNOWLEDGEMENTS
iABSTRACT
iiLIST OF CONTANTS
iii-viLIST OF TABLES
viiLIST OF FIGURES
viiiLIST OF APPENDICES
ixLIST OF ABBRVIATION
x1 INTRODUCTION
1-32 REVIEW OF LITERATURE
4-252.1 Effect of biochar on plant growth and yield 4-13 2.2 Effects of phosphorus on plant growth and
yield
13-17 2.3 Effect of irrigation on plant growth and
yield
17-25
3 MATERIALS AND METHODS
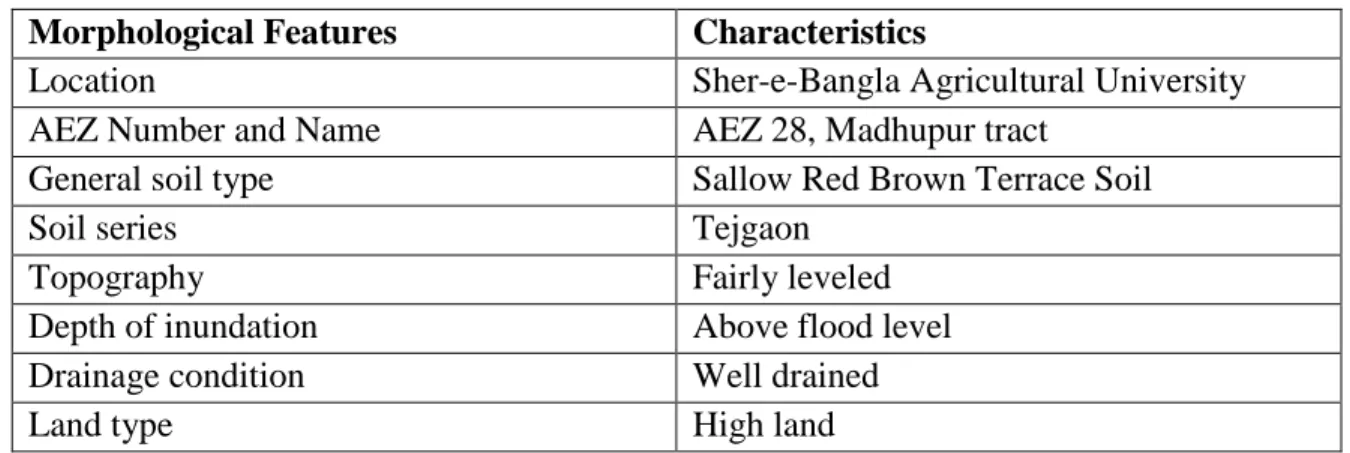
26-353.1 Experimental site 26
3.2 Description of the location 26
3.2.1 Geographical Location 26
3.2.2 Agro-Ecological Region 27
3.3 Climatic condition 27
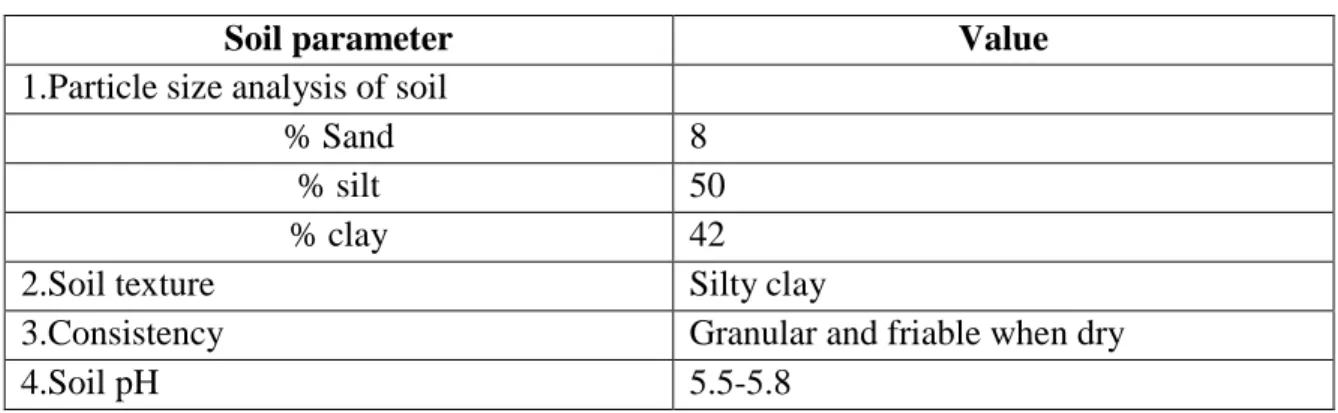
3.4 Description of soil 27
3.5 Treatments of the experiment 28
3.5.1 Factor A: Level of irrigation 28 3.5.2 Factor B: Biochar and Phosphorus (P)
management
29
3.5.3 Treatment combination 29
3.6 Experimental Design and Layout of the experiment
29
3.7 Seed collection 29
3.8 Preparation of the experimental site 30
3.9 Application of fertilizer 30
3.10 Application of Biochar 31
3.11 Sowing of seeds 31
3.12 Intercultural operations 31
3.12.1 Thinning and Weeding 32
3.12.2 Irrigation 32
3.12.3 Protection against Insects and Pathogens 32
iv
CONTENT (Cont’d)
CHAPTER TITLE PAGE
3.13 Harvesting and Postharvest operations 32
3.14 Recording of data 33
3.15 Growth Parameters 33
3.15.1 Plant height 33
3.15.2 Number of tillers hill-1 33
3.15.3 Leaf length 33
3.16 Yield Parameters 33-35
3.16.1 Number of ear plant-1 33
3.16.2 Spike length 34
3.16.3 Number of Spikelet spike-1 34
3.16.4 Number of grains spike-1 34
3.16.5 Weight of 1000-grains 34
3.16.6 Grain yield 34
3.16.7 Straw yield 34
3.16.8 Biological yield 35
3.16.9 Harvest index 35
4 RESULTS AND DISCUSSIONS
36-704.1 Growth parameters 36-45
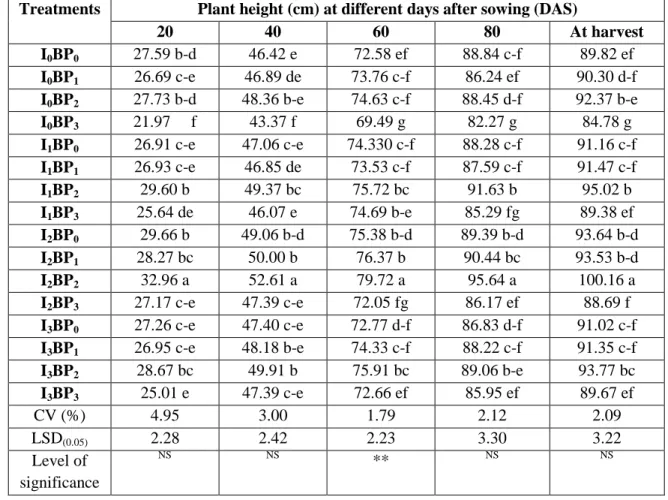
4.1.1 Plant height 36
4.1.1.1 Effect of irrigation 36
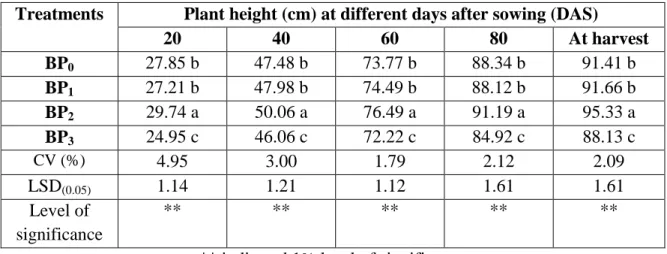
4.1.1.2 Effect of biochar and phosphorus 37 4.1.1.3 Interaction effect of irrigation with biochar
and phosphorus
38
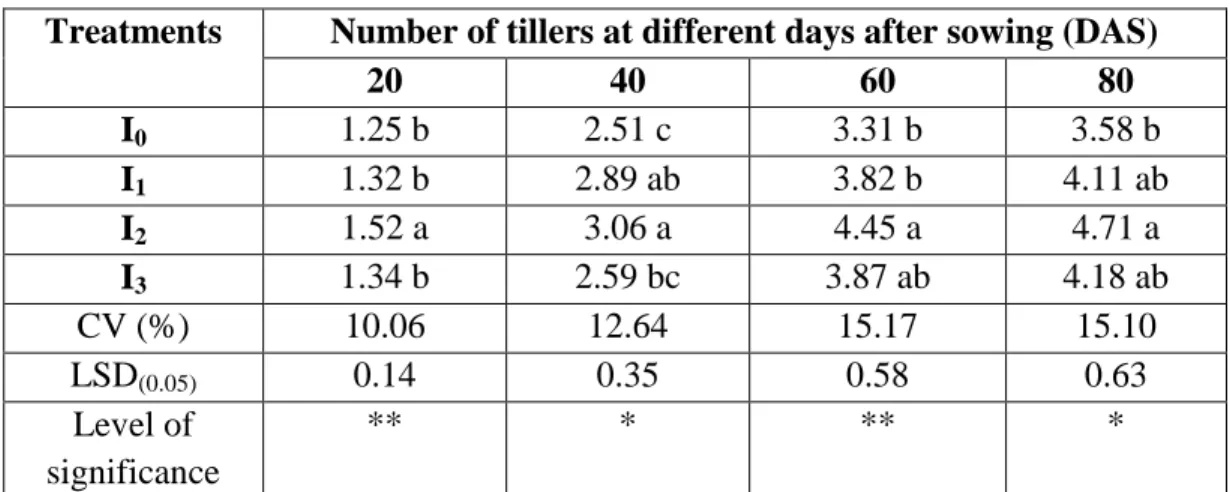
4.1.2 Number of tillers hill-1 40
4.1.2.1 Effect of irrigation 40
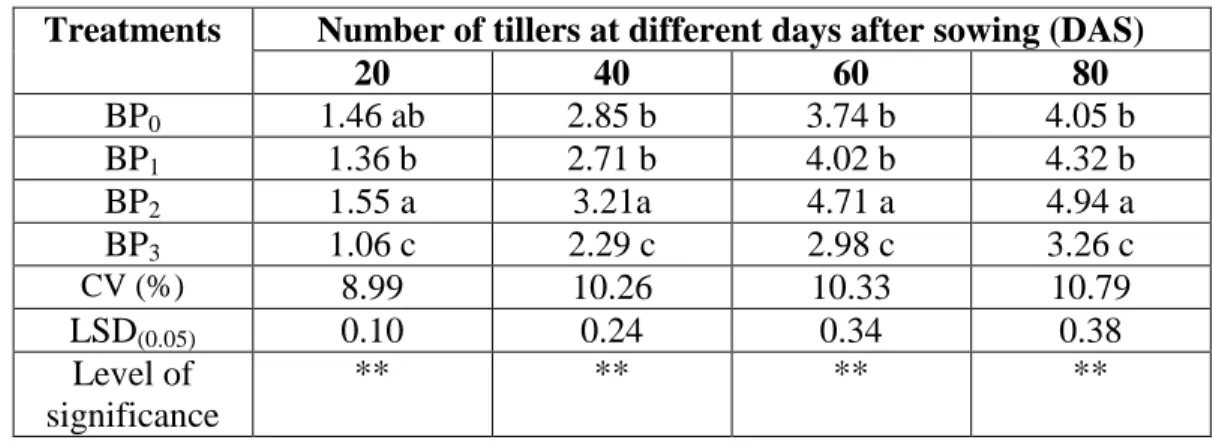
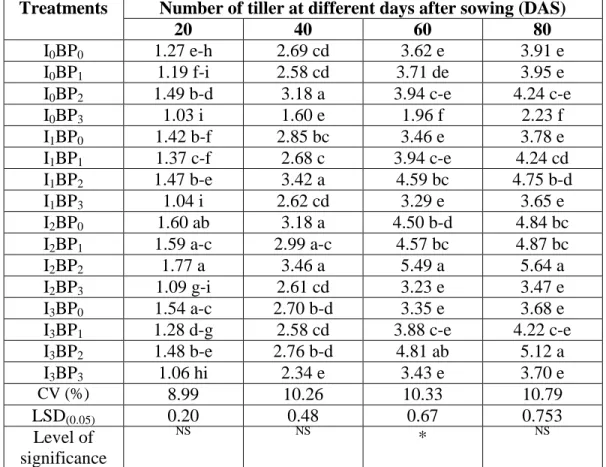
4.1.2.2 Effect of biochar and phosphorus 41 4.1.2.3 Interaction effect of irrigation with biochar
and phosphorus
42
4.1.3 Leaf length 44
4.1.3.1 Effect of irrigation 44
4.1.3.2 Effect of biochar and phosphorus 45 4.1.3.3 Interaction effect of irrigation with biochar
and phosphorus
45
4.2 Yield Parameters 46-70
4.2.1 Number of ear plant-1 46
4.2.1.1 Effect of irrigation 46
4.2.1.2 Effect of biochar and phosphorus 47
v
CONTENT (Cont’d)
CHAPTER TITLE PAGE
4.2.1.3 Interaction effect of irrigation with biochar and phosphorus
48
4.2.2 Spike length 48
4.2.2.1 Effect of irrigation 48
4.2.2.2 Effect of biochar and phosphorus 49 4.2.2.3 Interaction effect of irrigation with biochar
and phosphorus
50
4.2.3 Number of Spikelet spike-1 51
4.2.3.1 Effect of irrigation 51
4.2.3.2 Effect of biochar and phosphorus 52 4.2.3.3 Interaction effect of irrigation with biochar
and phosphorus
53
4.2.4 Number of grains spike-1 53
4.2.4.1 Effect of irrigation 53
4.2.4.2 Effect of biochar and phosphorus 54 4.2.4.3 Interaction effect of irrigation with biochar
and phosphorus
55
4.2.5 Weight of 1000-grain 57
4.2.5.1 Effect of irrigation 57
4.2.5.2 Effect of biochar and phosphorus 58
4
4.2.5.3 Interaction effect of irrigation with biochar and phosphorus59
4.2.6 Grain yield 59
4.2.6.1 Effect of irrigation 59
4.2.6.2 Effect of biochar and phosphorus 60 4.2.6.3 Interaction effect of irrigation with biochar
and phosphorus
61
4.2.7 Straw yield 62
4.2.7.1 Effect of irrigation 62
4.2.7.2 Effect of biochar and phosphorus 63 4.2.7.3 Interaction effect of irrigation with biochar
and phosphorus
64
4.2.8 Biological yield 64
4.2.8.1 Effect of irrigation 64
4.2.8.2 Effect of biochar and phosphorus 65 4.2.8.3 Interaction effect of irrigation with biochar
and phosphorus
66
vi
CONTENT (Cont’d)
CHAPTER TITLE PAGE
4.2.9 Harvest index 68
4.2.9.1 Effect of irrigation 68
4.2.9.2 Effect of biochar and phosphorus 69 4.2.9.3 Interaction effect of irrigation with biochar
and phosphorus
69
5 SUMMARY AND CONCLUSION 71-75
REFERENCES 76-88
APPENDICES 89-98
vii
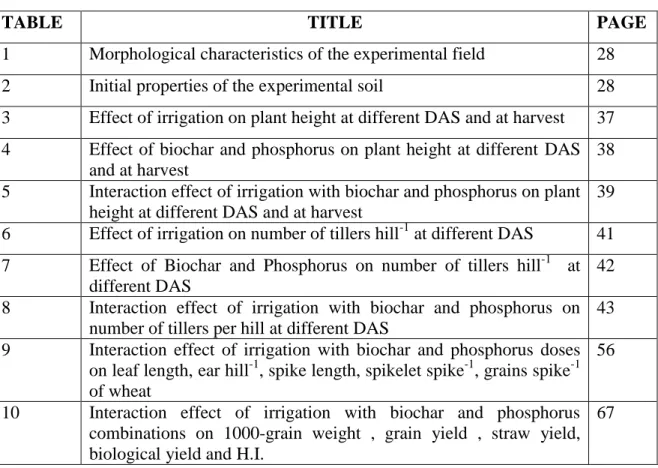
LIST OF TABLES
TABLE TITLE PAGE
1 Morphological characteristics of the experimental field 28
2 Initial properties of the experimental soil 28
3 Effect of irrigation on plant height at different DAS and at harvest 37 4 Effect of biochar and phosphorus on plant height at different DAS
and at harvest
38 5 Interaction effect of irrigation with biochar and phosphorus on plant
height at different DAS and at harvest
39 6 Effect of irrigation on number of tillers hill-1 at different DAS 41 7 Effect of Biochar and Phosphorus on number of tillers hill-1 at
different DAS
42 8 Interaction effect of irrigation with biochar and phosphorus on
number of tillers per hill at different DAS
43 9 Interaction effect of irrigation with biochar and phosphorus doses
on leaf length, ear hill-1, spike length, spikelet spike-1, grains spike-1 of wheat
56 10 Interaction effect of irrigation with biochar and phosphorus
combinations on 1000-grain weight , grain yield , straw yield, biological yield and H.I.
67
viii
LIST OF FIGURES
FIGURE TITLE PAGE
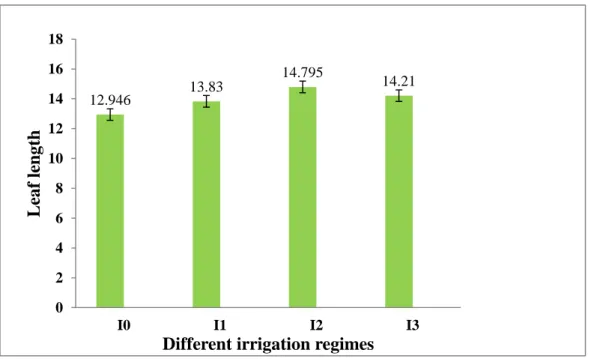
1 Sowing material BARI Gom 30 30
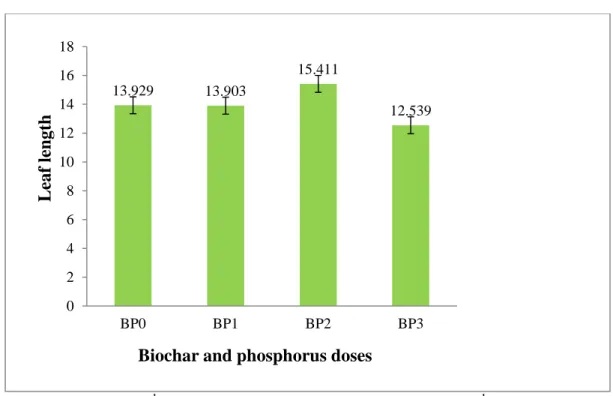
2 Effect of different irrigation regime on leaf length of wheat plant 44 3 Effect of biochar and phosphorus on leaf length of wheat plant 45 4 Effect of different irrigation regime on number of ear plant-1 of
wheat
46 5 Effect of biochar and phosphorus doses on number of ear plant-1 of
wheat
47 6 Effect of different irrigation regime on spike length of wheat plant 49 7 Effect of biochar and phosphorus on spike length of wheat 50 8 Effect of irrigation on number of spikelet spike-1 51 9 Effect of biochar and phosphorus on number of spikelet per spike-1 52 10 Effect of irrigation on grain per spike-1 of wheat 54 11 Effect of biochar and phosphorus on number of grain spike-1 55 12 Effect of different irrigation regime on 1000-grain weight 57 13 Effect of biochar and phosphorus doses on 1000-grain weight of
wheat
58 14 Effect of different irrigation regime on grain yield of wheat 60 15 Effect of biochar and phosphorus on grain yield of wheat 61 16 Effect of different irrigation regime on straw yield of wheat 62 17 Effect of biochar and phosphorus on straw yield of wheat 63 18 Effect of irrigation on biological yield of wheat 65 19 Effect of biochar and phosphorus on biological yield of wheat 66
20 Effect if irrigation on harvest index 68
21 Effect of biochar and phosphorus on harvest index of wheat 69
ix
LIST OF APPENDICES
APPENDIX TITLE PAGE
1 Effect of biochar and phosphorus on spike and grain after harvest
89
2 Effect of irrigation on grain and straw yield 90
3 Effect of biochar and phosphorus doses on grain and straw yield 90
4 Split-plot ANOVA Table for Plant height at 20 DAS 91
5 Split-plot ANOVA Table for Plant height at 40 DAS 91
6 Split-plot ANOVA Table for Plant height at 60 DAS 91
7 Split-plot ANOVA Table for Plant height at 80 DAS 92
8 Split-plot ANOVA Table for Plant height at harvest 92 9 Split-plot ANOVA Table for No of tiller hill-1 at 20 DAS 92 10 Split-plot ANOVA Table for No of tiller hill-1 at 40 DAS 93 11 Split-plot ANOVA Table for No of tiller hill-1 at 60 DAS 93 12 Split-plot ANOVA Table for No of tiller hill-1 at 80 DAS 93
13 Split-plot ANOVA Table for Leaf length (60 DAS) 94
14 Split-plot ANOVA Table for ear hill-1 94
15 Split-plot ANOVA Table for spike length 94
16 Split-plot ANOVA Table for Spikelet spike-1 95
17 Split-plot ANOVA Table for No of grain spike-1 95
18 Split-plot ANOVA Table for 1000 grain weight 95
19 Split-plot ANOVA Table for Grain yield 96
20 Split-plot ANOVA Table for Straw yield 96
21 Split-plot ANOVA Table for Biological yield 96
22 Split-plot ANOVA Table for Harvest Index 97
23 Agro Ecological Zone (AEZ) of Bangladesh 98
x
LIST OF ABBRVIATION
ABBREVIATION FULL WORD
AEZ Agro Ecological Zones
BARI Bangladesh Agricultural Research Institute BARC Bangladesh Agricultural Research Council BBS Bangladesh Bureau of Statistics
cm Centi-meter
CRI Crown Root Initiation
CEC Cation Exchange Capacity
CV% Percent Coefficient of Variance
cv Cultivar (s)
0C Degree Celsius
DAS Days After Sowing
et al. And others
e.g. For example, exampli gratia (L)
etc Etcetera
FAO Food and Agricultural Organization
FI Flower Initiation
g Gram (s)
GF Grain Filling
HI Harvest Index
i.e. that is, id est (L)
kg Kilogram
kg ha-1 Kilogram per hectare
K Potassium
LSD Least Significant Difference
MS Master of Science
m Meter
m2 Meter square
MoP Muriate of Potash
N Nitrogen
P Phosphorus
NS Non-significant
No Number
OM Organic Matter
pH Hydrogen ion concentration
% Percent
SAU Sher-e-Bangla Agricultural University
var. Variety
TSP Triple Super Phosphate
t ha-1 Ton per hectare
1
CHAPTER I INTRODUCTION
Wheat is an important cereal crop considered one of the most important staple foods throughout the world. It is the third largest cereal production in the world after maize and rice (FAO, 2020). Worldwide total wheat production during the year 2019-2020 is 763.93 million metric ton. According to USDA, 100 g of wheat provides 327 kilocalories and source of essential nutrients. In contains 12% water, 70% carbohydrates, 12% protein, 2% fat, 1.8% minerals and 2.2% crude fibers. Small amount of thiamin, riboflavin, niacin, and vitamin A are present, but most of those nutrients are removed with the bran and germ through milling process.13% protein content is mostly gluten (Shewry et al., 2002). About 70% of produced wheat is used as food, 17 % for animal feed and 13 % in industrial used.
In Bangladesh among the other cereal crops, wheat production is next to rice. It contributes to the national economy of our country by reducing the volume of import of cereals for fulfilling the food requirements (Razzaque et al., 1992) but its total production is not sufficient enough to feed the increasing population as the yield is very low.
Bangladesh has become highly dependent on wheat imports while dietary preferences are changing such that wheat is becoming a highly desirable food supplement to rice. Over 80 percent of Bangladesh’s wheat consumption is fulfilled by imports. In 2018-2019 wheat production area was estimated up to 330,348 ha and production was estimated at 1,016,811 MT (BBS, 2019). The amount was decreased almost 82,562 MT due to the problem of wheat blast, unfavorable weather and lower yield in previous year (Mottaleb et al., 2019). Wheat import was recorded 6.3 MMT during the year 2019-20. There are
2
several reasons that can explain the variation of yield. Both biotic and abiotic factors are responsible for low yield. Among the biotic factors incidence of disease and pests (Hossain et al., 2011), unavailability of high yielding varieties (Rerkasem et al., 1991) are noticeable. Abiotic factors includes high temperature, moisture stress (Binghum, 1966) and nutrient deficiency (Rerkasem et al., 1993; Islam et al., 1997). There are several improved technologies can be used to improve wheat production, use of biochar is one of those.
Biochar is a fine grained charcoal like materials, rich in carbon, produced by the process pyrolysis of biomass at temperatures between 300 °C and 600 °C in absence of oxygen. It is said that biochar can endure in soil for thousands of years (Julie, 2010). It has been noticed that use of charcoal as a fuel replacing wood leads to lower levels of household indoor pollution (Bailis et al., 2005). The application of biochar (charcoal or biomass- derived black carbon) to agricultural soil is proposed as a novel approach to improve soil fertility, improve soil water holding capacity and consequently moisture retention, and to increase crop production of newly reclaimed sandy soil (Bakry et al., 2015). Biochar is a stable form of carbon has complex of physical and chemical properties which make it a potentially powerful soil amendment material (Mutezo, 2013). It can act as a soil conditioner enhances the growth of the plants by supplying and more specifically retaining nutrients and improving soil physical and biological properties and consequently improving soil water holding capacity (Lehmann and Rondon, 2005).
Biochar is produced from a variety of biomass residues (feedstocks) and under different pyrolytic conditions, and thus has varying nutrient contents. For example, in case of
3
biochar produced from feedstocks of animal higher amount of nitrogen and phosphorus in compare to plant origin (Chan and Xu, 2009).
Phosphorus is an essential nutrient for plant development form seedling to maturity stage.
It plays role in uniform heading, quality and formation of seeds, faster maturity and strengthening the plant to survive in winter. Biochar application could be a great practice in order to enhance phosphorus availability in soil. It is said that biochar act as a phosphate adsorbent and a source of available phosphorus for plant (Zhang et al., 2016).
Addition of biochar enhanced wheat yield under different mineral fertilization levels regardless of nitrogen and water stressed conditions (Alburquerque et al., 2013). It improves water holding capacity of soil, build soil organic matter, enhances nutrient cycling and fertilizer requirements (Laird, 2008; Glaser et al., 2007; Novak et al., 2009;
Lehmann et al., 2003).
A lot of research works already been performed in abroad, but the amount of research work done in Bangladesh were inadequate and not conclusive. In view of the above background, the present research work has been taken on biochar application with phosphorus doses under different irrigation in wheat cultivation using the cultivar of BARI Gom-30 with the following objectives:
To monitor the irrigation effect with biochar on wheat.
To analysis the effect of biochar and phosphorus combination on growth and yield of wheat.
To explore the combined effect of different level of biochar and phosphorus under different irrigation regime on growth and yield of wheat.
4
CHAPTER II
REVIEW OF LITERATURE
Wheat is an important cereal crop which gets less attention because of rice crop dependency in our country. Both wheat and Boro rice is winter crop which grows in during Rabi season. Most of the crops grown during this period are mainly irrigated.
Many research works on wheat has been performed specially in South Asia countries for its improvement in growth and yield. A very few studies have been done in our country related to growth, yield and development of wheat due to water stress. The number is not so far adequate and conclusive. This chapter includes results of different researches done both in home and abroad regarding the effect of biochar, phosphorus and irrigation regimes on growth, yield parameter and yield of wheat and other crops.
2.1 Effect of biochar on plant growth and yield
Biochar is now a days an active research topic worldwide for being an opportunity of sustainable agriculture. Its acts as long term sink for carbon and benefits crops. Biochar improves soil moisture holding capacity, reduce the emission of greenhouse gases in soil, increase cation exchange capacity (CEC), reduce nutrient leaching and soil acidity, Experiments proves that it also reduce the requirement of irrigation and fertilizer in soil during crop grown (Laird, 2008; Novak et al., 2009; Brooks et al., 2010). Biochar used as soil amendment to the yield for high potash and elevated pH requiring crops (Lehmann and Joseph, 2009).
5
Biochar (10, 50 and 100 t ha-1) produced from green waste by pyrolysis when applied with and without additional nitrogen application (100 kg N ha-1) no significant difference of radish (Raphanus sativus var. Long Scarlet) yield in absence of N fertilizer with biochar application. But a significant interaction between biochar × N fertilizer was observed (Chan et al., 2008). On the other hand in a separate experiment Brandstaka et al. (2010) proved that there was no significant effect of biochar rates (0, 7 and 15 tons ha-
1).
It was observed that two types of biochar from agricultural wastes typical of Southern Spain: wheat straw and olive tree pruning combined with different level of mineral fertilizer had significant effect on growth and yield of Darum wheat (Triticum durum L.
cv. Vitron). Experiment result showed that biochar had little effect on wheat growth in absence of mineral fertilization to a nutrient poor, slightly acidic loamy sand soil. On the other hand at the highest mineral fertilizer rate, addition of biochar increased grain yield about 20–30 % compared with the use of the mineral fertilizer alone. Both biochar acted as a source of available P leading to beneficial effects for crop production (Alburquerque et al., 2013).
Lahmann and Josheph (2009) stated that biochar has a great impact in soil fertility. Either it add nutrient by itself or can make nutrient available through increasing decomposition of organic matters in soil. Addition of biochar also results larger surface area, increased CEC which prevents leaching thus Eutropication. A significant decrease of nutrient leaching observed after addition of charcoal (Lehmann et al., 2003). Applied fertilizers are adsorbed to the soil surface due to high CEC which causes more nutrient availability
6
for the plant. Incorporation of biochar with same or less amount of fertilizer causes higher yield (Steinbeiss et al., 2009).
It is required to understand the effectiveness of use biochar as biomass recycling in agriculture to improve both crop production and environmental performance. It’s also important to understand its effect on soil nutrients i.e. nitrogen, phosphorus and C storage. It was observed that Nitrogen and Phosphorus use efficiencies in a rice-wheat rotation field consecutive 6 years after soli amendment (20 t ha−1 and 40 t ha−1). Biochar application increased crop (both rice and wheat) root (3–19%), straw (10–19%) and grain (10–16%) biomasses. A significant effect found in grain N use efficiency (20–53%) and P use efficiency (38–230%) compared with N and P fertilization only. Biochar also improved soil organic carbon (26–53%), total N (14–16%) and P (6–19%) compared to N and P fertilization. Improvement of soil carbon storage and nutrient pools (i.e., N, P), promoted root growth, uptake of N and P fertilizers as well as crop production. It proved that biochar application is an effective strategy to increase crop yield, even in the long- term, and is connected not only with the improvement of soil structure and carbon storage but also with increases in nutrient use efficiency (Zhanga et al., 2020).
In Brazil the dark anthropogenic soils known as Amazonian Dark Earths (ADE) refer to black fertile soils called terra preta de Indio (Woods and Denevan, 2009). These rich black earths are highly fertile and produce large crop yields despite the fact that the surrounding soils are infertile (Renner, 2007). Several studies revealed that terra perta was formed about 7000 years ago during Pre Columbian civilization near the bank of Amazon River. Accumulation of charcoal in this soil led to formation of terra preta (Glaser, 2007).
7
Use of saline water for irrigation is essential to mitigate increasing demand of agricultural water in arid and semi-arid regions. It was observed that using straw biochar with saline water irrigation have significant impact on wheat production from experiment conducted in a clay loam soil from eastern China during winter wheat season of 2016-18. There were five treatments of different level of saline water irrigation along with freshwater irrigation. Saline water irrigation alone caused soil salinization and decreased wheat growth and yield. On the other hand incorporation of biochar decreased soil bulk density by 5.5%–11.6% and increased permeability by 35.4%–49.5% thus improved soil nutrient status. Biochar also reduced soil sodium adsorption ratio under saline water irrigation.
Saline water irrigation with biochar application of 10 and 20 t ha−1 significantly increased wheat grain yield by 8.6 and 8.4%, respectively compared to saline water irrigation alone.
Biochar amendment at 10 t ha−1 was resulted as proper practice to facilitate saline water irrigation for wheat production. It was also recommended that high dose of biochar might increase soil salinity and limit N availability (Huang et al., 2019).
Rice husk biochar was used as treatment in four different doses with inorganic fertilizer and lime on two sesame cultivars, named ‘Nishikimaru’ and ‘Gomazou’ in 2015.
Experiment results indicated that plant height, seed yield, and 1000-seed weight were all significantly influenced by biochar application in compared to controlled plot (Wacal et al., 2016).
It was investigated that biochar shows significant effect on maize yield and greenhouse gases (GHGs) in a calcareous loamy soil poor in organic carbon from Henan, central great plain, China. Biochar amendments significantly increased maize production by 15.8% and 7.3% without N fertilization, and by 8.8% and 12.1% with N fertilization
8
under biochar amendment at 20 t ha−1 and 40 t ha−1 respectively. Soil emissions of CO2, CH4 and N2O were monitored and result evaluated that total N2O emission was decreased by 10.7% and by 41.8% under biochar amendment at 20 t ha−1 and 40 t ha−1 compared to no biochar amendment with N fertilization. Biochar amendments also decreased soil bulk density and increased soil total N. The experimental results suggested that application of biochar to calcareous and infertile dry crop lands poor in soil organic carbon will enhance crop productivity and reduce GHGs emissions (Zhang et al., 2012).
Gebremedhin et al. (2015) revealed that biochar can significantly increase grain and straw yields of wheat by 15.7% and 16.5% respectively, over the N and P application (control). Moreover, the root biomass was significantly increased by 20% by applying biochar. This result shows that biochar can retain nutrients and water in soil which improves wheat productivity. Biochar produced from Prosopis juliflora could be used for improvement of wheat production.
It was observed that when biochar was applied in a nutrient-poor, slightly acidic loamy sand soil had little effect on wheat yield in the absence of mineral fertilizers but when applied with the highest rate of mineral fertilization, it produced yield 20–30 % more than mineral fertilizers alone (Alburquerque et al., 2014). In another experiment laid by Liang et al., (2014) evaluated that biochar did not increased annual yield of winter wheat and summer maize in 1st year but the cumulative yield over four growing season was significantly increased by application of biochar in a calcareous soil. Biochar produced from maple was tested at different concentrations for root elongation of pea and wheat but no significant difference was observed due to little effect of biochar in the short-term (Borsari, 2011). Biochar produced from wood chips at 290oC and 7000 C had no effect on
9
growth and yield of either rice or leaf beet (Liang et al., 2014). An experiment proved that biochar significantly increased growth and yield of French bean as compared to no biochar applied to soil (Saxena et al., 2013).
Biochar application can increase crop yields by improving the nitrogen (N) uptake and utilization of added inorganic fertilizers as well as sequestering significant quantities of carbon. Experiment results showed that biochar addition led to significant increase in spring barley grain yield in the first year of biochar application along with improved water utilization. In the second year in case of sunflower production there were no significant effects were found of the previous year’s biochar addition on the yield, N status, fertilizer recovery or any signs of improved water utilization. This experiment concluded suggesting that biochar addition has only slightly positive or neutral effects on crop growth and fertilizer retention but has the potential to higher amount of carbon sequestration in the soil with minimum yield losses in temperate agriculture (Rebecca et al., 2018).
Sustainable rice production in Sierra Leone had some constraints due to soil acidity, low cation exchange capacity (CEC), low nutrient contents accelerated mineralization of soil organic matter and soil loss by erosion for upland. Biochar produced by recycling rice residue showed significant effects on soil physicochemical properties and the early growth characteristics of two rice varieties i.e. NERICA L19 and ROK3. Experimental result evaluated that application of biochar improved available phosphorus, exchangeable cations and cation exchange capacity in biochar treated soils compared to the control soil without biochar. Plant height, tiller number, and dry biomass weight of both rice varieties grown in soils amended with rice straw biochar were significantly higher than untreated
10
soils. The most remarkable increase in plant growth characteristics as a result of biochar addition to soil was reflected in the biomass yield and tiller numbers. Converting rice residues to biochar and applying to soil had a significant improve in rice production of Sierra Leone (Kamara et al., 2015).
A greenhouse experiment was conducted with a view to investigate the effect of biochar produced from cow manure on maize yield, nutrient uptake and physio-chemical properties in dryland sandy soil. Biochar was obtained from dry cow manure pyrolysed at 500°C and mixed with a sandy soil. Result of the study indicated that cow manure had significant effect on maize crop growth. Application of biochar significantly increased maize grain yield as compared with the control. Net water use efficiency (WUE) also increased. Nutrient uptake by maize grain was significantly increased with higher biochar applications. Soil analysis result after the harvesting indicated significant increase in the pH, total C, total N, Oslen-P, exchangeable cations and cation exchange capacity in sandy soil. The results of this study indicated that application of cow manure biochar to sandy soil is not only beneficial for crop growth but it also significantly improved the physio-chemical properties of the coarse soil (Uzoma et al., 2011).
A comparison was done with charcoal and compost on a permeable humid tropic soil in an experiment to determine the influence of on N retention of soil. It was found that soil amended by charcoal enhanced the efficiency of mineral N fertilizer more than the compost amendment. There was a significant recovery difference of 7.2 % between the total N recovered in soils with biochar and the compost amendment. This result indicated an improvement in the fertilizer usage of N, P, and K in soil (Steiner et al., 2008).
11
It was studied that biochar can change the physical and chemical properties of the soil resulting increase of nutrient availability in the soil as well as increases plant root colonization by mycorrhizal fungi (Yamato et al., 2006). Biochar changes emissions of other greenhouse gases from soil such as nitrous oxide (N2O) methane (CH4) (Rondon et al., 2005). Addition of biochar improves plant productivity directly because of its nutrient holding capacity. Lehmann and Joseph (2015) reported significant crop yield benefits from biochar application to soils for various crops and plants in different environments.
Soils of tropical regions are poor in plant available phosphorus resulting in P deficient environments due to presence of sesquioxides which have the ability to sorb phosphate (Turner et al., 2006) in soil creating a sink of inorganic phosphorus for plants (Oberson et al., 2006). Experiments proves that P level increases with the addition of biochar (Novak et al., 2009). This increase caused due to the high concentrations of available P found in the biochar (Chan et al., 2007).
A study result evaluated that the yield of tomato fruit was significantly higher in beds treated with charcoal than without charcoal treatment (Yilangai et al., 2014). It is examined that biochar application increases vegetable yields by 4.7-25.5% as compared to farmer’s traditional practices without biochar (Vinh et al., 2014).
Biochar improves the hydraulic conductivity of top soil. A significant effect was observed in grain yield of upland rice with low phosphorus availability and response to N and P fertilizer treatment. Biochar treatment showed reduced leaf SPAD values indicating that CA without additional N fertilizer application could reduce grain yields in soils with a low indigenous N supply. Experimental result suggested that biochar has the
12
potentiality to improve soil productivity of upland rice production in Laos, but that the effect of biochar is highly dependent on soil fertility and fertilizer management (Asai et al., 2009).
Impact of pecan shell based biochar was investigated on soil fertility of agricultural soil in the Southeastern U.S. which had meager soil fertility due to sandy texture. They come to a conclusion that biochar addition to Norfolk soil shows significant improvement in soil fertility (Novak et al., 2009). Biochar produced from pyrolysis process contains a huge amount of carbon from plant biomass. Application of biochar to soil can trap carbon for a long time even for millennium. It also increase moisture holding capacity of soil, build soil organic matter, enhance nutrient cycling, lower bulk density, act as a liming agent, and reduce leaching of pesticides and nutrients to surface and ground water (Laird, 2008).
Experiment through amendment of two agricultural soil with two biochar produced from the slow pyrolysis of paper mill waste evaluated that both the biochar slightly differed in their liming values (33% and 29% respectively) along with carbon content (50% and 52%
respectively). Both biochar significantly increased N uptake and increased biomass (about 250%) in wheat grown in ferrosol. No significant effect of biochar was found without fertilizers in wheat and soybean while increase biomass in radish found.
Earthworm preference was significantly found in ferrosol over calcarosol with biochar treatment. This study result evaluated that the agronomic benefits for papermill biochar varies for different soil types and crops (Van-Zwieten et al., 2010).
13
Pyrolysis temperature and feedstock type used to produce biochar influence the physicochemical properties of biochar (Conz et al., 2017). Biochar was produced from four different agricultural organic residues: Poultry litter, sugarcane straw, rice hull and sawdust pyrolysed at final temperatures of 350°C, 450°C, 550°C and 650°C. The effect of temperature and feedstock shows differences in pH, electrical conductivity, cation exchange capacity, nutrient content. Results showed that increasing pyrolysis temperature supported biochar stability regardless of feedstock. Animal manure biochar showed higher potential as nutrient source rather than a C sequestration strategy.
2.2 Effects of phosphorus on plant growth and yield
Differences in P uptake and utilization showed significance influence on three different cereal crops i.e. Triticle (Triticale octoploide cv DT-46),its parents wheat (Triticum aestivum L) and rye ( Scale cereal L) under two rates (0 and 60ka ha-1 P2O5). The number of tiller reduction was 13%, 37% and 50% for rye, wheat and triticle respectively for control compared to 60ka ha-1 P2O5 (Renu et al., 2005).
Water stress and low phosphorus availability are the limiting factors for growth and yield of wheat. A significant effect had found for higher dose of phosphorus with optimum irrigation. Stressed at vegetative + reproductive stages had more severe affect in compared to stress at reproductive stage. Plant height, number of tillers, spike length, number of grains spike-1, 1000 grains weight, grain yield and straw yield were reduced for lower rate of phosphorus with water stress. Application of phosphorus at the rate of 120 kg ha-1 under water stress had maximum yield compared to other phosphorus levels (Mumtaz et al., 2014).
14
It is observed that plants grown at low levels of applied P had shown lower growth rates and lower concentrations of phosphate in the shoots in compared to plants grown with high P. Activities of both insoluble and soluble phosphatase increased with P deficiency in the mature leaves but severe nitrogen deficiency had no effect on phosphatase activity.
Soluble phosphatase activities in mature leaves of plants grown under conditions of water deficit rapidly decreased after re watering them. The high soluble phosphatase activities in mature leaves of P deficient wheat prolonged for up to 12 d after the resupply of P to adequate levels (Barrett-Lennard, et al., 1982).
To understand the effect of different phosphate fertilizers on the growth attribute of wheat a pot experiment in green house at during Rabi season was studied. Result evaluated that all the growth parameters of wheat were significantly improved by addition of 80kg ha-1 SSP in compared to TSP, NP and DAP on P deficient soil (Khan et al., 2010). A field trial in alkaline soil in Southern Australia showed significant responses to liquid P in compare to traditional granular form of P (Holloway et al., 2001). Another observation by Baon et al. (1992) proved that phosphorous had a significant impact on various cereal crops growth and yield attributes when application of phosphate fertilizers are done at early growth stages.
Different doses of Phosphorus addition wheat in a saline-sodic silty clay loam and silt loam soils respectively revealed that growth and yield of wheat increased significantly with all different P rates over control in both the soils. The increase in growth and yield was more in silty clay loam than silt loam soils. Results also indicated that maximum grain and straw yields were obtained when 100 kg ha-1 P was applied both the soils. N and P uptake by straw was recorded maximum at 150 kg ha -1 P (Abid et al., 2012).
15
Significant impact was observed for direct and residual effects of phosphate rock (PR) on the growth and yield attributes of wheat (Triticum aestivum L cv. Kanchan) during Rabi season of 2004-2005 under Old Brahmaputra floodplain soils. Effective tillers hill-1 and grains panicles-1 significantly varied with different P treatments. The highest grain yield (3.10 t ha-1) and straw yield (5.54 t ha-1) were found in T3 treatment (Mamun et al., 2012).
A field experiment was conducted during the winter (rabi) season of 2001 at Jobner to study the effect of phosphorus, sulphur and zinc on wheat (Triticum aestivum L emend.
Fiori & Paol). Analysis revealed that the growth parameters, yield attributes, yield, net return and benefit: cost ratio was significantly increased with the application of 40 kg P2O5, 40 kg S and 5 kg Zn ha-1 (Dewal and Pareek, 2004).
To understand the impact of phosphorus application and irrigation scheduling on wheat a field experiment was conducted with four different P fertilizer doses along with four irrigations were applied at different critical stages of wheat. 130 and 65 kg ha-1 N and K was applied as basal dose. Maximum wheat grain yield was observed with 81 kg P2O5 ha-
1 along with three irrigations at critical stage of wheat plant growth. Tillering in wheat plant increased significantly with the increase of phosphorus level (Rahim et al., 2010).
Judicious use of phosphorus was studied on wheat variety Inqlab-91 during winter 2001- 02. Significant result was observed. Maximum germination count and fertile tillers were observed in plots treated with NP 128-84 kg ha-1.Highest dose of phosphorus combined with N, yielded maximum number of grains spike-1, maximum 1000 grainns weight were
16
obtained from plots treated with 128-128 kg NP ha-1. Statistically significant grain yield ha-1 was also increased with higher application of P (Kaleem et al., 2009).
Significant change in grain yield was noticed by the application of phosphorus on crop yields in wheat soybean cropping sequence in acid Alfisols. The soil was amended with lime and gypsum was studied with four levels of phosphorus. Addition of P increased wheat production over control. (Verma et al., 1999).
Phosphorus deficiency has a great impact on crop production especially in rain-fed agricultural conditions. This response significantly influences the balance of all plant nutrients with different root and stem development. An experiment conducted to understand the effects of P fertilization on nutrient composition of both straw and grain for 12 bread and 3 durum wheat varieties, widely cultivated in the Mediterranean Region under rain-fed conditions. Phosphorous fertilization affected the concentration of P, N and Mn in the grain positively, while having negative effect on the concentration of Ca, Mg, Na, Fe, Cu and Zn. In straw, N concentration was not affected by P fertilization.
Different varieties showed different responses to P fertilization in terms of their nutrient composition (Uygur and Sen, 2018).
In order to optimize the doses of Zinc and Phosphorus to maximize wheat productivity in arid region experiment was conducted with three doses of phosphorus and zinc. Results evaluated that that application of P had a positive influence on growth and grain yield of wheat. Highest growth and yield of wheat was recorded at 120 kg ha-1 P2O5 application whereas Zn application did not change in growth or yield of wheat (Hussain et al., 2011).
17
Wheat yield can be limited due to reducing number of ear because of poor emergence of tiller. With an objective to understand the effect of P deficiency on tiller emergence of wheat plant Rodriguez et al. (1999) conducted an experiment on wheat (Triticum aestivum L. cv. INTA Oasis) under drip irrigation on a typic Argiudol having low in P (5.5 μg P g-1 soil) in Balcarce, Argentina. Phosphorus treatments significantly modified the pattern of growth and development of the plants. Leaf photosynthetic rate was reduced by P deficiency and directly altered the normal pattern of tiller emergence by slowing the emergence of leaves on the main stem (i.e. increasing the phyllochron).
Diammonium phosphate (DAP) and triple superphosphate (TSP) as phosphorus (P) sources and r application methods of those had significant effect on the grain yield, yield components and other characteristics of winter wheat (Gokmen and Sencer, 1999). Two cultivars Bezostaja-I and Kirkpinar-79 cultivars were used for experiment. Significant effect was not found for DAP and TSP on the characteristics of wheat but application method significantly affected by showing emergence period, maximum number of plants m-2 and highest grain yield were obtained from application 5 cm below the seed in both years.
2.3 Effect of irrigation on plant growth and yield
It was investigate that different irrigation schedules shows significant effect on growth and yield performance of different varieties of wheat during Rabi season. Three different wheat varieties i.e. Sassui, TD-1 and Rashkoh-2005 was used to evaluate their performance against different irrigation schedules i.e. five irrigations. The results showed that plant height, Spikelet’s spike-1 and seed index differed significantly for different
18
irrigation schedules. The wheat crop irrigated five times showed superior result in compared to four irrigations and three irrigations (Baloch et al., 2014).
An experiment was conducted at Mymensingh to evaluate the effect of irrigation regimes and nitrogen levels on the growth and yield of wheat (Triticum aestivum L cv. Kanchan).
Availability of well distributed soil moisture at different growth stages due to more irrigation shows enhanced growth of plant. Maximum plant height was recorded in 300 mm irrigation treatment and shortest in the control. Ears per plant were significantly increased and followed similar pattern as in the case of ear length and in number of tillers per plant. Maximum number of tiller per plant was produced in 200 mm irrigation treatment which was statistically similar with other irrigation treatments except for the control. Influence of irrigation on grain yield was statistically significant also. Maximum grain yield was obtained in 200 mm irrigation treatment and minimum in control. Straw yield showed the tendency of increasing with the influence of irrigation levels. This is due to the lush in vegetative growth in terms of plant height and number of tillers per plant. The maximum straw yield was obtained with 200 mm irrigation and minimum in control (Shirazi et al., 2014).
A field experiment was conducted by Ranjita et al. (2007) at University of Agricultural Sciences, Dharwad to determine the effect of irrigation schedules, mulching and antitranspirant on growth, yield attributes and economics of wheat. Irrigations scheduled at five critical growth stages resulted in significantly higher grain yield (2545 kg ha-1) over single, two and three irrigations but was on par with four irrigations scheduled at CRI + tillering + late jointing + milk stage. Increase in yield was due to higher number of
19
effective tillers per m-2, number of grains per ear and 1000 grain weight. Plant heights, total dry matter production per m-2 were higher in frequently irrigated treatments.
Islam (1997) in his Ms Thesis reported the plant height increased with the increase of number of irrigation schedule. The maximum plant height was observed by applying three irrigations at 25 DAS, 50 DAS and 75 DAS respectively.
Atikullah et al. (2014) conducted an experiment during November 2012 to March 2013 in experimental field of Sher-e-Bangla Agricultural University, Dhaka, Bangladesh to find out the consequence of different irrigation levels on growth, yield attributes and yield of wheat (BARI Gom-26). Four different irrigations was applied at different growth stages.
Results evaluated that maximum dry matter content (18.8 g plant-1), crop growth rate (CGR) (13.5 g m-2 day-1), relative growth rate (RGR) (0.024 g m-2day-1) were found from two irrigation which was statistically identical with three irrigation whereas minimum from control. Plant height (80.7 cm), number of tiller (4.9/hill), number of spike (4.7/hill), number of spikelets (18.5/spike), spike length (19.2 cm), filled grains (29.3/spike), total grains (31.3/spike), 1000-grains weight (44.4 g), yield (grain 3.4 t ha-1, straw 5.7 t ha-1 and biological 9.1 t ha-1) and harvest index were similarly showed higher results as of growth characters.
A field experiment was conducted for two consecutive winter seasons (2008/09 to 2009/010) to study the effect of different irrigation intervals on growth, yield, yield components and water use efficiency of wheat (Triticum aestivum L.). Wheat cultivar Condor was grown with different irrigation intervals. Parameters i.e. plant height, dry matter accumulation, number of plants m-2, number of tillers plant-1, days to five leaf
20
stages, days to 50% heading, days to maturity, number of spikes m2,spikelets spike-1, number of grains spike-1, 1000-grain weight, grain and straw yield ,water use efficiency and protein% were observed. The results showed significant differences in those parameters due to irrigation intervals, except for days to fifth leaf stage and harvest index in the first season and number of plant/m2 in second season. Irrigation every 7days recorded higher values, slightly different from 10 days. Irrigation every 7 and 10 days gave the highest protein content, grain, straw yield and field water use efficiency. For economics aspect irrigation every 10 days is recommended and irrigation every 21, and 28 days must be avoided under this semi-arid condition (Hwary and Yagoub, 2011).
A field experiment for consecutive three years during winter to evaluated the effect of irrigation scheduling and nutrient management practices on productivity, profitability and nutrient uptake of wheat (Triticum aestivum L. emend. Fiori & Paol) under zero-tillage condition Two irrigation treatment viz. irrigation water: cumulative pan evaporation (IW:
CPE 0.8 and IW: CPE 1.0) and three nutrient-management practices were combined.
Irrigation at CPE of 1.0 significantly increased growth attributes i.e. plant height, leaf- area index and dry-matter accumulation at 90 days after sowing (DAS). Effective tillers/m2, ear length, grains/ear and 1000-seed weight, grain yield, straw yield, N (69.6 and 44.0 kg/ha), P (15.7 and 3.52 kg/ha) and K (20.6 and 153.1 kg/ha) uptake by grain and straw, respectively, protein content (10.5%), net returns (56, 004/ha) was also higher in compare to CPE of 0.8 (Narolia et al. 2016).
It was observed that different irrigation schedules have significant impact on water use and yield of wheat. An experiment was conducted on single variety of wheat and four irrigation intervals in main plot and two pan levels i.e. equal to pan evaporation (P1) and
21
half of pan evaporation (P2) in sub plot. Result showed significant effects of irrigations on yield components viz. grain yield, number of grain per spike, grain weight per spike and number of tillers per plant. Maximum yield was obtained from the treatment irrigation at five weeks interval. Higher moisture content also had effect on tiller emergence (Khan et al. 2007).
Water deficiency during tillering, stem elongation, and grain‐filling growth stages was more sensitive than at dormant stage. Grain yield was significantly decreased (15–91%) when water deficit was at all four growth stages. Supplemental irrigation applied during dormant or grain‐filling stage increased grain yield (12% and 35%, respectively).
Supplemental irrigation at elongation stage increased biomass and N, P, and K uptake in the whole plant. It was observed that water deficiency retarded plant growth and irrigation increased yield of wheat significantly than under control condition (Wang et al.
2002).
A mobile rain shelter experiment was conducted during 2017–2019 growing seasons to investigate the effects of water stress at different growth stages on various traits in winter wheat. Three different limited irrigation treatments were applied. Two year averages showed that no irrigation at the reviving and jointing stages resulted in the highest grain yield (6470 kg ha−1). Post-anthesis biomass, net photosynthetic rate were significantly higher for this treatment than other treatments (Cao et al. 2021).
Mishra and Padmakar (2010) conducted this experiment to study the effect of irrigation frequencies on yield and water use efficiency of different wheat varieties during Rabi seasons. The irrigation treatment combinations comprised of four irrigation levels viz., I1:
22
(one irrigation at CRI stage), I2: (two irrigations-one each at CRI and flowering stages), I3:
(three irrigations: one each at CRI, LT and flowering stages) and I4: (four irrigations: one each at CRI + LT + LJ + ear head formation stages) over three varieties viz. HUW-234, HD-2285 and PBW-154.Increasing of the number of irrigations from 1 to 4 increased various yield contributing characters i.e. effective tillers m-2 , ear length, no. of grains ear-
1. The highest grain yield (40.65 q ha-1) was found with four irrigations was significantly superior over other treatments.
Mugabea and Nyakatawab (2000) experimented over six wheat genotypes (P1, P2, Pote, Deka, Nata and Ruya) grown under three irrigation regimes which were supplying irrigation water according to the crop water requirements, supplying three quarters of the crop water requirements and half of the crop water requirements at each irrigation day.
The result of two years experiment revealed that applying three quarters and half of the crop water requirements resulted in a yield decrease. P2 gave the highest yields and was the least affected by deficit irrigation. On the other hand Deka gave the least decrease in yield when the three-quarters and half water requirements were supplied. Experiment result concluded that more than half the water is required to meet the crop water requirements of wheat.
Two studies were experimented in Hebei, China and one in Baoding in 2006-2007 and the other in Gaocheng in 2007-2008. Four irrigation treatments (W) were combined with 3 nitrogen (N) doses. In 2006-2007 influences of irrigation was significantly higher in W1, W2 and W3 than in W0, but no significant difference among W1, W2 and W3. Maximum grain yield was obtained from W3 and the lowest in W0, and the highest in N1 and the lowest in N0 (Zhao et al. 2009).
23
Water stressed condition shows influence on wheat production. An experiment was carried out to evaluate the performance of yield and yield components of wheat genotypes under water stress conditions. Four wheat varieties were cultivated under water stress conditions having different irrigation treatments during various crop growth stages.
Grain yield and grain yield contributing traits of wheat varieties were significantly affected under water stress conditions. Grain yield was ranged between 373 kg ha-1 in single irrigation treatment to 3931 kg ha-1 in four irrigations (Mangan et al. 2008).
Bian et al. (2016) conducted an experiment to evaluate the effect of irrigation frequency and planting pattern on grain yield and water use efficiency (WUC) of wheat. Two planting pattern wide spaced and conventional planting were treated with three irrigations I1: irrigation (120 mm) at the jointing stage; I2: irrigation (60 mm) at both the jointing and heading stages; I3: and irrigation (40 mm) at the jointing, heading, and milking stages).
Applying 60 mm of water at jointing and heading stages resulted in the highest grain yield among the treatments.
A field experiment was conducted to evaluate the influence of limited and adequate irrigation and moisture conservation practices (rice straw mulch and hydrogel) on yield and water use efficiency in wheat. Maximum wheat yield (3.92 t ha-1) and water use efficiency (15.72 kg ha-1 mm-1) was recorded with four irrigations at crown root initiation stage, tillering, late jointing, and milk stage (Singh et al. 2018).
Chouhan et al. (2017) conducted an experiment on wheat during two consecutive Rabi seasons 2013-15. The experiment consisted of three IW/CPE ratios in main plot, three sowing methods (line sowing, crisscross sowing and FIRB) and three weed control
24
(weedy check, sulfosulfuron + metsulfuron(RM) and isoproturon + 2, 4-D (TM) at 35 DAS) measures in sub plot. IW/CPE ratio at 1.0 showed significant increase in plant height, dry mater accumulation at 60, 90 DAS and harvest and yield of wheat over IW/CPE ratio at 08. IW/CPE ratio at 1.2 and 1.0 gave significantly higher plant height by 8.79 and 5.96, 5.93 and 5.45and 7.92 and 6.05 % over IW/CPE ratio 0.8 level for all sowing method. Irrigation in the crop at IW/CPE ratio 1.0 recorded significantly highest dry matter accumulation at 60, 90 DAS and harvest over IW/ CPE ratio at 0.8.
In order to examine the effect of deficit irrigation on growth and productivity of bread wheat cultivars field experiment was conducted in Egypt, during the winter season 2015- 17 having three irrigation regimes on five wheat cultivars (Sids 13, Gemmeiza 12, Sakha 94 and Misr 2). Plant growth parameters and yield parameters in addition to water productivity (WP) were determined and results showed that skipping irrigation significantly decreased plant growth and yield parameters in both seasons. Wheat plants irrigated five times showed maximum biomass weight, spikes plant−1, spike length, grain weight spike−1, and grain yield as compared to skip 2nd irrigation and skip 3rd irrigation.
They concluded with statement that of full irrigations proved optimum for obtaining maximum grain yield and skipping 2nd irrigation treatment proved maximum water productivity with wheat cultivars (El-Gabry and Hashem 2018).
Different levels of supplemental irrigation regimes was implemented on four wheat (Triticum aestivum L.) genotypes in order to assess the effect of deficit irrigation pattern on yield traits performance and to determine most suitable genotype for local semi-arid conditions. The experimental result showed that supplemental irrigation improved the investigated genotypes yield (Aissaoui and Fenni, 2021).
25
In the semi-arid area of Pakistan an experiment was conducted to estimate the impact of number of irrigations on yield of wheat having three different irrigation treatments. The experimental result revealed that the grain yield and yield contributing parameters were significantly higher when crop was irrigated five irrigations. The highest grain yield was also recorded with five irrigations at different critical growth stages of wheat crop. They expressed that the possible reason might be availability of more moisture. Application of irrigation at tillering stage played a vital role to increase wheat yield and whereas irrigation at maturity caused decrease in wheat yield (Malik et al. 2010).
26
Chapter III
MATERIALS AND METHODS
The experiment was conducted at the experimental field of Sher-e-Bangla Agricultural University, Dhaka during the period from November 2019 to March 2020 to observe the combined effect of Biochar and Phosphorus and different irrigation regime on growth and yield of wheat. This chapter contains a description of location of experimental plot, climatic variations, soil properties, treatments of the experiment, information of seeds, land preparation, experimental design used for this experiment, intercultural operations done during the work, fertilizers and pesticides used, data collection and analytical methods followed in this experiment. The details of this research methodology are given below:
3.1 Experimental site
The research work was conducted at the Sher-e-Bangla Agricultural University farm, Sher-e-Bangla Nagar, Dhaka during Rabi season of 2019 in the month of November.
3.2 Description of the location 3.2.1 Geographical Location
The experiment site was situated at 23077ˈ N