INVESTMENT STRATEGIES AND RISK AVERSION OF MASTER OF BUSINESS ADMINISTRATION ("MBA") STUDENTS AT THE UNIVERSITY OF KWAZULU-NATAL ("UKZN"). Empirical research findings show that respondents are indeed risk averse in their investment strategies.

GLOSSARY OF TERMS
Introduction Background
- Problem Statement and Importance of Study
- Research Objectives
- Literature Review
- Decision-making and investing
- Decision-making and risk-taking
- Other empirical studies related to the problem statement
- Information relating to the UKZN
- Elimination of problems solved by other researchers
- Conclusion
- Population and Sampling
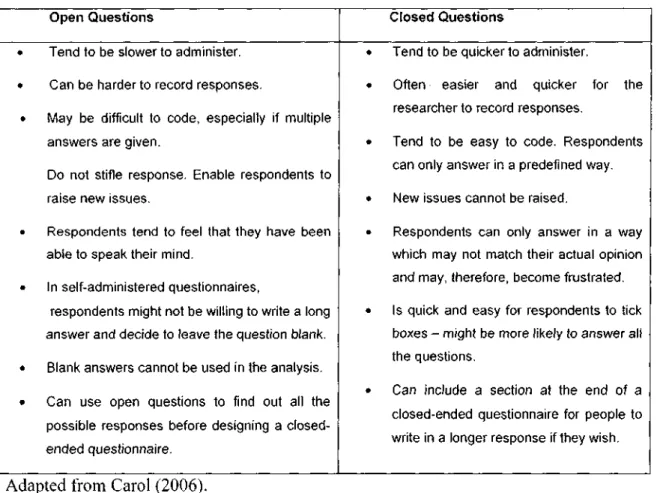
- Research Instrument
- Questionnaire Construction
- Variables
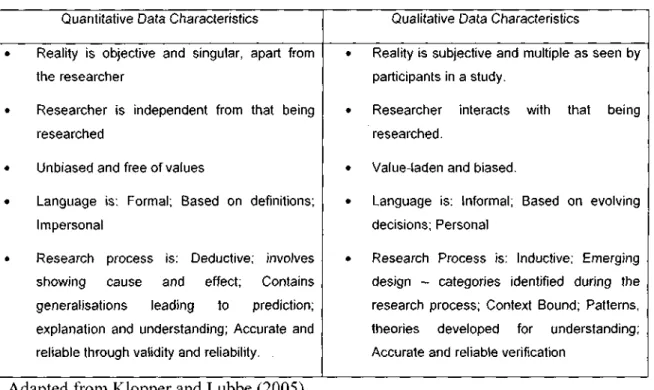
- Quantitative techniques and scales
- Validity and Reliability
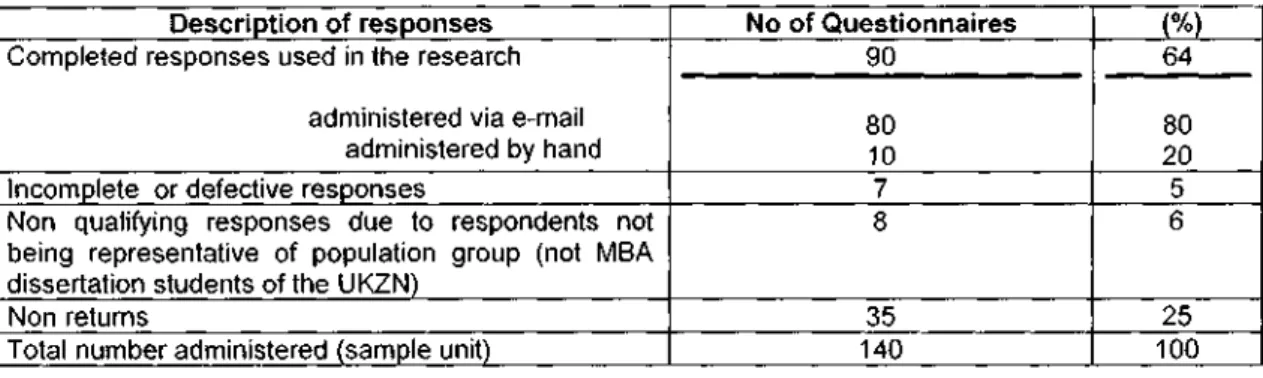
- Methods for administering and collecting primary data
- Analysis and statistics
- The questionnaire to be used in this study 1. Developing the questions
- Introductory message
- Actual questionnaire for distribution
- Conclusion
This study will focus on the dynamics influencing risk aversion in the investment strategies of UKZN MBA dissertation students. The second objective of the study is to prove that students are risk-averse.
Presentation of the findings of the empirical research
- Introduction
- Descriptive statistical analysis of respondent data
The purpose of the research is to explore the investment strategies of UKZN MBA students. Participants in this study were asked to indicate the number of adults and dependents in their homes. This question is part of a series of questions aimed at finding out what type of investments MBA thesis students have.
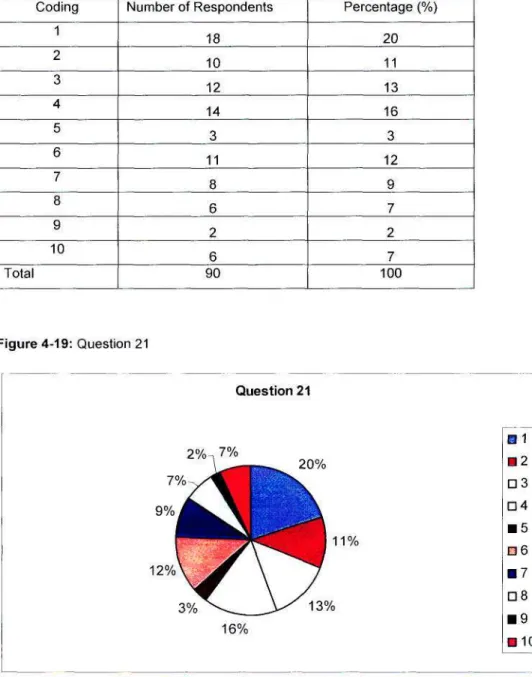
Therefore, the basis for the objective of investing in a pension fund is not always a choice. The likelihood that the participants invest in mutual funds is summarized in the table below, where point 1 indicates that the respondent is very likely to have a point ten, indicating that the respondent in question is very unlikely to invest in mutual funds:.
I MbT—~~~7
This question was asked to understand whether the amount of respondents' investments depends on the number of dependent family members (children, sick elderly, disabled, etc.) of the respondents. The attitude of the respondents towards increasing the number of investments is summarized in the table below, where point 1 indicates that the respondent is very likely to increase the number of investments if he had more children, to point 10 that it is very unlikely that the respondent would increase the number of investments , if you have several dependent family members (dependents are not a limitation). Respondents' attitudes towards the level of caution (or risk) based on income are summarized in the table below, where item 1 indicates that the respondent strongly agrees that he or she will be less cautious if his or her income increases (less risk averse). , to point 10, which indicates that the respondent does not agree that he will not be less careful if his income increases (more risk averse).
The respondents' attitude to an increase in the number of investments is summarized in the table below, where point 1 indicates that the respondent would very likely increase the number of investments if he or she got a new job, to point 10 indicating that it is very unlikely that the respondent would increase the number of investments if he or she got a new job (job is not a constraint). This data as illustrated graphically in Figure 4-23 below, indicating that more respondents would increase the number of their investment if they got a new job.
HBT^^ /
Comparison statistics of respondent data
The table above reveals the comparative descriptive results of the UKZN MBA Dissertation Students) criteria for meeting the criteria by gender. The table above reveals the comparative descriptive results of net monthly household income by gender. The table above reveals the comparative descriptive results of adult household composition by gender.
The above table reveals the comparative descriptive results of the dependent composition of the surveyed households by gender. Q16: I would not invest in a pension fund if it was not mandatory in my workplace.
Inferential statistics of the respondent data
- Reliability Statistics - Cronbach Alpha Test
- Conclusion
- Analysis, Interpretation and Limitations of the Findings
- Introduction
- Analysis of empirical findings 1. Demographic Responses
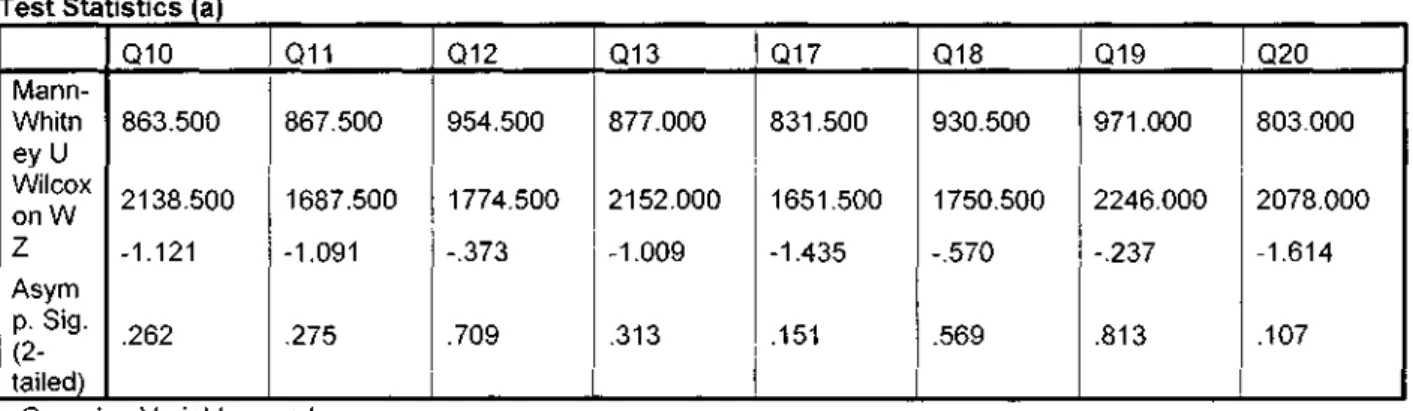
The analysis is to see if there is any statistically significant difference in the attitude of the respondents. As the p-value is greater than 0.10 and 0.05, there is no statistically significant difference between the study variables, with question 10 (age) being the exception where there are significant differences. In the tables (below) where the probability value (shown in the last column) is less than or equal to 0.05 (p< 0.05), there is a significant difference in respondents' attitudes based on their gender (question 9).
Where the probability value is greater than 0.05 (p> , 0.05), there is no significant difference in the attitudes of respondents between different groups of professions (all questions except question 9). In this chapter, there is an analysis of the findings obtained from the summary answers of the respondents.
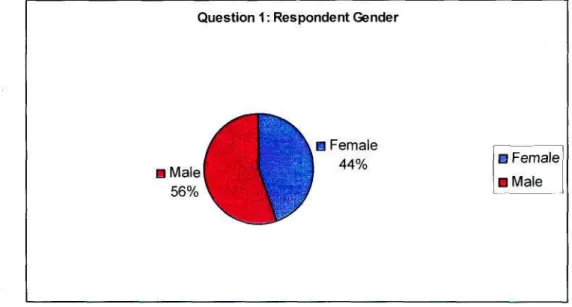
Gender
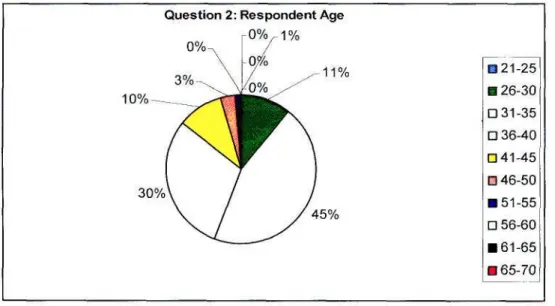
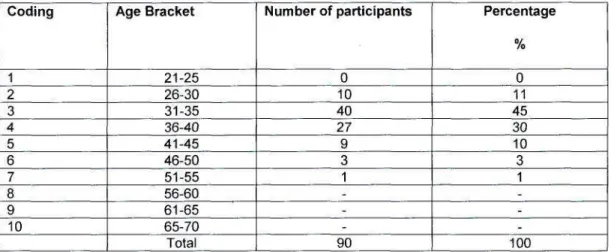
An analysis of the demographic information was undertaken to understand the profile of the respondents.
UKZN MBA 3 students
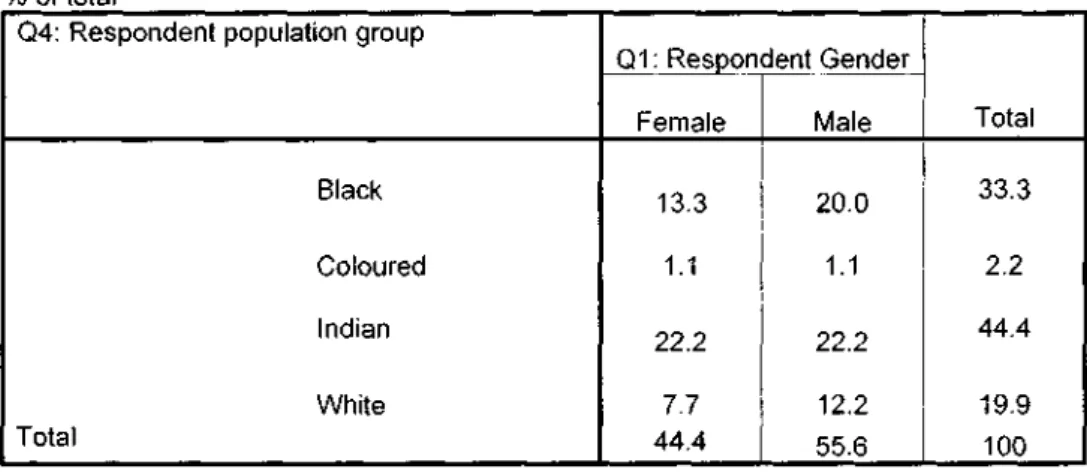
Population Group
Vocation
Household Income
Wealth
Household Composition
- Objective 1: To identify the factors that indicates risk aversity Preferences
- Objective 2: To prove that the students are risk averse
- Internal Validity and Reliability
- Interpretation of empirical findings
The above variables were analyzed with each of the demographic variables to understand how their expectations may be factors that indicate respondents' risk aversion. While the percentage of respondents who choose options 1 and 2 decreased with increasing age. The higher the respondent's income, the more they were inclined to reduce the amount of their investment.
The demographic data were analyzed in terms of the variables related to the respondents' disabilities using inferential statistical tests. In subsections 5.2.2 and 5.2.4, all variables mentioned below were analyzed with the demographic variables to confirm whether respondents' views were limited to a particular demographic profile.
Overall Risk and Constraints)
Twenty-seven respondents (options 1 to 4) felt that if they were to make their own decisions it would impact their level of risk, implying that having someone else make decisions on their behalf is a limitation in terms of the higher degree of risk they run. would have taken if they had acted themselves. Most respondents (56%) indicate that they would rather engage an investment broker than take a risk based on their own judgment. Of the total, 10% strongly disagreed (option 10) and 13% chose option 9 because they would prefer to invest themselves.
Female and male respondents were of the same opinion, among which the majority of women chose options 7 and 8 compared to men. This indicated that the majority of respondents were risk averse, with higher levels of risk aversion among women, and that the use of intermediaries may have reduced risk aversion.
When asked if they would rather take their investment risk than use an investment broker, 15% (8% female and 7% male) chose option 6, indicating that it did not matter who made the decision. investment. This showed that more respondents preferred not to risk making decisions for themselves, although more men felt strongly about this. Twenty-one percent (21%) of the respondents chose option 1, 9% chose option 2, and 16% chose option 3, indicating their preference to invest in the stock market, which is a risky investment.
The above illustrates that several respondents initially preferred the safer choice of a property investment and were then willing to take a greater risk on the stock market. On average, only 20% of respondents were indifferent or unsure (options 5 and 6) about their preferences for each of the choices.
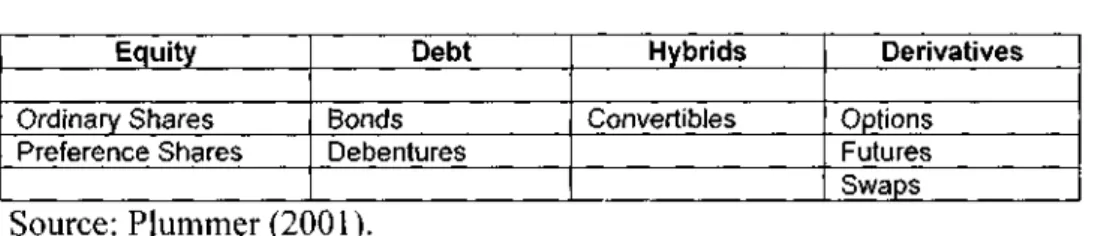
This shows that women preferred a safer option and were more risk averse in light of the decisions they made. On the question of choosing private and public shares, more men than women (2% more) chose the shares of a public company. The expectation of the respondents to have direct control over the investment vehicle (in terms of guaranteed returns with low risk) implied that the type of vehicles and the expectation of the respondents were both factors that indicated the extent of risk aversion.
Regarding the extent of their agreement, there was a preference in each of the combined options of 1 and 2 and the combined options of 3 and 4. However, this percentage was slightly more in terms of the women's choice of unit trusts.
Overall, the findings indicated that more male respondents preferred unit trusts as an investment vehicle, and showed that female respondents were slightly more risk averse to the unit trust market. In general, the preference for a volatile, risky, short-term investment is a factor that indicates less risk aversion. However, the uncertainty expressed by the respondents regarding unit trusts pointed to their lack of preference for volatile, risky and short-term investments and their lack of risk tolerance.
Eleven percent of respondents choose option 6, which indicates uncertainty, but leans towards disagreement rather than agreement. It is inferred that the respondents' goals for insurance are purely investment purposes.
Seven percent (out of 10) of respondents indicated that they would definitely spend less in their future investment decisions. A total of 37% (options 6 to 10) of respondents indicated that they will reduce their investments as they get older. Most respondents (10%) chose option 2, indicating that their propensity to invest would increase if they had more children or dependent family members.
The above showed that more respondents were willing to take risks (not be cautious) in their investment strategies if their income had increased than those who were not willing to take risks (prudent). More respondents believed they would have increased the number of their investments if they had gotten new jobs than those who did.
22% of respondents who chose option 5 tended to be likely, and 8% of respondents who chose option 6 tended to be unlikely. This indicated that a significant number of respondents did not consider their jobs as a factor in the number of investments they held.
- Interpretation of findings in relation to literature reviewed
- Limitations of the study
- Conclusion
- Conclusions and Recommendations 1. Conclusions
- Recommendations for future study
- Bibliography
This proved that the majority of the respondents were risk averse with a greater degree of risk aversion among the females. The findings indicated that fewer of the respondents were unsure (they chose options 5 and 6) in their choice of pension funds. More of the respondents were willing to take risks in their investment strategies if their income increased.
More respondents would increase the amount of their investments if their income doubled. Therefore, it is concluded that the income was the limitation of the monetary amount of the investment.
ADDENDA
Research instrument Research
Concept Matrix
Ethical Clearance
Concept matrix: Investment strategies and related risk aversion in MBA students at UKZN. Concept matrix: Investment strategies and related risk aversion of MBA students in UKZN Town. Concept matrix: Investment strategies and related risk aversion in MBA students at UKZN Mason.
Concept matrix: Investment strategies and associated risk of MBA students at UKZN USA. Concept matrix: Investment strategies and associated risk of MBA students at UKZN Atlas Printers.
UNIVERSITY OF
KWAZULU-NATAL