The work supervised by Professor D. Coquelet has been submitted to fulfill the academic requirements for the degree of Master of Science in Engineering at the School of Engineering, University of KwaZulu-Natal, Durban. The VLE data measurements for the system of propan-1ol + water and propan-1ol + diisopropyl ether (DIPE and 373.15 K ) were performed using a dynamic distillation by Lilwanth (2011) with a test system (ethanol + cyclohexane at 40 kPa) made prior measurements to confirm the accuracy of the method and apparatus. The phase equilibrium behavior (VLE and LLE) for furan + n-hexane and furan + methylbenzene, furfural + n-hexane and furan + water was determined to be 101.3 kPa.
Review of Ethers, Alcohols and Biofuel Constituents
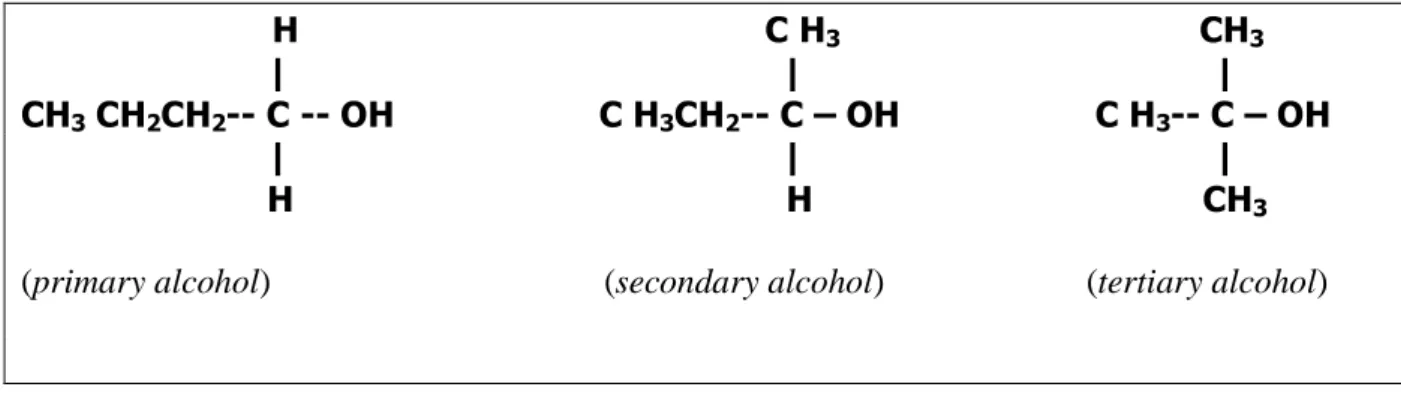
- Alcohols
- Uses of Alcohols
- Hydrogen Bonding in Alcohols
- Solubility of Alcohols in Water
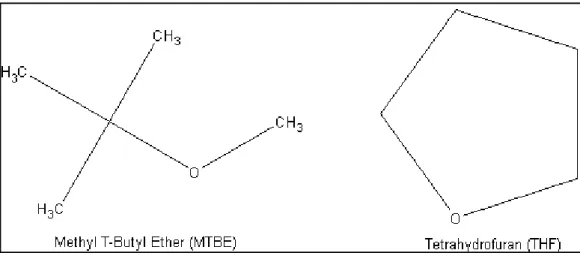
- Ethers
- Uses of Ethers
- Solubility of Ethers in Water
- Biofuels and its Constituents
- Uses of Furfural
- Uses of Furan
Background of Azeotropic Distillation and Propan-1-ol Dehydration Process
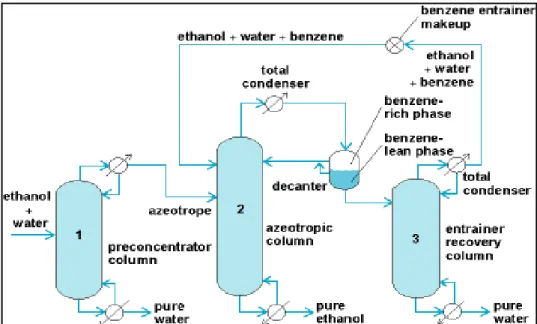
- The Azeotropic Distillation
- The Propan-1-ol Dehydration Process
Phase equilibrium behavior
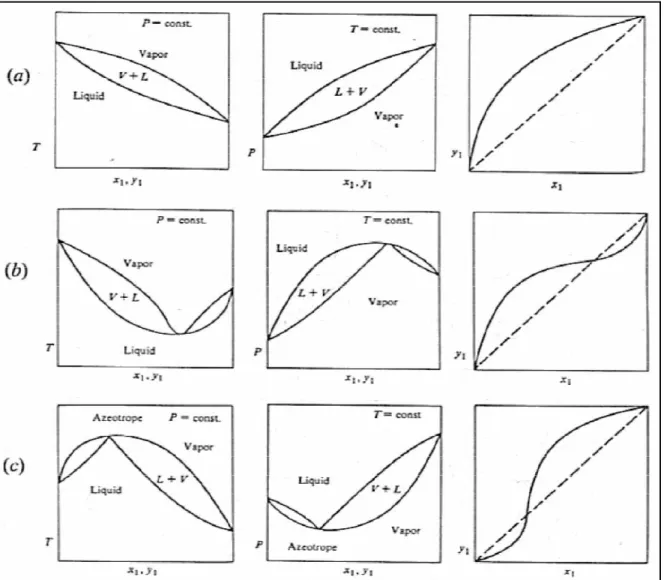
- Vapour liquid equilibrium Diagrams
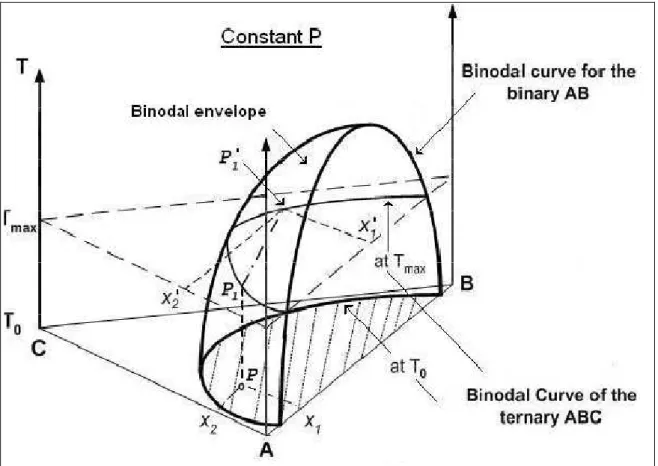
- Liquid-liquid equilibrium Diagrams
Criterion for Phase Equilibrium
Fugacity and fugacity coefficient
Activity and activity coefficients
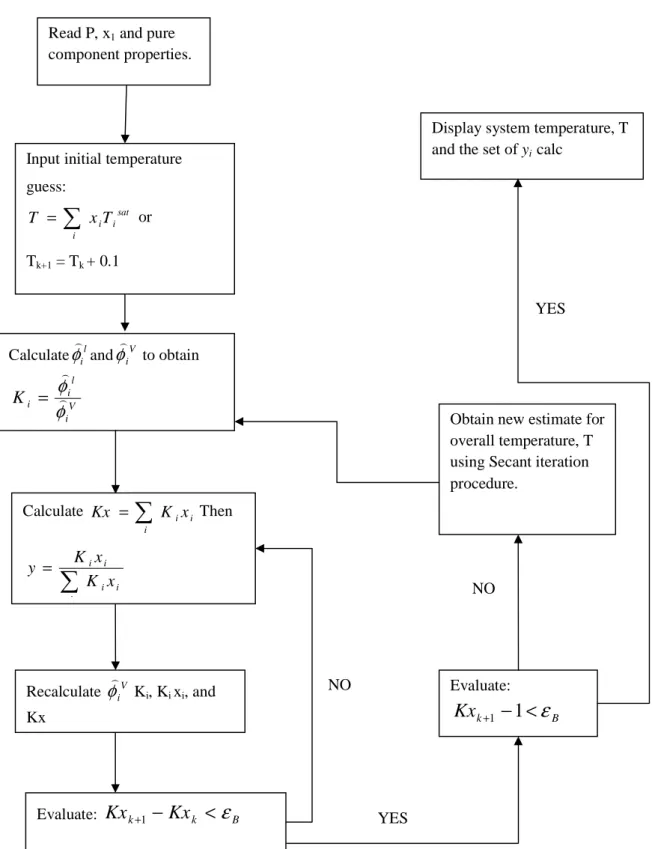
VLE Treatment Methods
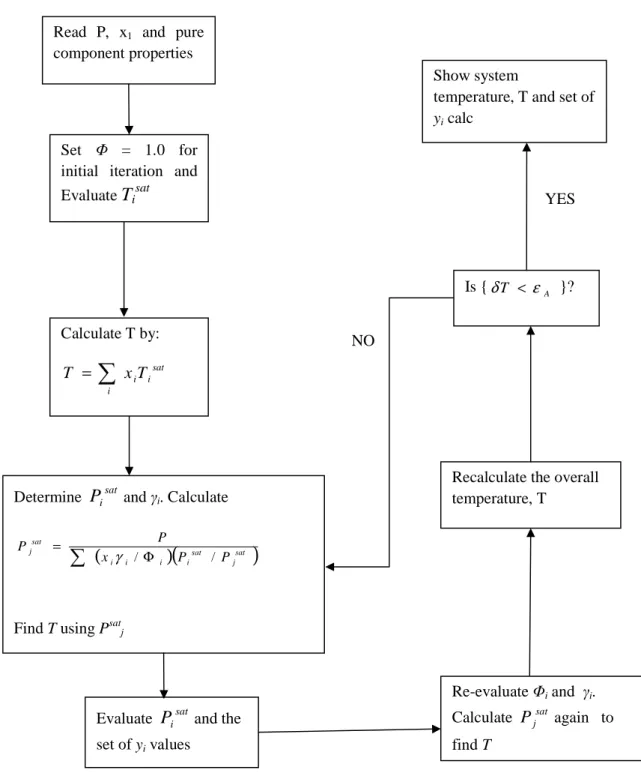
- The Combined Method (gamma-phi approach)
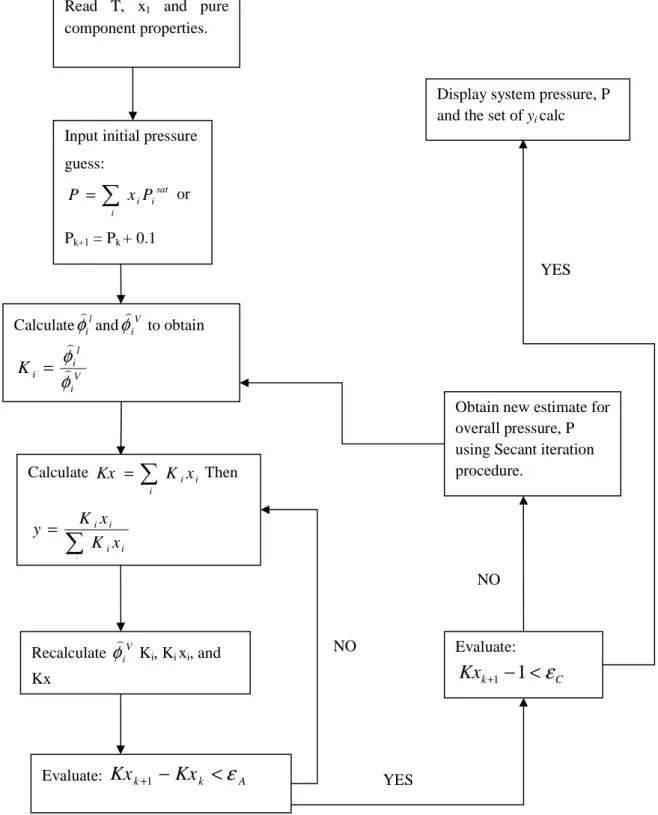
- The Direct Method (phi-phi approach)
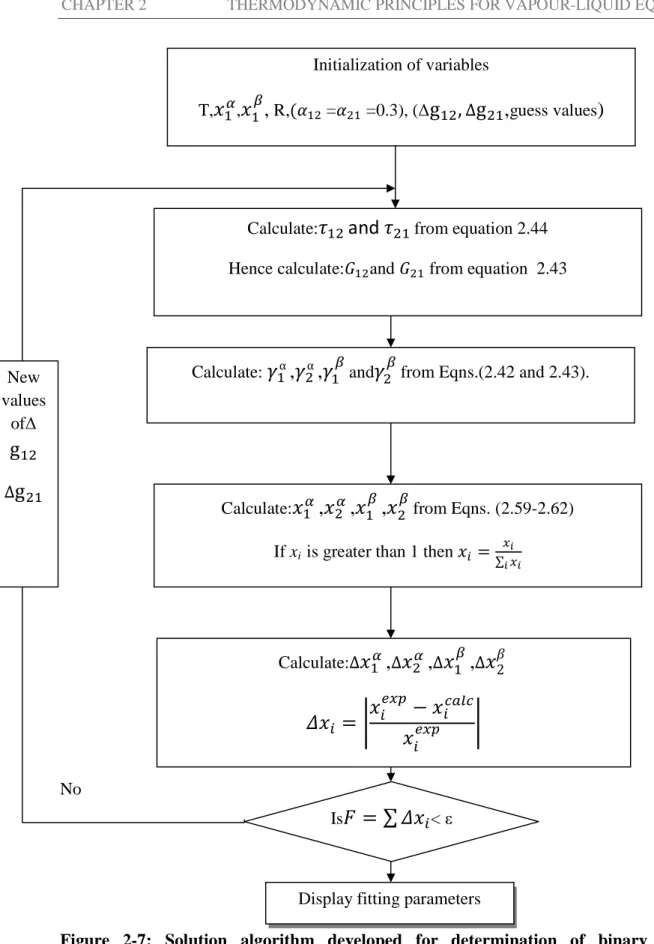
- Regression Algorithm (Gamma-phi and phi-phi)
Thermodynamic Models
- The Peng Robinson Equation of State
- Equations of State for Associating Systems
- The Virial EOS and The Hayden –O’Conell correlation (HOC)
- The Pertubation-Chain Statistical Association Fluid Theory (PC-SAFT)….…
- The Cubic Plus Association Equation of State (CPA)
- Excess Gibbs Energy Activity Coefficient Models
- The Wilson Model
- The NRTL (Non Random Two Liquid) Model
- The UNIQUAC (Universal Quasi-Chemical) Model
Liquid-Liquid Equilibrium Methods
- Activity Coefficient Approach
- The Cox Herington Plot for Coexistence
Thermodynamic Consistency
- Point Test
- Direct Test
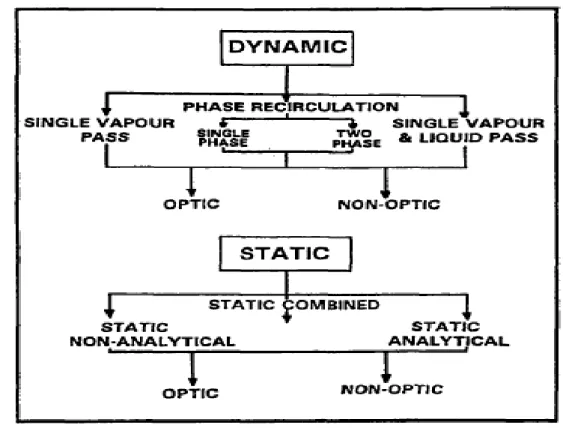
Static Equilibrium Apparati
- Static Equilibrium Apparatus of Kolbe and Gmehling
The equipment is used for atmospheric pressure measurements, so no pressure control scheme is in place (ie the pressure regulator line is open to atmosphere). Where N, π and c represent the number of data points, the number of phases and the number of components, B‚•€• is the experimental mole fraction and B‚v ‚ is the calculated mole fraction.
Dynamic (Recirculating) Equilibrium Stills
Liquid –Liquid Equilibrium (LLE) for Binary Systems
- Synthetic Method (Cloud point and Titration)
- Volumetric method
- Direct Analytic Method
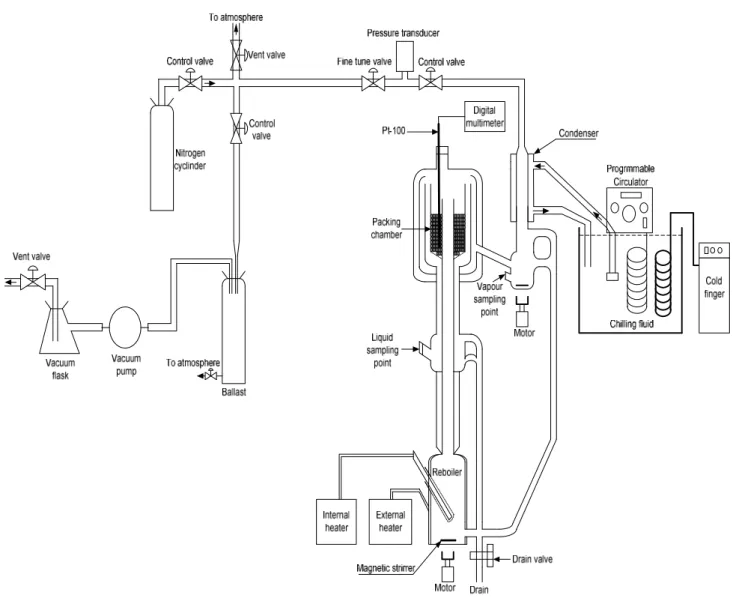
Description of VLE Equipment used in this Project
- Equilibrium Still of Lilwanth (2011)
- Temperature Measurement and Control
- Pressure Measurement and Control
- Sampling and Composition Analysis
- The atmospheric VLE still (2011)
GC 2014 uses a poropack Q packed column and thus separates chemical species based on molecular size, while an HP-5 capillary column is used in GC 2010 and separates a given system based on volatility (i.e. the more volatile component is removed first in the column). Compatibility of the rubber with chemicals used in this project (especially furfural-hexane system). The average deviations of pressure (∆P/kPa) and vapor molar compositions (∆y1) are given in Table 7-3; also given is the average absolute percentage deviation (AAD %) of the vapor mole fraction.
The average pressure deviations (∆P/kPa) and molar vapor compositions (∆y1) are given in Table 7-4. The average absolute deviation percentage (AAD %) of the vapor mole fraction is also given. A large difference in volatility of chemical species indicates the easier distillation of the two compounds; while species of similar volatility (i.e. relative volatility approaches unity) will require an enormous amount of energy and an infinite number of equilibrium stages in a conventional distillation system. This is attributed to the poor prediction of the vapor phase mole fraction for this system.
The thermodynamic NRTL-HOC model was used in the simulation of the propan-1-ol dehydration process in Aspen Plus process simulator version 7.1.
Description of LLE equipment used in this project
- New VLLE Apparatus
- Apparatus Design and Auxiliary equipment
Preparation of experimental Apparatus
- Leak Detection Procedure
- Cleaning of the VLE Still
Calibration of Sensors
- Pressure Calibration
- Temperature Calibration
- Composition anaysis
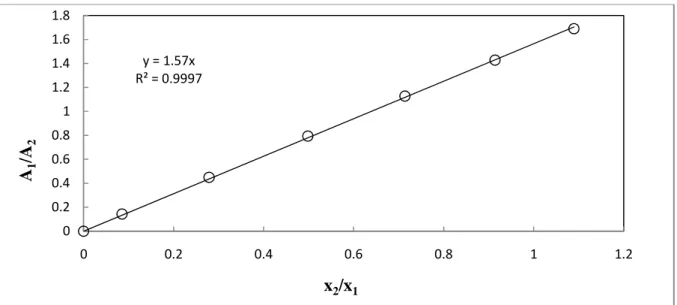
- Gas Chromatograph Detector Calibration
- Density meter calibration
Operating Procedure of the Automated VLE Still
- Isobaric Mode (vacuum)
- Isobaric Mode (above atmospheric pressure)
- Isothermal Mode
- Shutdown Procedure
LLE Measurements
- Cleaning of LLE Cell
- Temperature Calibration, Measurement and Control
- Gas Chromatograph Detector Calibration Composition Analysis
- Procedure
- Chemical Used in this Study
- Calibrations Results of the Equipment Used in this Project…
- Pressure and Temperature Sensor Calibrations
- GC Calibrations and Operating Conditions
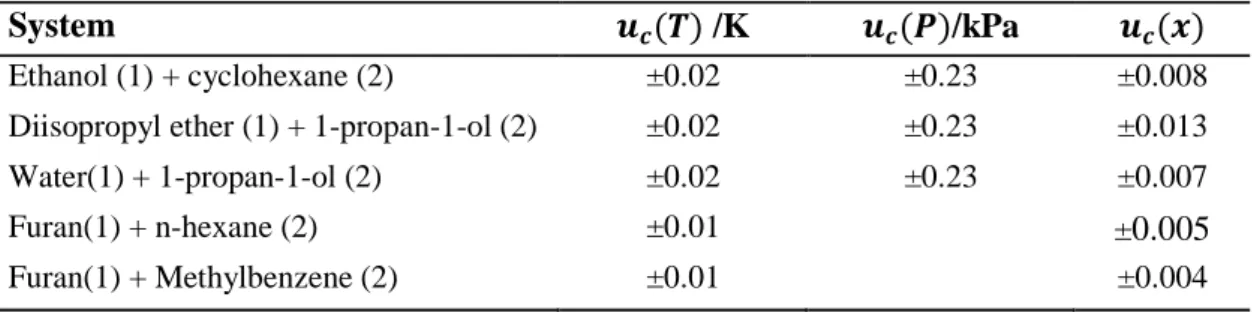
Uncertainty in Measurements
- Uncertainty in pressure, temperature and composition
- Basic equations used for statistical analysis of results
- Vapour Pressure
This section discusses uncertainty, an important but often neglected aspect of experimental data measurements. Error is quantified as the difference between a measured value and the actual value of the property being measured, while uncertainty refers to the quantification of doubt about an experimentally measured result (Bell, 1999). To quantify the uncertainty in a given set of measurements, it is important to identify all possible sources that contribute to the uncertainty.
Uncertainty in these variables arises from imperfections in calibration curves and repeatability deviations for a single transducer reading. Imprecision present in the TCD calibration can be considered the largest contributor to the molar composition uncertainty. Soo (2011) called for neglecting the uncertainty of repeated samples, as the manual sampling aspect of the VLE devices used is not ideal and the sample repeatability uncertainty contributes to approx. 1% of the final uncertainty.
The vapor pressure data were measured for the components used in this project, except for furan, n-hexane and toluene, for which the abundant literature data were used.
Binary Vapour-Liquid Equilibrium Results
- Results for the test system: Cyclohexane (1) + ethanol (2)
- Diisopropyl ether (1) + propan-1-ol (2) system
- Water (1) + propan-1-ol (2) system
- Furan (1) + n-hexane (2) system
- Density of mixtures: furan (1) + n-hexane (2) system
- Vapour-liquid equilibrium data for furan (1) + n-hexane (2) system
- Furan (1) + methylbenzene (2) system
- Density of mixtures: furan (1) + methylbenzene (2) system…
- Vapour-liquid equilibrium data for furan (1) + methylbenzene (2) system
Three activity coefficient models were selected that accounted for the deviation of the liquid phase from ideality, Wilson (1964), NRTL (Renon and Prausnitz, 1968) and UNIQUAC (Abrams and Prausnitz, 1975). The graphs shown in Figures 7-1 through 7-12 show a comparison of the model fit to the VLE data sets. The average deviations of the molar compositions of the vapor (∆y1) are given in Table 7-5; the percent average absolute deviation (AAD%) of the vapor mole fraction is also given. Figures 7-26 and 7-27 show a graphical representation of the model for the T-x-y data for this system.
The best fit was given by the PR-NRTL model with AAD of the vapor mole fraction 0.96%; while the UNIQUAC model gave a slightly higher value of 1.11. The average deviations of the molar vapor compositions (∆y1) are given in Table 7-6; also given is the average absolute percentage deviation (AAD %) of the vapor mole fraction. Figures 7-29 and 7-30 show the graphical representation of the model for T-x-y data for this system. When equal to unity, the two chemical species cannot be separated by conventional distillation regardless of the energy input to the system and the number of equilibrium stages in the separation column.
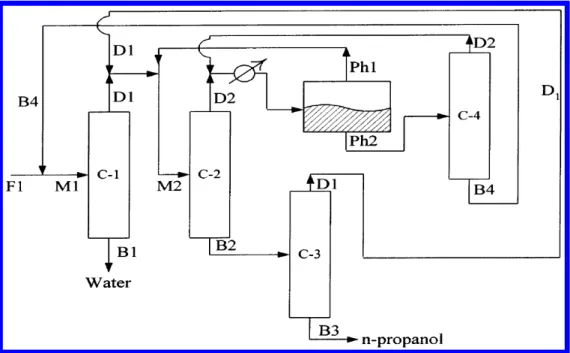
The data were also correlated using the Cox Herington model (Cox and Herington, 1956) to extrapolate the behavior of the system under critical conditions. The measured data also allows updating the temperature range applicability of the model parameters available in the data bank. The upper stream of the recovery column DIST2 consisting of water, propan-1-ol and DIPE is combined in the first decanter with stream DIST1.
Binary LLE Experimental Data
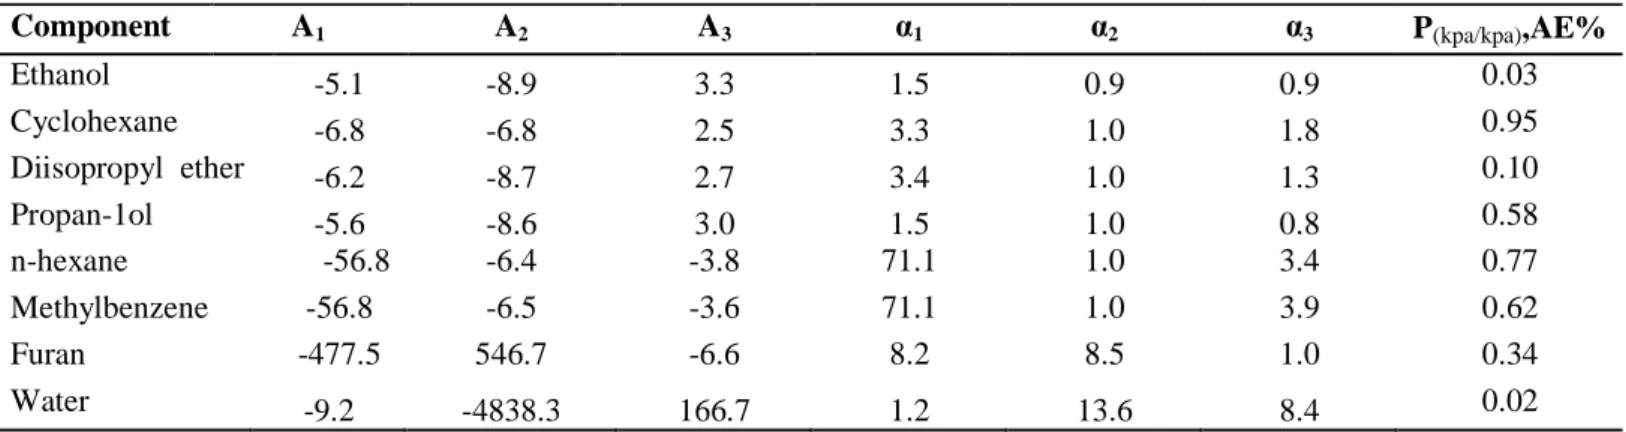
Vapour pressure Data Regression
The Wagner equation (used by Span and Wagner, 2002) and the Antoine equation were used to correlate the data. Tables 7-1 and 7-2 show the regressed parameters and mean error for the Wagner and Antoine equations, respectively. Table 7.1 shows that the Wagner equation correlated the data exceptionally well, with an average error between 0.03 and 0.95.
The Antoine equation gave similar trends of results with cyclohexane being the only component with an average error above 1%. The higher error in cyclohexane is attributed to the "strange behavior" (possible contamination when the endpoint was measured) of the boiling point at 100 kPa (shown in Table 6.6).
Binary VLE Data Regression
- Modeling results for: Diisopropyl ether (1) + propan-1-ol (2) system
- Modeling results for: Water (1) + propan-1-ol (2) system
- Modeling results for: Furan (1) + n-hexane (2) system
- Modeling results for: Furan (1) + methylbenzene (2) system
Where N is the number of experimental data points in the regression and (F•€•− Fv ‚) is the deviation between the measured and calculated vapor phase composition for the data point. No significant difference was observed between the models, with PR-NRTL showing the smallest deviations for the data set at 333.15 K. Overall the combination of equations of state with the NRTL model gave better fits than both Wilson models and UNIQUAC except for the data set at 373.15 K where the NTH-NRTL model gives higher values of (∆y1).
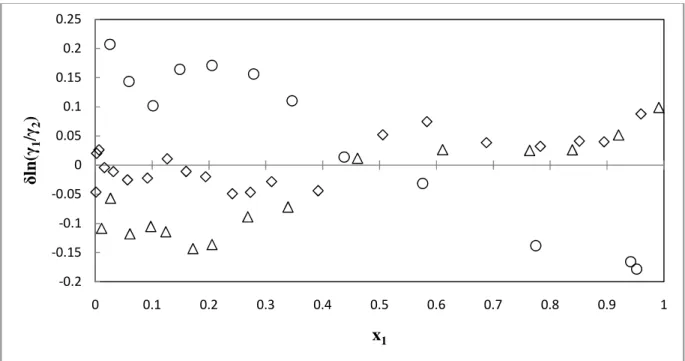
7-13 through 7-15 provide the graphical representation of activity coefficients for each data set with experimental activity coefficients listed in Appendix D. Figures 7-24 and 7-25 show the graphical representation of activity coefficients for each data set with experimental activity coefficients listed in Appendix D. The activity coefficients for this data set are shown graphically in Figure 7-28, and the experimental activity coefficient values are given in Appendix D.
The activity coefficients for this data set are plotted in Figure 7-29, and the experimental activity coefficient values are given in Appendix D.
Thermodynamic Consistency Testing
- Diisopropyl ether (1) + propan-1-ol (2) system
- Water (1) + propan-1-ol (2) system
- Furan (1) + n-hexane (2) system
- Furan (1) + methylbenzene (2) system
- Root mean square deviation (direct test)
The mean vapor phase deviations were less than the point test margin of 0.01 for all the models except the HOC-UNIQUAC with a value of 0.012 for the 358.15 K data set. The direct test (Van Ness, 1995) was also used for data consistency testing for this system. Finally, the models fitted the water (1) + 1-propanol (2) system well with the data sets passing both consistency tests.
The average vapor phase deviations were found to be much less than the point test margin of 0.01 for all the models. Finally, the furan (1) + n-hexane data set was found to pass both point and direct tests for thermodynamic consistency. The average vapor phase deviation as high as 0.023 for the PR-UNIQUAC model which is significantly higher than the 0.01 value required for data to be thermodynamically labeled in accordance with the chosen models.
The direct Van Ness (1995) consistency test was performed to give a different view of consistency and from Tables 7-10 it can be seen that the root mean square deviation for this system is 0.177, which falls under index 8 in Table 2-3 ( index 1: high quality data and index 10: poor quality data.
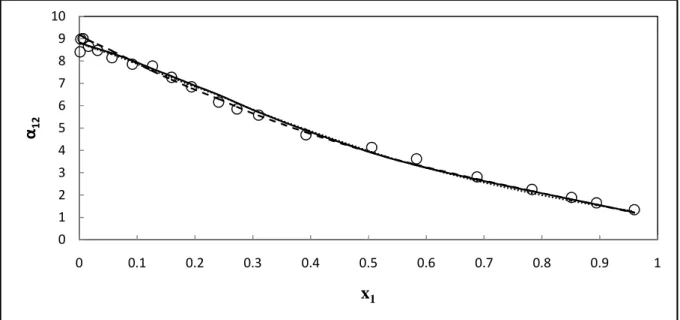
Relative Volatility
- Furan (1) + methylbenzene (2) system
The systems water (1) + propan-1-ol (2) and diisopropyl ether (1) + propan-1-ol (2) measured in this work behave azeotropically at the given temperatures. Relative volatility and model predictions are given in Figures 7-36 through 7-42 for all measured VLE systems. A good representation of the relative volatility data with the models is noticeable for all systems except for the furan (1) + methylbenzene (2) system.
Reduction of Binary LLE Data
The work was carried out as part of an illustration of the use of experimental data and thermodynamic models used in process simulation with the measured experimental data to establish confidence in the simulated results. The remainder of the simulation was based on sensitivity analysis to obtain the best possible input parameters. The azeotropic distillation process involves a two-stage separation; the separation of the two azeotropic components in the form of the solvent and the recovery of the solvent.
The recovery of the propan-1-ol fraction in this stream is 34.2% of the original feed and is relatively low. The recovered solvent is 99.36% of the original solvent fed to the process and is returned to the azeotropic column where it is combined with the addition stream used at the start of the process simulation. This is crucial because sending the entire recirculation stream in the azeotropic column in Aspen results in interruption of the simulation and severe errors and thus lack of convergence.
Energy consumption of the first recovery column (kJ/s) -7.63 Energy consumption of the second recovery column (kJ/s) 228.5.
Simulation of the Propan-1-ol Dehydration Process via Azeotropic Distillation in
- Thermodynamic Model Validation
- Aspen input Data
- Process Flowsheet and Simulation Sequence
- Diisopropyl Ether as an Entrainer Benchmarked Against n-Pentanol
Experimental Measurements
Theoretical Analysis
Aspen Plus Simulation of the Propan-1-ol Dehydration Process
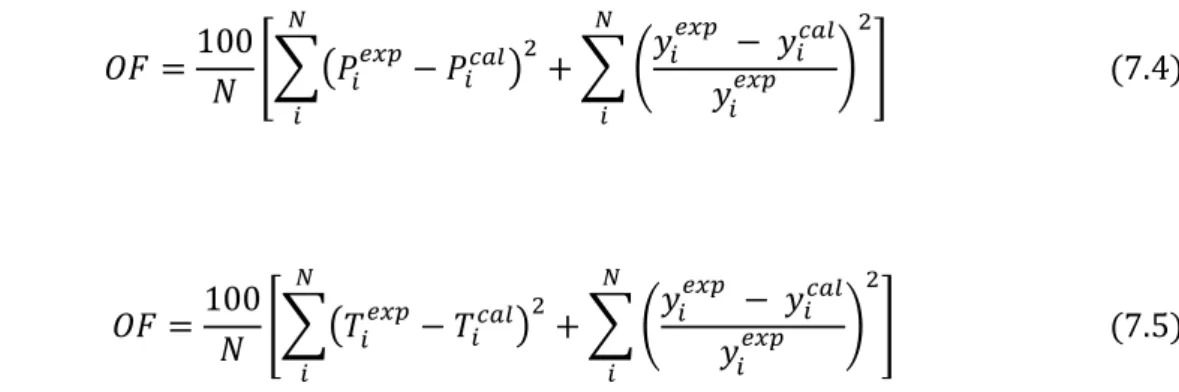
The fruitful advantages for using biomass-derived fuels are the carbon neutrality based on carbon recycling (i.e. the carbon release from biomass is reabsorbed by plants for growth via photosynthesis. Various techniques are used for regression, such as least squares, by Marquardt (1963 ) ) and Gess et al., 1991).The regression method is normally performed by minimizing the deviation between the experimental and model values for a specified quantity (also known as the residual). The only drawback with such an application is a large number of data requirements to avoid poor extrapolation. The model also does not take into account the major molecular association, polarity and induced polarity often exhibited by water–alcohol systems and carboxylic acids.
In the SAFT model, molecules are treated as chains of equal-sized spherical segments (ie, the chain structure was not taken into account in their dispersion terms). However, its use in the SAFT equation does not take into account the connectivity between the chain segments. Where β,o (2, ) is the fugacity of pure component i at the temperature and pressure of the mixture.