Therefore, binary vapor–liquid equilibrium (VLE), liquid–liquid equilibrium (LLE), and vapor–liquid–liquid equilibrium (VLLE) data were investigated. The VLE and VLLE data were measured with the modified apparatus from Raal (Raal and Miihlbauer, 1998).
CONCLUSION 172
RECOMMENDATIONS 174
APPENDIX A: CRITERION FOR PHASE EQUILIBRIUM 187
APPENDIX B: PHYSICAL PROPERTIES OF CHEMICALS 190
APPENDIX C: MODEL PARAMETERS FOR THE COMBINED
AND DIRECT METHODS 191
APPENDIX D: THERMODYNAMIC CONSISTENCY 193
APPENDIX E: NRTL PARAMETERS FOR TERNARY LLE
SYSTEMS 197 E.l Heptane (1) + Toluene (2) + Methanol (3) 197
K 143 Figure 7-12: Schematic used for point test with TWU-TC-NRTL model combination for. 40kPa 194 Figure D-4: Plot used for point test with PRSV-WS-NRTL model combination for.
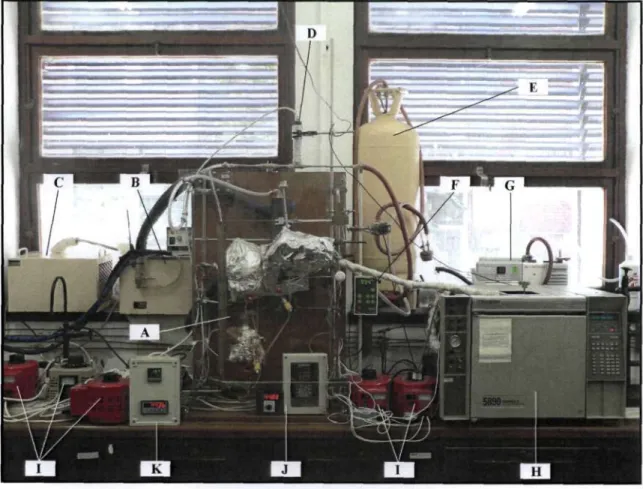
LIST OF PHOTOGRAPHS
LIST OF TABLES
Parameters for the best and worst fitting models and their deviations from experimental values for the 1-dodecene (1) + 1-nonanol (2) system at 403.15. NRTL model parameters for the combined method when a is fixed and their deviations from experimental values for the 1-dodecene (1) + 1-nonanol (2).
NOMENCLATURE
Parameter in the UNIQUAC model of Abrams and Prausnitz (1975) ly Binary interaction parameter for the mixing rule of Twu and Coon (1996) M Represents a general thermodynamic property. Uy -uu Parameter representing energy interactions between species in the U N I Q U A C model of Abrams and Prausnitz (1975).
CHAPTER ONE
INTRODUCTION
CHAPTER TWO
A REVIEW OF SOME EXPERIMENTAL TECHNIQUES
- The Dynamic Method
- V L E Recirculating Stills
- Recirculation of Vapour Phase only
- Recirculation of both Liquid and Vapour Phases
- LLE Techniques
- The Titration Method
- Laser-light Scattering Technique
- Direct Analytical Method
- VLLE Recirculating Stills
- Recirculation of Vapour Phase Only
- Recirculation of both Liquid and Vapour Phases
The Cottrell tube and equilibrium chamber are vacuum jacketed to prevent partial condensation of the vapor. The apparatus of Thornton (1951) is based entirely on the principle of the Cottrell tube to achieve equilibrium.
CHAPTER THREE
THERMODYNAMIC FUNDAMENTALS AND PRINCIPLES
Fugacity and Fugacity Coefficient
- Fugacity Coefficients from the Virial Equation of State
- Fugacity Coefficients from a Cubic Equation of State
- Mixing Rules for Cubic Equations of State
The exponential in Equation (3-22) is known as the Poynting factor, which provides the correction of the liquid phase fugacity from the vapor pressure to the system pressure. The calculation of the second Virial cross coefficients uses the same mixing rules for ( T ) and coy as given in the Pitzer-Curl (1957) correlation.
Activity and Activity Coefficient
- Liquid Phase Activity Coefficient Models
Activity coefficients can be evaluated using liquid phase activity coefficient models that are independent of vapor composition. The parameter r is the molecular structure constant of the pure component, which takes into account the size of the molecules.
Vapour-Liquid Equilibrium (VLE)
- Low Pressure VLE Data Regression
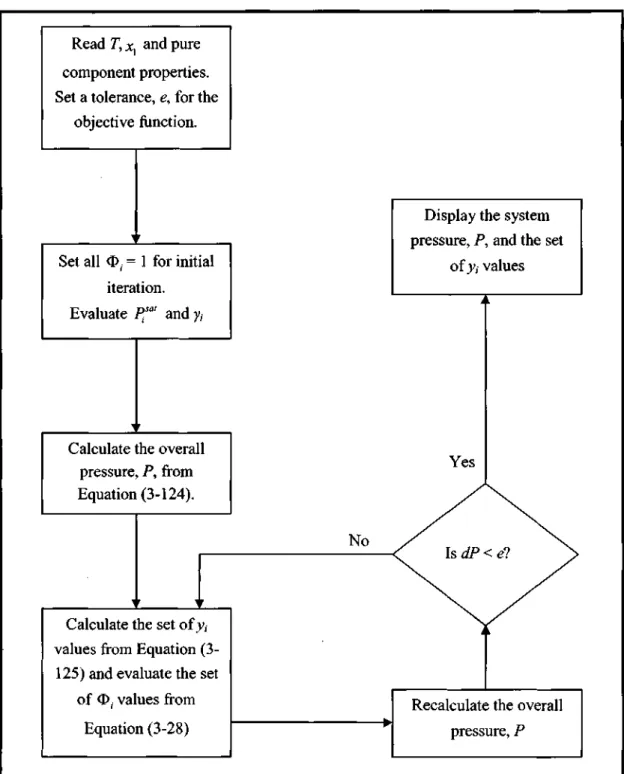
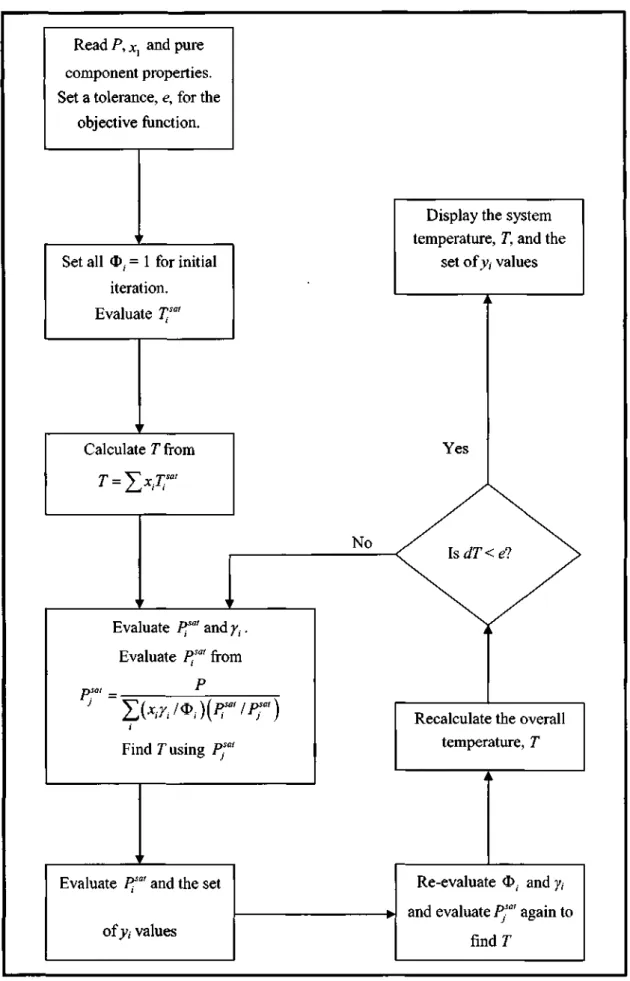
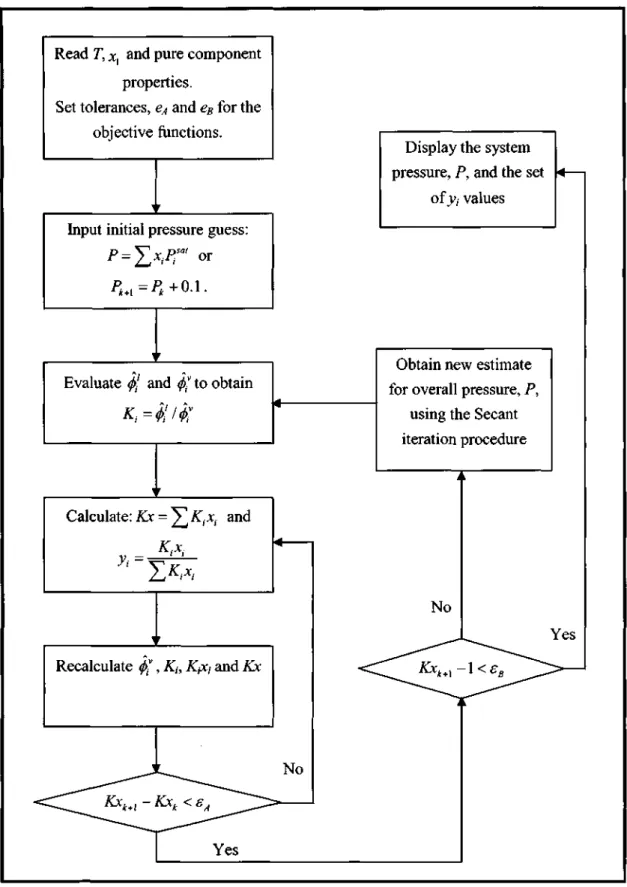
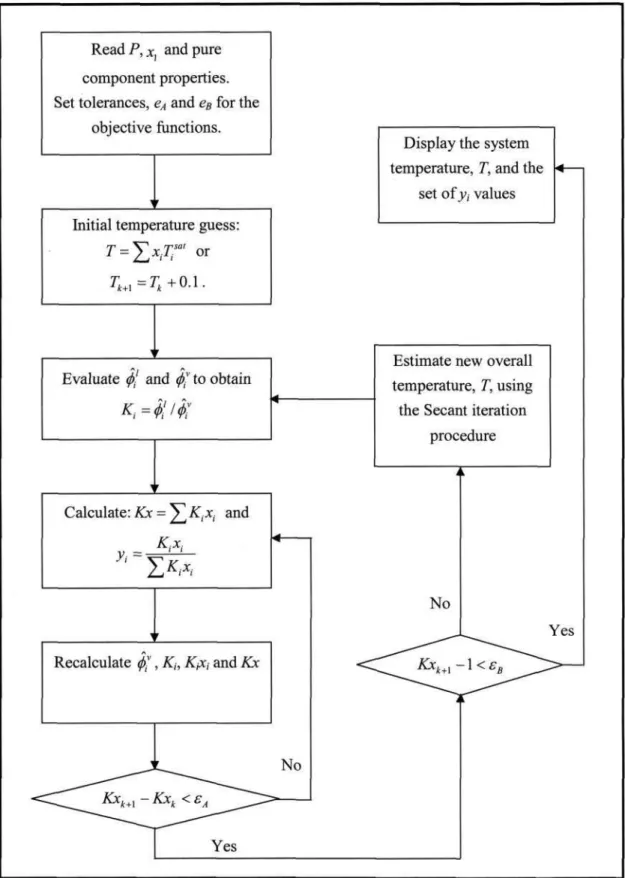
There are different calculation procedures for each method that depend on the nature of the VLE data. However, the temperature dependence of the model parameters is important for reducing the isobaric. This method uses an equation of state (EOS) to represent the non-ideality of vapors and liquids using fugitive coefficients.
Selection of the most suitable EOS that describes both the non-idealities of the liquid phase and the vapor phase. The interaction parameters of the mixing rules (see section 3.1.3) are obtained from the reduction of experimental VLE data.
- Liquid-Liquid Equilibrium (LLE)
- Binary Systems
- Ternary Systems
- Theoretical Treatment of LLE
- Atmospheric LLE Data Regression
- Vapour-Liquid-Liquid Equilibrium (VLLE)
- Low Pressure VLLE Data Regression
- Thermodynamic Consistency Tests
- The Point Test
- The Direct Test
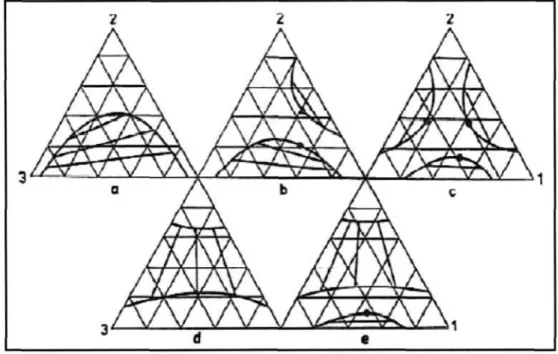
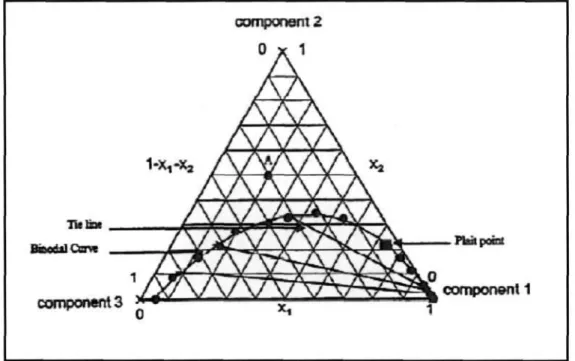
Each vertex of the triangular phase diagram represents a pure component, and the binodal curve separates the single-phase region (above the binodal curve) from the two-phase region (below the binodal curve). The crossover point, also known as the critical point, represents the point on the binodal curve where the compositions of the two phases at equilibrium are identical. According to Sorensen et al. 1979) this type is most frequently encountered and represents approximately 75 % of the measured ternary systems.
According to the Gibbs phase rule, when one of the variables is specified, the other four independent variables can be solved for. It does, however, allow one of the four measured variables to be used to test for thermodynamic consistency.
CHAPTER FOUR
EQUIPMENT DESCRIPTION
The Vapour-Liquid Equilibrium Apparatus
- The Vapour-Liquid Equilibrium Still
- Temperature Measurement and Control
- Pressure Measurement and Control
- Sampling
- Composition Analysis
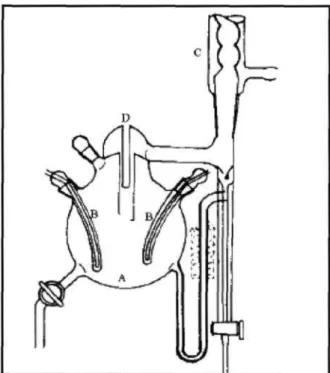
A key feature of this design is the packed equilibrium chamber (F) which is vacuum-insulated (E), thus ensuring adiabatic operation of the chamber. A Pt-100 temperature sensing element is located inside the gasket (H) to provide an accurate measurement of the system's equilibrium temperature. The bottom of the equilibrium chamber consists of holes to enable decoupling of the liquid and vapor phases.
To avoid this, Ndlovu (2005) suggested keeping the temperature of the outer walls of the equilibrium chamber at 5. These temperatures were important for the compositional analysis of a vapor sample to avoid partial condensation of the vapor phase.
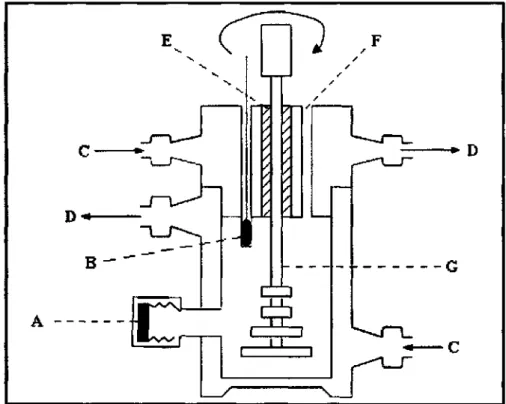
The Liquid-Liquid Equilibrium Apparatus
- The Liquid-Liquid Equilibrium Cell
- Temperature Measurement and Control
- Sampling and Composition Analysis
The modification improved the thermal insulation of the cell by circulating the ethylene glycol solution through the cell lid, unlike the previous device that had a press-fit Teflon end cap on the equilibrium cell. The previous device had a single sampling point and therefore could not prevent possible contamination of the samples. In the lid of the cell there was a thermowell in which a Pt-100 temperature sensor (B) was placed.
To achieve mixing of the cell contents, an agitator (G) driven by a miniature variable speed DC motor was used. The Pt-100 temperature sensor for the equilibrium temperature was placed in the thermowell of the cell, where a drop of oil was immersed in the thermowell to increase the contact area between the sensor and the glass wall.
CHAPTER FIVE
The Vapour-Liquid Equilibrium Apparatus
- Preparation
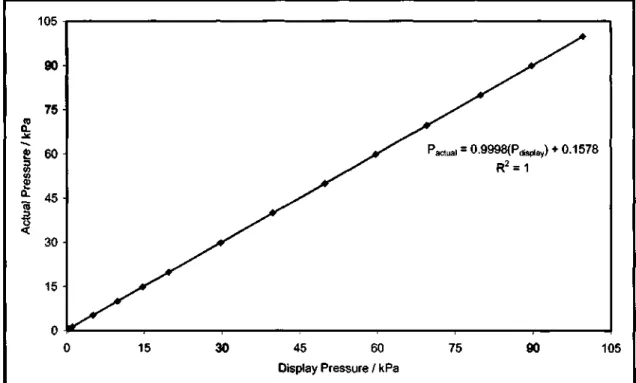
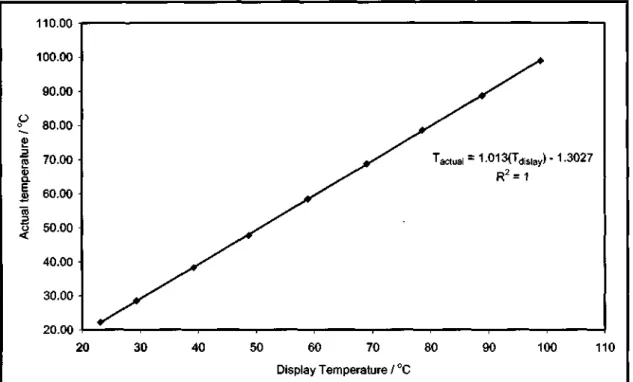
- Calibration
- Operating Procedures
This method involved drawing a vacuum into the apparatus using the vacuum pump and then controlling the pressure in the system to a specified value. The VLE apparatus was thoroughly cleaned prior to the calibration of the pressure transmitter and temperature sensor. The calibration process involved isobaric operation of the VLE apparatus over a range of pressures.
The shape of the calibration graphs depends on the detector type and the system under investigation. For VLLE systems, the temperature controller that regulates the heat to the outer wall of the equilibrium chamber was set to a temperature that.
The Liquid-Liquid Equilibrium Apparatus
- Preparation
- Calibration of Temperature Sensors
- Gas Chromatograph Calibration
- Operating Procedure
The equilibrium temperature for the LLE measurements was obtained with a temperature sensor placed in the thermowell of the cell (see Section 4.2.2). Then we set the desired temperature on the Labotech water bath temperature regulator and let the system reach thermal equilibrium. The accuracy of the measured temperature was estimated at ±0.02 °C, and the accuracy of the temperature control was at ±0.02 °C.
The accuracy of the measured temperature was estimated to be within ±0.03 °C and the accuracy of the temperature control was within ±0.02 °C. The temperature was then raised by setting a higher temperature on the water bath temperature controller and the above procedure was then repeated.
CHAPTER SIX
Chemical Purity
Acetonitrile, methanol, heptane, heptanoic acid, decane, and dodecane were purchased from Merck, while 1-nonanol and 1-dodecene were obtained from Fluka, and distilled water was used. All reagents were used without further purification as gas chromatographic analysis, following the method of Raal and Miihlbauer (1998), revealed no significant impurities. The chemical purities were further analyzed by refractive index measurement and compared with literature values.
Vapour Pressure Data
Vapour-Liquid Equilibrium Results
- Cyclohexane (1) + Ethanol (2)
Liquid-Liquid Equilibrium Results
- Binary Systems
- Ternary Systems
This system is also presented as new LLE data as it has not been measured before. This system has not been previously measured at 323.15 K and 1 atm and is therefore presented as new LLE data. This system has also not been previously measured at 323.15 K and 1 atm and is therefore presented as new LLE data.
The other binary pair for the gas chromatographic calibration plots, the experimental data and the triangle diagram are shown below. The other binary pair for the gas chromatographic calibration curves, the experimental data and the triangle diagram are shown below.
CHAPTER SEVEN 7
DATA ANALYSIS AND DISCUSSION
Pure Component Properties
The second Virial coefficients were evaluated using the correlations of Pitzer and Curl (1957) and Tsonopoulos (1974), discussed in sections 3.1.1.1 and 3.1.1.2, respectively.
Experimental Vapour Pressure Data
- Regression of Vapour Pressure Data
- Pure Component Parameters for Equations of State
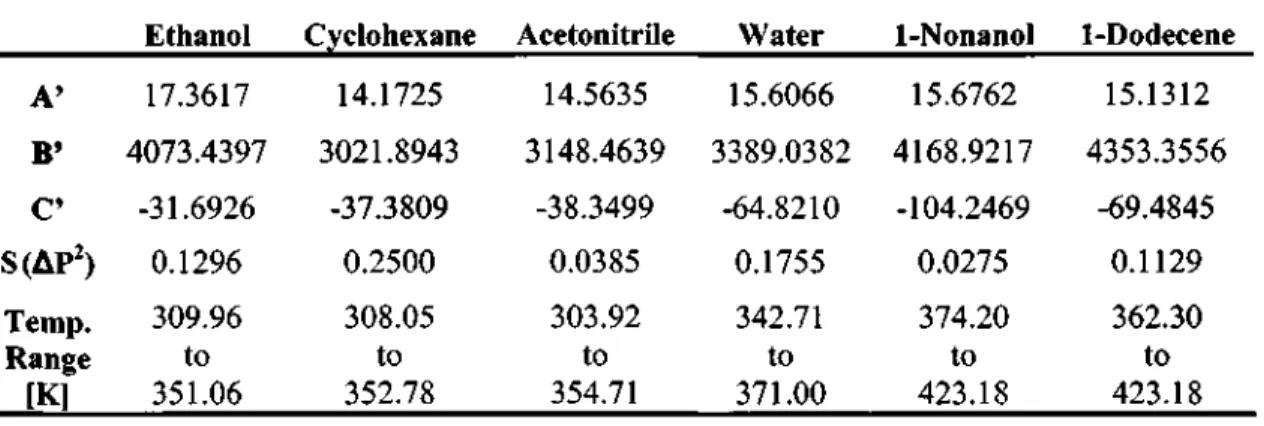
Stryjek and Vera (1986) report that the value of K" was obtained from the regression of vapor pressure data and was found to be sensitive to the critical properties of the pure component. This new alpha function contained three pure component parameters (L',M' and TV) which were found from the regression of experimental vapor pressure data. According to Twu et al. 1991), the accurate prediction of the vapor pressures of the pure components has a great influence on the accuracy of the vapor-liquid equilibrium calculations.
Therefore, it was important to obtain accurate values for the parameters of the pure PRSV EOS component and Twu et al. PRSV EOS and Twu et al. 1991) the alpha function shows excellent prediction of the vapor pressures of the pure components, as can be seen from the low values of S(AP2) in Tables 7-3 and 7-4.
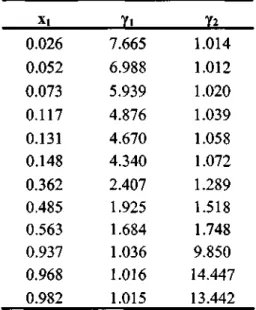
Experimental Activity Coefficients for the VLE Systems
The regressed values for*:, are presented in Table 7-3 and the regressed values for L\M' and N' are presented in Table 7.4. However, it is difficult to comment on which function provides the most accurate prediction of pure component vapor pressure since the S(AP2) values are almost the same for all components. These activity coefficients are known as the experimental activity coefficients as they are calculated directly from VLE data without the use of an activity coefficient model.
The experimental activity coefficients are shown in Tables 7-5 and 7-6 for the systems measured in this work.
- Cyclohexane (1) + Ethanol (2)
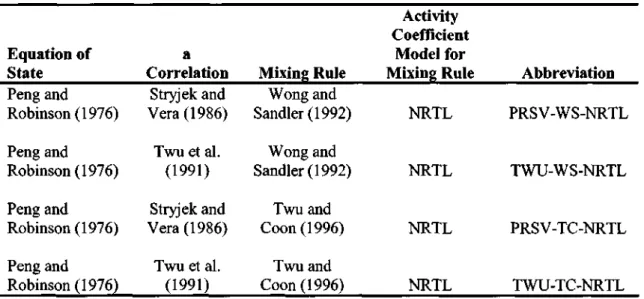
Overall, it was found that the modified alpha function of Twu et al. 1991) with the mixing rule of Twu and Coon (1996) provided the best fit to the experimental VLE data, as it gave the lowest value for the objective function and thus the mean values of AT and Ay7. The parameters for the best-fitting models (PC-NRTL and TWU-TC-NRTL) and the worst-fitting models (TS-UNIQUAC and PRSV-WS-NRTL) are presented in Table 7-9. In the direct method, analysis of various combinations showed that the modified alpha function of Twu et al. 1991) with the mixing rule of Wong and Sandler (1992) provided the best fit to the experimental VLE data, as it showed the lowest average value of Ay}.
The parameters for the best fitting models (TS-NRTL and TWU-TC-NRTL) and worst fitting models (PC-UNIQUAC and PRSV-WS-NRTL) are shown in Table 7-10. The experimental data are presented along with the model that showed the best fit and the model that showed the worst fit for the x-y and T-x-y plots in Figures 7-6 and 7-7 for the combined method and Figures 7-8 and 7 -9 for the direct method.
Thermodynamic Consistency Testing for VLE Systems
- Cyclohexane (1) + Ethanol (2)
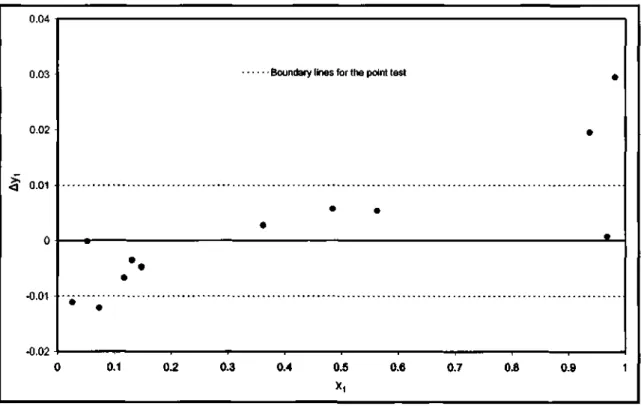
Applying the point test to the equation of state models showed that only the combination of TWU-WS-NRTL models gave the lowest absolute mean vapor composition. This value, however, lies at the limit of the point test and thus shows how the model affects the results of the thermodynamic consistency tests. A summary of the results for the mixing rule that provided the lowest absolute mean vapor composition is presented in Table 7-14.
When using the liquid phase activity coefficient models for the spot test, none of the liquid phase activity coefficient models met the requirement for this test. For the direct test, the NRTL model gave the lowest value for the RMSD of the residual {81n(yi/Y2)}, as shown in Table 7-15.
- Binary Systems
- Ternary Systems
It was also found that the log y equation provided the best fit for the binodal curve. It was also found that the 8 function provided the best fit for the binodal curve. It was also found that the 13 function provided the best fit for the binodal curve.
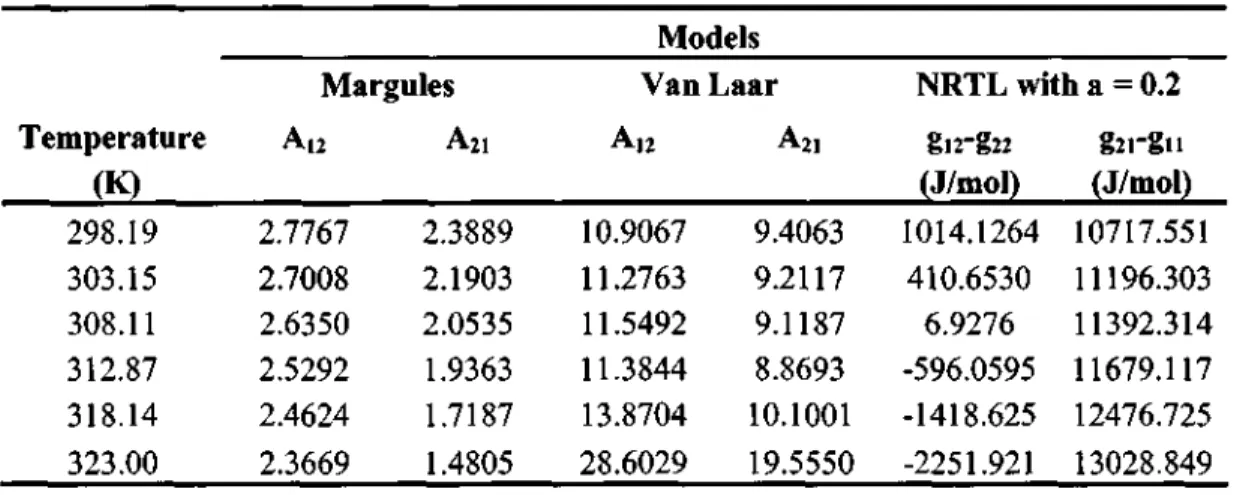
Parameters for the NRTL model with a = 0.20 and the modified UNIQUAC model are shown in Table 7-25. Parameters for the NRTL model with a = 0.20 and the modified UNIQUAC model are shown in Table 7-27.
VLLE Systems
- Acetonitrile (1) + 1-Dodecene (2)
- Water (1) + 1-Nonanol (2)
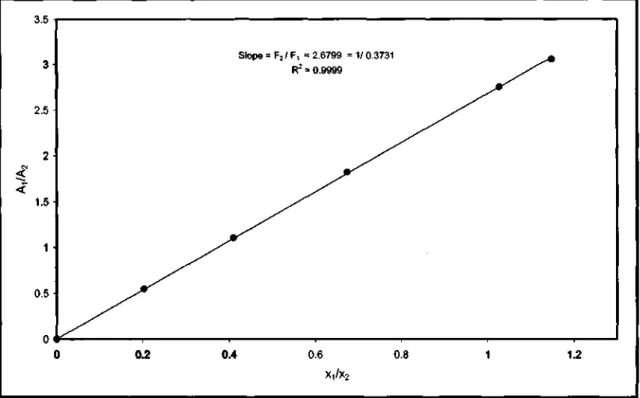
This was achieved by using the parameters of a liquid phase activity coefficient model in the combined method of the VLE regression technique. However, in recent years the ebulliometer has received much attention for the measurement of infinite dilution activity coefficients and the reader is suggested to Raal et al. For isothermal operation, a variation of 0.05 K in the temperature caused by, for example, "flashing", will produce a pressure response of 5 Pa at about xx = 0.005.
This means that for the same variation of 0.05 K in the temperature, the system will produce a pressure response of 11.1 Pa. Now according to Figure 7-31, as the composition increases, the pressure response increases for a constant variation in the system temperature.