New Product Development with Dynamic Decision Support
Jacobus Petrus Venter & Cornelis Cristo Van Waveren Department of Engineering Technology Management
University of Pretoria, 0002, South Africa
ABSTRACT
The development of new and improved management methods for new product development is important.
Existing methods suffer from a number of shortcomings, especially the ability to deal with a mixture of quantitative and qualitative data. The objective of this study is to apply decision support techniques (especially Bayesian Networks) to the area of new product development management in order to address some of the shortcomings.
The research approach is one of decision structuring and modelling. Literature exists that shows the criteria that is important during the management of new product development. A three step decision structuring framework are used to develop a conceptual model, based on a Bayesian network, to support new product development management. The result is a Bayesian network that incorporates the knowledge of experts into a decision support model. It is shown that the model is requisite because it contains all the essential elements of the problem from which a decision maker can take action.
The model can be used to perform what-if analysis in various ways, thereby supporting the management of risk in new product development. This research contributes not only a model to support new product development management but also provides insight into how decision support, and especially Bayesian networks, can enhance technology management methods.
1 Introduction
In business, management is often faced with choices such as “Should the business expand or consolidate?”, “Should excess cash be used for capital expansion or paid out as dividends?”, “What new product should be developed from the choices available?” Such choices are not easy to make and managers needing to make such choices could benefit from decision support.
In both the manufacturing and services sector new products are constantly being developed. A company normally choose not to risk all on the development of only one product but develops a portfolio of products. Such a portfolio normally consists out of products chosen from a multitude of possibilities.
Various such portfolio management methods exist. These methods can be grouped together in the following categories (Chen et al 2006): Financial models and financial indices, Probabilistic Financial models, Options pricing theory, Strategic Approaches, Scoring models and checklists, Analytical hierarchy approaches, Behavioural approaches, and Mapping approaches.
Current methods of technology management in general suffer from a number of specific shortcomings.
These shortcomings includes: Ignores probabilities and risk (Cooper et al 2001a), Depends on extensive financial and other quantitative data (Cooper et al 2001a), Considers only financial criteria (Cooper et al 2001a), Force choices need to be made (Cooper et al 2001a), A small number of factors are taken into account, The interrelationships between factors are not addressed, More than one tool is necessary to address the issues (Cooper et al 2001a), and Inability to take into account qualitative implications (Irani et al 2002).
Liao (2005) performed a literature study on technology management methodologies and applications. In the suggestions it is stated that the qualitative and quantitative methods are different in both methodology and problem domain and that the integration of qualitative and quantitative methods may be an important direction for future work on TM methods.
NPD can be improved by approaches that support the creation of shared mental models (Carbonara 2006). The aforementioned methods use both qualitative and quantitative data but separately therefore not creating a shared mental model. It could therefore be argued that a management model that will enable the integration of both qualitative and quantitative methods over the different phases of the product development and that supports the development of a shared mental model will enhance the state of technology management. The purpose of this research is to move in a direction of decision methods incorporating both qualitative and quantitative approaches.
The research problem therefore includes the finding of a management or decision support method that will be able to simultaneously deal with both qualitative and quantitative data and be able to provide inputs at the different stages in the product development cycle. The model must also integrate the various aspects into a single visual model that can be shared and discussed among different experts.
A Bayesian Network (BN) creates a visual model that indicates the causal relationships between various aspects in the model. A BN can also deal with uncertainty and missing data and allow the user to experiment with possible outcomes (What-if analyses). It is believed that a BN based model for new product development will address the issues discussed above. This research will therefore focus on the development of a Bayesian network based model to support new product development decisions.
A. Previous work on NPD Criteria and Weightings
Carbonell-Foulquie´ et al (2004) did a study on the criteria and weightings used in the development of new highly innovative products. A highly innovative product was defined as a product that offered new or unique benefits or solutions for market needs and involved great design and production challenges.
Questionnaires were presented to companies involved in highly innovative NPD. In the questionnaires a four stage NPD cycle and sixteen criteria, compiled from literature, were presented. The four stage NPD cycle consisted of the stages: Development of new product concept and test, Simulation of product design and analysis of production process, Product and process development and test, and Production and market launch. At the end of each of these stages was a go/no-go decision gate. In the analysis of the results Carbonell-Foulquie´ et al (2004) eliminated three criteria due to the low level of indicated significance on making go/no-go decisions. These were: leverage of marketing skills, product patentability, and payback time. The remaining criteria were: availability of resources, opportunity window, project alignment with firm’s strategy, marketing synergies, technical/R&D synergies, project total cost for a given cycle time, product quality, market acceptance, customer satisfaction, sales volume, market growth, margin rate, and internal rate of return.
Carbonell-Foulquie´ et al (2004) performed a factor analysis on the criteria and found a five-factor solution. Factor analysis and the varimax rotation implemented by Carbonell-Foulquie´ et al (2004) is explained in Larose (2006). The factors identified were named: Technical Feasibility, Strategic Fit, Customer Acceptance, Financial Performance and Market Opportunity. The criteria that contribute to each factor are stated below. Technical Feasibility consisted of: estimation of project total cost, availability of resources, leverage of firm’s R&D, engineering, and manufacturing skills. Strategic fit included criteria:
Alignment of project with firm’s strategy and window of opportunity. Customer acceptance included three criteria namely: Market Acceptance, customer satisfaction and product quality. Financial performance is influenced by Margin Rate, Internal rate of return and sales volume. The last factor, Market Opportunity, included criteria Sales growth and Market share.
Further analyses by Carbonell-Foulquie´ et al (2004) identified the relative importance of the factors in the various NPD stages. The importance factors are not situation specific as the survey respondents belonged to different industries (43% mechanical machinery and equipment, 22.6% electrical machinery and equipment, 14.5% electronics and computers, 19.4% motor vehicles and other transports, 0.5% not stated: Carbonell-Foulquie´ et al (2004)). This also indicated the contributions made by the various criteria on the factors.
B. Decision Support
It is argued that technology management decisions are hard and therefore requires decision making support/science. Clemen and Reilly (2001) indicate four reasons why decisions are hard: Due to the complexity of the problem, because of inherent uncertainty in the situation, because the decision maker may be interested in working towards multiple objectives but progress in one direction impede progress in others, and because different perspectives lead to different conclusions.
New product development is characterised by a tremendous degree of complexity and uncertainty (Chen et al 2006) and involves choosing between different products competing for the same funding. Given this it can therefore be said that new product development decision are hard and therefore in need of decision support.
Decision analysis provides structure and guidance for systematic thinking in difficult situations; it does not provide an alternative that must be blindly accepted (Clemen et al 2001). Subjective judgement will always form part of any difficult decision. Clemen and Reilly (2001) states that personal judgements are important ingredients for making good decisions. Any model supporting NPD decision making must therefore allow for subjective inputs.
Clemen and Reilly (2001) indicate that modelling is critical in decision analysis. In this research a Bayesian Network modelling approach is used. This approach provides a graphical and mathematical
representation of the situation. From a decision analysis perspective such models have a key advantage in that they allow for analysis which can indicate a “preferred” alternative (Clemen and Reilly (2001)). A Bayesian network is a probabilistic model and according to Dorner et al (In Press) such a network is an effective modelling framework for the following reasons: it captures the structural aspects of the decision, it serves as a framework for and efficient quantitative analysis, allows sufficient representation and exploitation of conditional independence in a decision model, and has proven to be an effective tool for communicating decision models (among decision analysts and decision makers, and between the analyst and the computer).
C. Modelling
For the purpose of this study the following definition of a model is used:
“a model is an external and explicit representation of part of reality as seen by the people who wish to use that model to understand, to change, to manage and to control that part of reality” (Pidd 1996)
Embedded in the above definition is hidden an important aspect of modelling, and using models to enhance decision-making. The model is built for the purpose of assisting a better understanding of a situation. Models are, and will always be, approximate representations of reality. Pidd (1996) states that it is not necessary for a model to be exact to be of use. Pidd (1996) goes further to state that it is precisely because models are approximations of the reality that makes them useful.
A Bayesian network (BN) is used to model a domain containing uncertainty in some manner. This uncertainty can be due to imperfect understanding of the domain, incomplete knowledge of the state of the domain at the time a given task is to be performed, randomness in the mechanisms governing the behaviour of the domain, or a combination of these.
Formally, a Bayesian network can be defined as follows:
Definition A Bayesian network is a pair (G,P), where G=(V,E) is a directed acyclic graph over a finite set of nodes (or vertices), V, interconnected by directed links (or edges), E, and P is a set of (conditional) probability distributions. The network has the following property:
Each node representing a variable A with parent nodes representing variables B1, B2,..., Bn (i.e., Bi, A for each i=1,...,n) is assigned a conditional probability table (CPT) representing P(A | B1, B2, ..., Bn).
The nodes represent random variables, and the links represent probabilistic dependences between variables. These dependences are quantified through a set of conditional probability tables (CPTs): Each variable is assigned a CPT of the variable given its parents. For variables without parents, this is an unconditional (also called a marginal) distribution.
Inference: Inference in a Bayesian network means computing the conditional probability for some variables given information (evidence) on other variables. This is easy when all available evidence is on variables that are ancestors of the variable(s) of interest. But when evidence is available on a descendant of the variable(s) of interest, we have to perform inference opposite the direction of the edges. To this end, we employ Bayes' Theorem:
) (
) ( )
| ) (
|
( P B
A P A B B P
A
P =
BN inference is essentially a clever application of Bayes' Theorem.
2 Decision structuring and a conceptual model.
Structuring decisions require three fundamental steps (Clemen et al 2001). The first is to identify the values and objectives. In this study the values (what is important to the decision maker) is the potential return on investment indicated at the different stage gates in the NPD process. The objectives (important aspects taken together that form the values) are the different aspects that influence the investment returns. Carbonell-Foulquie´ et al (2004) identified thirteen relevant criteria and provide quantitative information regarding the use of the criteria. It was therefore chosen to use these criteria as the influencing aspects.
The second step is structuring the elements of the decision situation into a logical framework. A graphical model is always useful and normally easier to understand than a complex equation. It was therefore chosen to use a technique that includes graphical modelling. Bayesian networks provide a means of building a logical framework using a simple graphical causal model.
A Bayesian network is built in two stages. The first stage is the graphical model indicating the various nodes and the causal influences between the nodes. The second stage is the population of the probability tables, the quantitative aspect of the model. This second stage form part of the third step of structuring decisions.
Figure 1: Conceptual Model
A first level conceptual decision model for new product development is shown in Figure 1. This conceptual model has the following characteristics: First, it makes provision for different NPD development stage gates and models the potential success return for each of the stages in the NPD cycle. Second, the model groups certain criteria into different factors that influence the NPD Returns. All the criteria can therefore influence each of the NPD stages through the different factors.
A. Completing the Graphical Model
As discussed in section earlier Carbonell-Foulquie´ et al (2004) used a four stage NPD process. The nodes indicating the potential return at the four stage gates are named: New Product Concept Return, New Product Design Return, Production Startup Return, and Keep On Market Return.
The thirteen relevant criteria, grouped into five factors identified by Carbonell-Foulquie´ et al (2004), each forms a node in the network. Arcs from specific criteria to the relevant factors indicate the criteria influencing a specific factor (e.g. Sales Growth and Market Share influence Market Opportunity). Arcs from each factor to each stage gate (Return node) indicate that each factor influence each stage gate.
One assumption made during the development of the causal relationships is that the criteria that influence
a factor do not change between NPD stages. When this information is used the model shown in Figure 2 is the result. For reference purposes the naming is kept the same as that used by Carbonell-Foulquie´ et al (2004). This completes the first phase of the model realisation and the second step in the structuring of decisions.
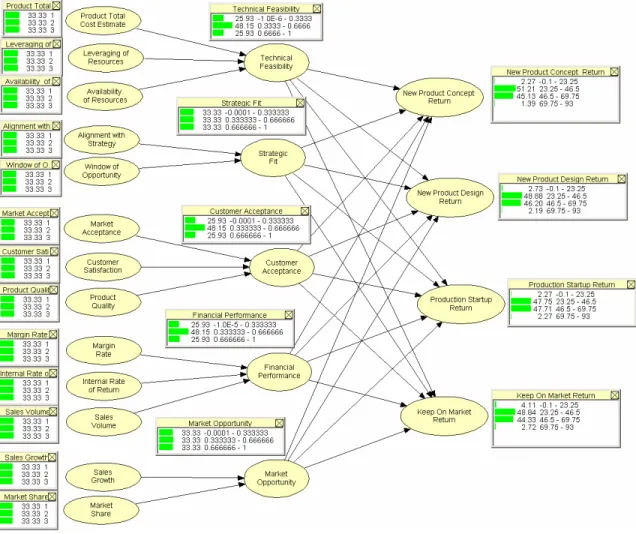
Figure 2: Completed Graphical Model
B. Completing the quantitative aspects of the model:
The third step in structuring decisions is the refinement and precise definition of all the elements of the decision model. This relates to the second step of building a BN. The second step of building the BN is to associate probabilities with the causal relationships defined in the first phase. Where the results of Carbonell-Foulquie´ et al (2004) was used directly to implement phase one, the results require interpretation for the second step of implementation.
C. Defining States
The first action in the quantitative modelling phase is to define appropriate states for each of the nodes.
States can be text, numerical, or numeric intervals. Due to the large number of possible states in the model (explained later) it was decided to use numerical intervals. This made the use of expressions to define the states possible as manually defining all possible states would not be feasible.
Starting with the different criteria it was chosen, in order to keep the initial model simple, for all criteria to have three states 1, 2 and 3. These states can be interpreted appropriately from worst to best for each of the criteria.
The states of the factors are determined by the criteria that influences each state. It was chosen to normalise any contributing criteria so that the factor values will always be between 0 and 1. This eased the understanding of the outputs and the development of the expressions determining the probabilities of the NPD Return nodes. Again it was chosen to have three states for each factor. The factor states indicate intervals for the result of the expression that determine the factor value. The implemented factor states are therefore 0-0.33, 0.33-0.66, and 0.66-1. Again these states can be interpreted appropriately from worst to best for each of the factors.
The states of the NPD Return nodes are determined by the possible states for the factors and the weightings of the relationships. It was found that a granularity of only three states for the NPD Return did not provide sufficient resolution to aid understanding of the results. It was therefore chosen to implement four states for the NPD Return nodes. The numerical values of these states are explained later in this section.
D. Defining Probabilities
The probabilities of nodes that have no causal inputs are determined by means of a prior definition.
Information regarding the prior probabilities for the criteria states is not available. A non-informative prior, which assigns equal probability to all values of the criteria states (Larose 2006), was therefore chosen. In implementing this model in a specific area these probabilities can be tailored to suit the specific environment.
Based on the chosen states (1, 2 or 3 numeric) of each contributing criteria and the relative importance of each criteria, as indicated by Carbonell-Foulquie´ et al (2004), the possible values for each factor is calculated. The expression used for these calculations is shown below:
Technical Feasibility = 0.253807 *(0.4*Cost + 0.78*Leveraging + 0.79*Availability)-0.5 Strategic Fit = 0.320512*(0.78*Strategy + 0.78*Window)-0.5
Customer Acceptance = 0.236966*(0.65*Acceptance+ 0.74*Satisfaction + 0.72*Quality)-0.5 Financial Performance = 0.243902*(0.77*Margin + 0.68*IRR + 0.6*Volume)-0.5
Market Opportunity = 0.337837*(0.84*Growth + 0.64*Market)-0.5
The actual numbers of the states are not important. The three blocks of numbers for each criterion can be interpreted as Low, Medium and High for discussion purposes.
The relative importance of the factors across the NPD cycle as defined by Carbonell-Foulquie´ et al (2004) are used in the Bayesian network to define the influence of each factor on the NPD Return for each stage. The individual importance for each node is not normalised in this instance in order to keep the relative importance across the various NPD stages in tact.
The expressions used to define the NPD Return stages are:
NPD Concept = 23*Technical+18*Strategic+24*Customer+14*Financial+12*Market NPD Design = 28*Technical+12*Strategic+30*Customer+13*Financial+9*Market NPD Production = 24*Technical+11*Strategic+30*Customer+17*Financial+11*Market NPD KeeponMarket = 10*Technical+6*Strategic+41*Customer+19*Financial+15*Market
As previously mentioned three states for the NPD Return nodes did not provide good granularity for analysis. It was therefore chosen to use four states for the NPD Return nodes. The chosen state intervals are 0-23.25, 23.25-46.5, 46.5-69.75 and 69.75-93.
This completes the quantitative realisation of the Bayesian network. Completing the BN model also completes the three steps in structuring a decision. The values and objectives was stated, this was placed within a framework using the graphical causal model of the Bayesian Network, the model was refined and precise definition given to all the elements by completing the BN probability tables.
E. Requisite Modelling
A relevant question in decision modelling is whether the developed model is the appropriate one. Clemen et al (2001) discusses the concept of a requisite model, first introduced by Phillips (1982). A model is requisite when the decision maker’s thoughts about the problem, beliefs regarding uncertainty and preferences are fully developed. Stated differently; a requisite decision model is one that contains the essential elements of the problem from which a decision maker can take action.
The question of being requisite is applied to the developed model. The proposed model includes the thoughts and preferences of a number of successful NPD managers in terms of the criteria and the relative importance of the criteria at the various gates in the NPD process through the survey process performed by Carbonell-Foulquie´ et al (2004). The model allows a decision maker to include beliefs regarding uncertainty in the model by changing the probabilities of the criteria. The model also addresses certain specific decision points (stage gates) in the NPD process and therefore provides action assistance at these points. Based on the above it is argued that the proposed model is a requisite decision model.
3 Model Outputs
To discuss the results of the model outputs, information (also called evidence when dealing with Bayesian Networks) is entered into the model. The changes such evidence effect is then observed.
For ease of discussion the NPD Return states of 0-23.25, 23.25 – 46.5, 46.5 – 69.75, 69.75 - 93 will be referred to as low, medium-low, medium-high and high returns respectively. Where appropriate for the factors and criteria low, medium, and high will also be used to refer to the relevant associated states.
The realised model with no evidence entered, as shown in Figure 3, shows a high probability for medium returns in all three stages. This is based on equal probabilities for the sixteen input criteria.
The benefit of the Bayesian network is that evidence entry is not limited to the input nodes, in this instance the criteria nodes. Evidence can be entered at any of the nodes and will propagate through the network.
Figure 3: Realised Model Showing Monitor Windows.
A. Comparing model results with the base literature
As previously indicated the model is based on the analysis of Carbonell-Foulquíe et al (2004). If the model implementation is correct the same deductions must be possible from the model as was made from the paper results. In this section this is explored.
The paper results (Carbonell-Foulquíe et al 2004) indicate that Strategic Fit is more important in the early stages than later on in the development cycle. For the first NPD Stage (New Product Concept) the model results show a 83.63% required probability for high Strategic Fit. This required probability diminishes for
the later NPD stages and is only 48.64% for the last stage (Keep on Market). Clearly the model results are in line with the paper results indicating higher Strategic fit earlier in the NPD cycle.
The paper results also indicate that Technical Feasibility is more important over the Concept and Design phases (Required probability of High Technical Feasibility of 84% and 88.84% respetively vs 80.82% and 47.10%). The model is in agreement with this but also indicate that technical feasibility also has an important part to play during production start up.
Customer Acceptance is indicated in the paper results as important throughout the process but especially after product launch. The model shows a high probability requirement for Customer Acceptance for all stages (85.80%, 91.52%, 90.62% and 99%) with the highest required level for Customer Acceptance (99%) at the Keep On Market stage, that is after the product has launched. This is in line with the paper results.
The model indicates that Financial Performance importance is fairly constant over the NPD stages. A slight increase towards the later stages is in line with the paper results.
The model was built based on the results from Carbonell-Foulquíe et al (2004). Seeing that the model results, given certain evidence, reflects the same interpretation as the results from the paper study indicate that the model was correctly implemented. It can therefore be stated that the model provides valid results for the importance of criteria influencing new product development over different stages.
B. Evidence Scenario Results
Another useful way of using the model would be to enter achieved states for the various criteria or leave the criteria at the a priori (formed or conceived beforehand) distributions if no evidence is available and then see the influence on the NPD Return for the various stages. Each of these sets can be seen as a scenario. One such scenario is shown in Figure 4.
Figure 4: Realised Model With A Scenario Of Evidence Entered
This scenario could be described as: A new product of medium cost is to be developed. The product is within the company’s niche area and would therefore leverage the company resources very well. It is unknown whether the resource would be available and no evidence of this is entered. The product is very well aligned with the company strategy and the window of opportunity is good but not extremely so. It is not sure how good the market acceptance or customer satisfaction would be. It is clear that a product of high quality can be developed. Calculation shows that the margin rate and IRR would be medium good.
The sales volume can not be predicted at this stage. Both sales growth and market share is predicted to be medium.
The results can be interpreted as: The technical feasibility of the project is high (63% likely) to medium- high (33% likely). The project strategic fit is perfect. Whether the customer acceptance would be high (55% likely) or medium-high (44% likely) is unsure. The project’s financial performance and market opportunity are predicted to be medium.
All this translates into a high probability (almost 80% in all stages) of achieving a medium-high return in all stages, zero probability of achieving only a low return at any of the stage gates, and small probabilities to reach a medium-low (1.68% to 12.26%) or high return (6% to 17%).
The power of the Bayesian network lies in the ability to perform what-if analysis. In the scenario as described above one viable question that could be asked is:
What-if a high level of customer satisfaction could be achieved?
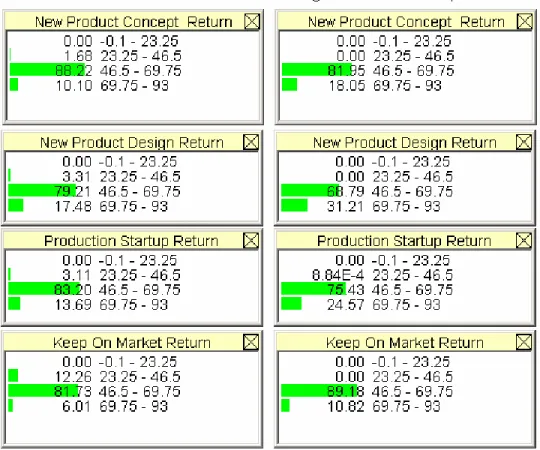
This new what-if evidence is entered and then propagated through the network and provides new information on both the influence on the NPD Returns as well as on what is required on the criteria side to achieve a high customer acceptance. The original and new (with high customer acceptance) NPD returns is shown in Figure 5.
The results can be interpreted as follows: For all stages the probability of achieving a medium-low return becomes zero. This is not a big influence as the original probabilities were already very low. Increasing customer acceptance to high will almost double the probability of indicating a high return at the design stage (from 17% to 31%). The same applies to the Production Startup stage (probability for high return changes from 13% to 24%). Also of significance is that the 12% probability of indicating only a medium- low return for the Keep on Market stage disappears.
Figure 5: NPD Returns With Original And New Customer Acceptance Evidence.
From the results the company could decide that it would be worthwhile to pursue the achievement of a high customer acceptance level. The question would now be what needs to be done in order to achieve this. Changes is only required in the Market Acceptance and Customer Satisfaction criteria. The required changes are actually not that dramatic. For market acceptance only a small change is required (increasing the medium and high probabilities by 7% and decreasing the low probability by 10%). For Customer Satisfaction the low probability need to be eliminated in the process increasing medium to 40%
and high to 60%.
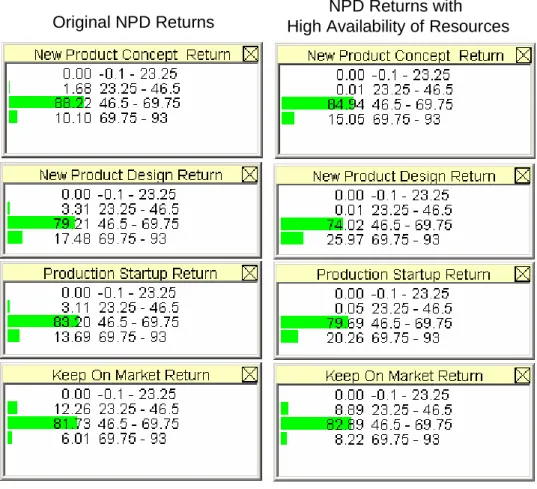
Without the model the company could have argued that ensuring the necessary resources is available or by ensuring high sales volume would be a better approach to ensure a better return. An increase in sales volume actually has no influence as the probability for a medium financial performance remains 100%
and therefore no changes in the indicated NPD Returns are evident.
The actual changes in NPD return with high availability of resources are shown in Figure 6. The changes in NPD Return for this scenario is actually less than what was achieved when increasing Customer Acceptance. The model therefore allows what-if analysis and easy interpretations of the results.
Original NPD Returns NPD Returns with High Availability of Resources
Figure 6: Criteria With Original And New Availability of Resources Evidence.
Another example scenario demonstrating the results of the model would be to ask a question such as:
What would be required for the following NPD Return indications?
Concept Stage : Medium-Low
Design Stage : Medium-High Production Start Up Stage : Medium-High Keep on Market Stage : High
To answer this question the required NPD Return indications is entered into the model as evidence. The result is shown in Figure 7. The indications as shown can now easily be interpreted and the most relevant development strategies implemented.
Figure 7: Model Scenario With Required NPD Returns Indicated
This section has shown the results that can be achieved when partial evidence is entered into the model.
It clearly shows that the model is able to support what-if analyses of various types. There are literally millions of what-if scenarios that can be investigated using the model.
4 Conclusions and Recommendations The objective of this study was to test the following thesis:
Applying decision support techniques (specifically Bayesian Networks) to the area of New Product Development will address some of the primary shortcomings in currently applied approaches and progress towards an integrative approach.
The research approach was one of decision structuring and modelling. The result was a Bayesian Network based model to support new product development decisions over several development stages (stage gates).
This research established a Bayesian Network model based on case study results of successful highly innovative product developments. How Bayesian Networks can be implemented in order to develop a decision support system in the management of new product development domain was shown through the process of realising, implementing and analysing the BN. From this readers may identify others areas of management where BNs may successfully be implemented.
This study contributes a Bayesian Network model based approach to the management area of new product development. This model addresses various aspects of new product development over multiple stages. The model is implemented in software and can therefore be used in a real world setting as well as for theoretical research. The model can deal with quantitative and qualitative input and missing data. The model therefore exhibit the required characteristics indicated earlier.
This study contributes to the field of management in general by showing how a decision support technique such as Bayesian Networks can be implemented to address a real world problem. This study directly contributes to the field of new product development by taking paper results that would be difficult to implement in a real world situation and creating a useable, customisable and extendable decision support model.
This study also opens opportunities for further research. Further models can be developed to support the input criteria and can be added to the model. Further validation of the model can be performed, also including comparisons with methods not based on Bayesian Networks. The implementation of a graphical user interface hiding the complexities of the Bayesian network can be researched. Expanding the states in the model and research regarding various sensitivities in the model can also be conducted. Case studies in various environments can be conducted to specialise the model for specific environments.
5 References
Agena, iRisk, 2004, The intelligent solution for quantifying operational risk, Agena White Paper.
Carbonara, N., Scozzi, B., 2006, Cognitive maps to analyse new product development processes: A case study, Technovation 26: 1233-1243.
Carbonell-Foulquíe, P., Munuera-Alemán, J.L., Rodríguez-Escudero, 2004, Criteria employed for go/no-go decisions when developing successful highly innovative products, Industrial Marketing Management, 33:307- 316.
Chen, H.H, Lee, A.H.I., Tong, Y., 2006, Analysis of new product mix selection at TFT-LCD technological conglomerate network under uncertainty, Technovation, 26: 1210-1221.
Clemen, R.T., Reilly, T., 2001, Making hard decisions with Decision Tools, Duxbury: Pacific Grove.
Coldrick, S., Longhurst, P., Ivey, P., Hannis, J., 2005, And R&D options selection model for investment decisions, Technovation, Vol. 25:185-193.
Cooper, R.G., Edgett, S.J., Kleinschmidt, E.J., New Product Portfolio Management: Practices and Performance, 1999, J Prod Innov Manag, Vol. 16:333-351.
Cooper, R.G., Edgett, S.J., Kleinschmidt, E.J., 2001a, Portfolio Management – Fundamental to New Product Success, Working Paper No. 12.
Cooper, R.G., Edgett, S.J., 2001b, Portfolio Management for New Products: “Picking the winners”, Working Paper No 11, Product Development Institute.
Dickinson, M.W., Thortnton, A.C., Graves, S., 2001, Technology Portfolio Management: Optimizing interdependent projects over multiple time periods, IEEE Transactions on Engineering Management, Vol.
48:518-527.
Doctor, R.N., Newton, D.P., Pearson, A., 2001, Managing uncertainty in research and development, Technovation, Vol. 21:79-90.
Dorner, S., Shi, J., Swayne, D., In Press, Multi-objective modelling and decision support using a Bayesian network approximation to a non-point source pollution model, Environmental Modelling & Software, Vol. 22:211- 222.
Irani, A., Love, P.E.D., Cengiz, K., 2002, Applying concepts of fuzzy cognitive mapping to model: The IT/IS investment evaluation process, International Journal of Production Economics, Vol. 75:199-211.
Jolly, D., 2003, The Issue of Weightings in Technology Portfolio Management, Technovation, Vol. 23:383-391.
Khalil, T., 2000, Management of Technology: The key to competitiveness and Wealth Creation, McGraw Hill.
Larose, D.T., 2006, Data Mining: Methods and Models, Wiley:USA.
Liao, S., 2005, Technology Management Methodologies and Applications A literature review from 1995 to 2003, Technovation, Vol. 25:381-393.
Miller, W.L., Morris, L., 1999, Fourth Generation R&D: Managing knowledge, technology and innovation, Wiley.
Phaal, R., Farrukh, C.J.P., Probert, D.R., 2006, Technology Management Tools: concept, development and application, Technovation, Vol. 26:336-344.
Phillips, L.D., 1982, Requisite Decision Modelling, Journal of the Operational Research Society, Vol. 33:303- 312.
Pidd, M., 1996, Tools for thinking: Modelling in Management Science, Wiley.
Roussel, P.A., Kamal, N.S., Tamara, J.E., 1991, Third Generation R&D: Managing the link to Corporate Strategy, Harvard Business School Press.
Wheelwright, S.C., Clark, K.B., 1992, Revolutionizing Product Development: Quantum Leaps in Speed, Efficiency, and Quality, The Free Press.