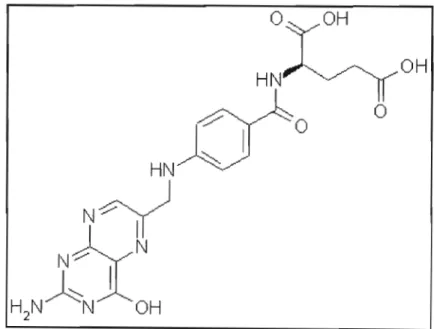
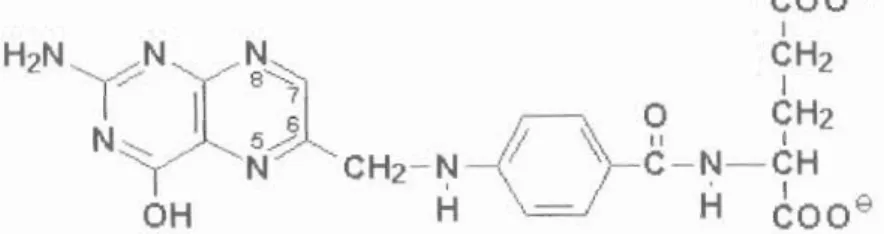
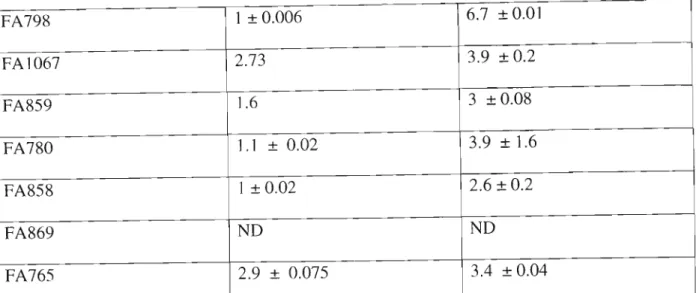
The chemical structure of folic acid shows different positions, 7 and 8 carry hydrogens in dihydrofolate (DHF), positions 5-8 carry hydrogens in tetrahydrofolate (THF). Concentration of folic acid and folinic acid in !lg/rnl detected by HPLCUV in blood serum.
INTRODUCTION
FOLIC ACID IN BIOLOGICAL MATERIALS
LITERATURE REVIEW INTRODUCTION
STRUCTURE OF FA .1 NOMENCLATURE
FUNCTION OF FOLIC ACID 1 Active form of folic acid
SOURCES
FA REQUIREMENTS .1 Folic acid derivatives in food
ANALYSIS AND DETECTION OF FOLATES
OPTIMISATION OF THE HIGH PERFORMANCE LIQUID CHROMATOGRAPHY FOR FOLIC ACID ANALYSIS
INTRODUCTION .1 Resolution
RESULTS AND DISCUSSION
CONCLUSION
DETERMINATION AND QUANTIFICATION OF FOLIC ACID IN BLOOD SERUM USING HIGH PERFORMANCE LIQUID CHROMATOGRAPHY
METHOD AND MATERIALS .1 Sample Collection
DISCUSSION 4.5 CONCLUSION
ANALYSIS OF FOLIC ACID IN MAIZE SAMPLE USING GRADIENT ELUTION HIGH PERFORMANCE LIQUID CHROMATOGRAPHY
INTRODUCTION
MATERIALS AND METHODS .1 Chemicals and reagents
GENERAL DISCUSSION AND CONCLUSION 7. REFERENCES
APPENDIX
INTRODUCTION
Optimizing an HPLC method for the analysis of folic acid and its derivatives in biological materials. Apply the optimized HPLC method to the detection of folates in biological materials; .. unfermented and fermented cornmeal and human serum.
LITERATURE REVIEW
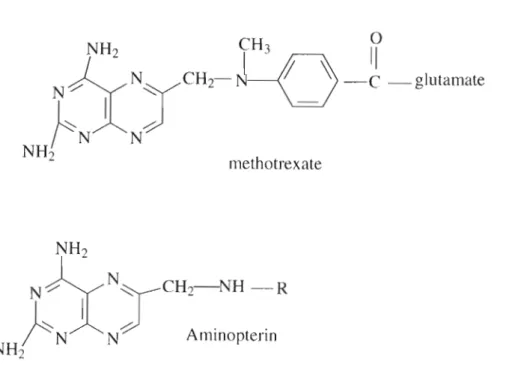
STRUCTURE OF FOLIC ACID
- NOMENCLATURE
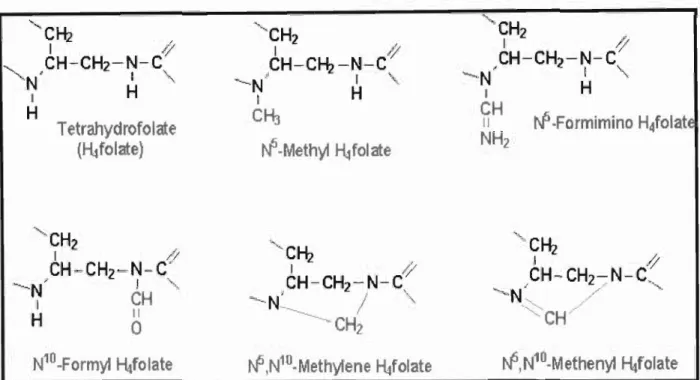
Tetrahydrofolate (HtfoIate)
FUNCTION OF FOLIC ACID
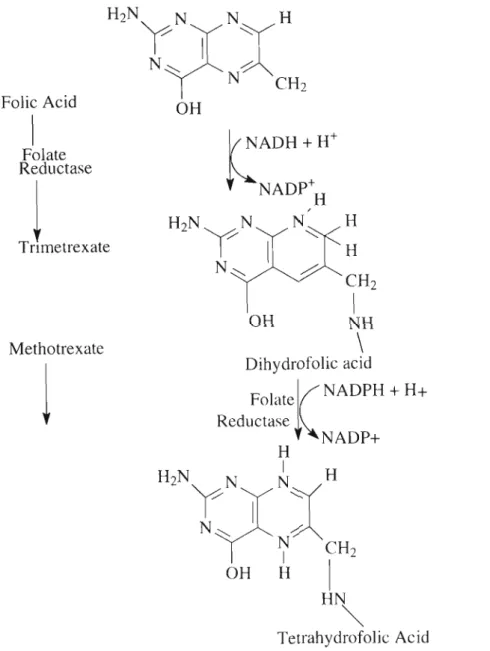
- Active form of folic acid
- Folic acid deficiency
Signs of folate deficiency are therefore seen in rapidly dividing cells, particularly in the bone marrow, and folate deficiency typically manifests as megaloblastic anemia (Stefania et al., 1999). Dietary derivatives are cleaved by special intestinal enzymes to monoglutamyl folate for absorption.
NADP+H
FOLIC ACID REQUIREMENTS
- Folic acid derivatives in food
- Absorption
- Food extraction
Das Sarmata et al., (1995) demonstrated the efficiency of ε-aminocaproic acid-modified bovine serum albumin (BSA) as a carrier protein for raising highly specific antibodies against it. The development and validation of rapid procedures such as HPLC were reported to be in the development phase in 1993 (Finglas et al., 1993).
OPTIMISATION OF HIGH PERFORMANCE LIQUID CHROMATOGRAPHY FOR FOLIC ACID ANALYSIS
INTRODUCTION
- Resolution
- Liquid chromatography separation modes
- Ion-exchange chromatography
- Ion-pair chromatography
- Ion chromatography
- Normal phase
- Principle of detection .1 Fluorescence detection
- Ultraviolet (UV) detection
N=16 (tRIW)2 .The number of plates can be increased by increasing the column length (L) to a limit as length increases with peak broadening (Scott, 1977). The stationary phase contains ionic groups (eg NR3+ or SO3-) which interact with the ionic groups of the sample molecules. Sample compounds are better retained by the reversed-phase surface, the less water-soluble (i.e., the more non-polar) they are.
The temperature and the nature of the mobile phase are the most important factors in optimization. In liquid chromatography, the retention characteristics of sample components in a given column are highly dependent on the nature of the chemical composition of the mobile phase. A small change in the composition of the liquid mobile phase can cause a drastic change in sample retention.
METHODS AND MATERIALS .1 Reagents
- Analysis for the spiked serum sample with folic acid and folinic acid
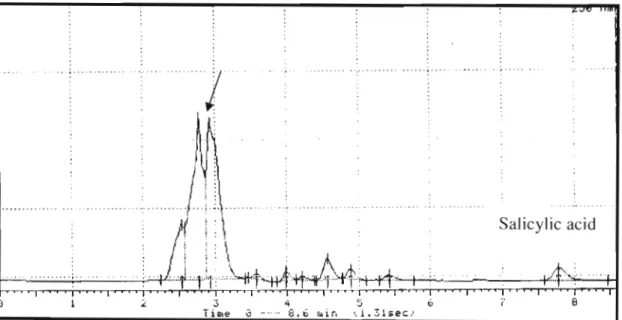
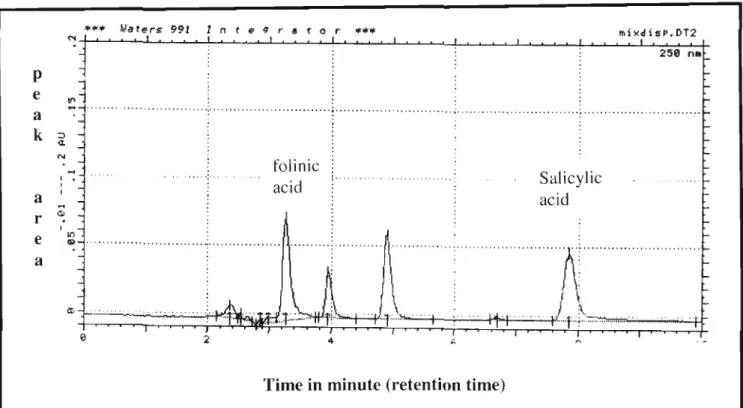
Folic acid and folinic acid compounds are always treated under dim light conditions as these compounds are degradable by light. Folic acid and folinic acid standard solutions were filtered through Whatman nylon filters (0.45~m) before being injected into the column. The undivided standard of folic acid and folinic acid in the chromatogram is indicated by an arrow, the other two peaks are solvent peaks.
The chromatogram mixture of folic acid and folinic acid analyzed by HPLC/FL showed a peak. Standard preparation of folic acid and folinic acid according to the method adapted from Masahiro and Kazuo, (1986) was not efficient under HPLCIUV. Identification of folic acid and folinic acid is possible with isocratic elution at a wavelength of 250 nm and a flow rate of 1 ml/min.
INTRODUCTION
- Reagents and equipment
- Sample preparation (adapted from Patrick et al., 1996)
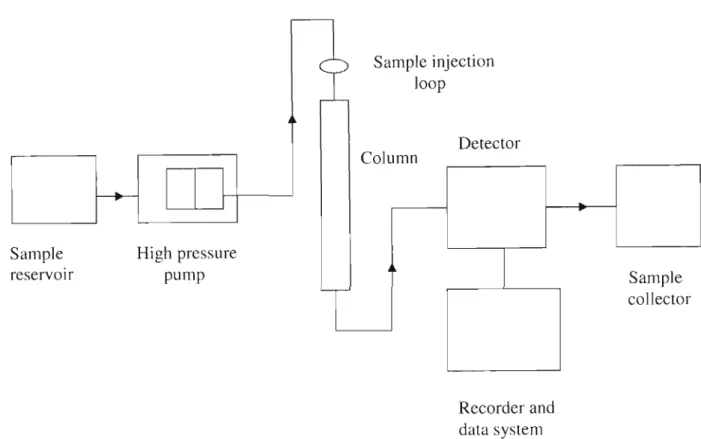
- High performance liquid chromatography
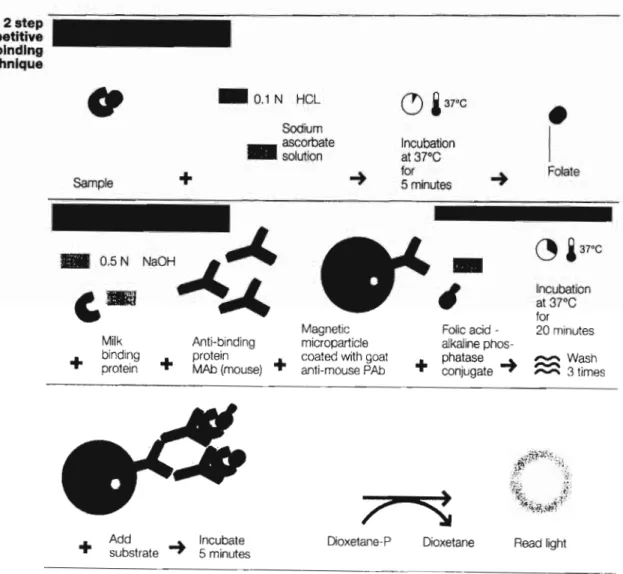
- Analysis of FA using chemiluminescence method
DETERMINATION AND DETERMINATION OF FOLIC ACID IN BLOOD SERUM BY HIGH-PERFORMANCE LIQUID CHROMATOGRAPHY WITH UV DETECTION AND CHEMILUMINESCENCE IMMUNOTALIZATION. Currently, little information is available for the determination of folic acid in serum using UV-coupled HPLC. Folate compounds: Folic acid (pteroylglutamic acid), folinic acid (calcium salt), ascorbic acid, sodium ascorbate, dipotassium hydrogen phosphate (K2HP04) were all purchased from Sigma (St Louis, USA).
Quantification of folic acid and folinic acid was performed with a Waters Liquid Chromatograph (HPLC) equipped with a 600E system controller and a 991 photodiode array detector combined with 991 software. For easy identification of folic acid and folic acid standard peaks, solutions of these compounds were always checked before analyzing any serum sample. Serum folic acid concentration was determined using the equation in Appendix 3, as mentioned earlier in Chapter 3.
RESULTS
Serum folic acid identification was based on retention time and compared to the standard folic acid peak in (Figure 4.2b). In Figure 4.2a, the folic acid peak is well separated from the other peak components of the sample, making identification easy. A negative correlation coefficient of (-0.455) indicates that as one variable increases, the other decreases and vice versa.
The difference in sensitivity between HPLC and immunoassay: chemiluminescence in the detection of folic acid is shown in Figure 4.3. The minus-number correlation coefficient obtained in this study showed an inverse relationship of serum folic acid analysis between the HPLC method and the chemiluminescence assay method, resulting in poor agreement.
DISCUSSION
Such differences could be accepted because folic acid analyzed by HPLC is the parent compound for all forms of folate. Different researchers measure different forms of folic acid in human serum using different techniques. A change is possible in the extraction of the sample so that both folic acid and folic acid can be detected.
None of the mentioned antioxidants were used in this study, deproteinization of the serum sample with perchloric acid did not affect the determination of folic acid. The concentration of folic acid in human serum was reported in !g/ml, this unit is comparable to the results obtained in this study, especially using HPLC. The study of folic acid and its derivatives is still relevant for most researchers, but our goal to optimize the analysis method was successful with an early elution time of the compound of interest, less than 4 minutes.
CONCLUSION
ANALYSIS OF FOLIC ACID IN MAIZE MEAL SAMPLES USING GRADIENT ELUTION HIGH PERFORMANCE LIQUID CHROMATOGRAPHY
Extraction and cleanup
- Sample preparation (method adapted from Liisa et al., 1996)
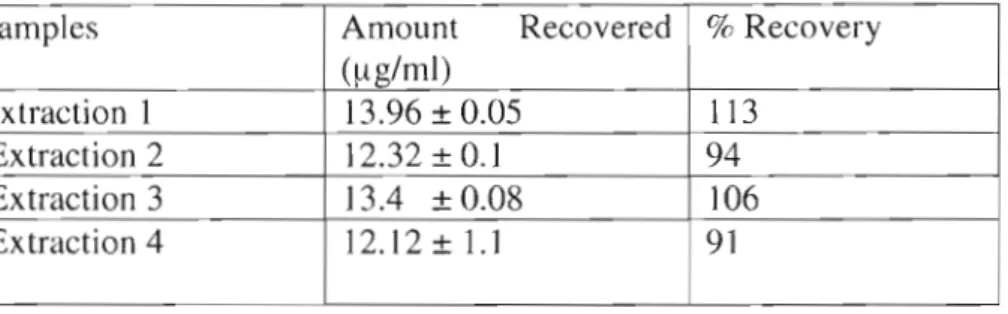
- Spiked sample
Samples (1.5 g) of five different brands of cornmeal (purchased in a local supermarket) were weighed into 5 x 50 ml Beckman tubes (sample was 1 x 4 per brand), homogenized in 6-8 ml extraction buffer (75 rnM K2HP04 ) containing 52mM ascorbic acid. The extract was transferred into small vials adjusted to pH 4.9 with acetic acid, followed by addition of 0.8ml of HK-conjugase for deconjugation of folic acid. Finally, folic acid was eluted with 2.5ml of 0.1 M sodium acetate containing 10% (w/v) sodium chloride and 1% (w/v) ascorbic acid and was then kept frozen until the HPLC analysis.
Fermented cornmeal was prepared from each brand of cornmeal by boiling 400ml of water in a boiling vessel, followed by adding cornmeal (40g of cornmeal dissolved in 100ml of water) to the boiling water. 5 mL to 6 mL of fermented cornmeal was transferred to a 50 mL Beckman tube and extracted as described above. One brand of maize flour (lnyala maize flour, Premier Foods, Sandton, SA) was selected in which (1.6 g x 3) maize flour was placed in three Beckman tubes mixed with (6.25 ~g/ml ) of folic acid. acid to assess the suitability of the extraction method, which in turn increases the reliability of peak identification.
HPLC analysis
Sample was passed through slowly and the column was washed again with (2 x 1.5 ml) conditioning buffer. The suspension was boiled for 10 minutes, allowed to cool at room temperature and then transferred to a fermented container followed by the addition of sugar (3 g). Concentration of folic acid measured in spiked sample - concentration of folic acid measured in sample without spike) / (concentration of folic acid added in spiked sample) X 100.
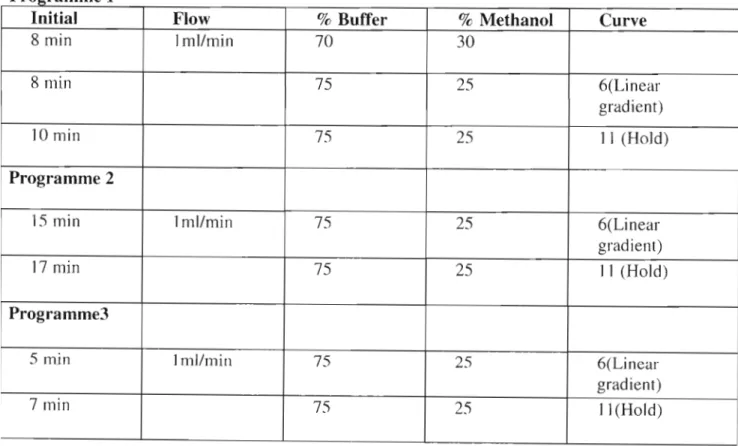
2.2) which was modified to (pH 2.5) was used for the separation of folic acid in corn flour samples. The gradient started at 10% acetonitrile with a delay of 4 min, after which the percentage of acetonitrile was increased to 24% within 8 min and again to 10% after 3 min, the flow rate was set at 0.8 mL/min.
RESULTS
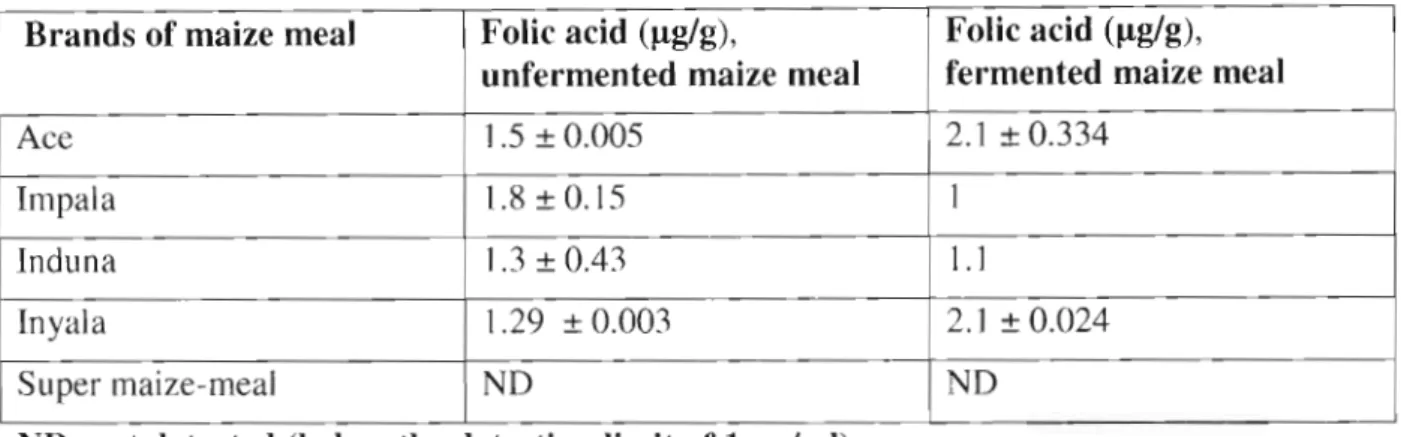
The elution time of the folic acid peak from the sample in Figure 5.2 was compared to the standard FA peak (Figure 5.2a), in which the samples showed a small folic acid peak with a retention time comparable to that of pure standard folic acid. An increase in folic acid concentration was observed in fermented corn flour prepared from inyala and ace corn flour and a decrease in fermented corn flour prepared from impala and induna corn flour, while none was detected in the super corn flour brands. The lowest concentration of standard folic acid, shown in Figure 5.2a, was chosen to avoid false sample results that could occur if the highest standard concentration (1Oflg/ml) had been injected.
DV detection took place at 290 nm, mobile phase (ACN: 30 mM K2HPO4), flow rate of 0.8 m11 min, gradient elution has allowed good identification of the folic acid peak without traces of impurities and interfering peaks after 10.80 min.
DISCUSSION
However, precautions were taken during this study, but such factors seem to remain a challenge for further research to discover more folic acid derivatives. Again, it could be a challenge to study in detail the behavior of some components in maize flour during fermentation, which could have a major impact on the stability of folic acid and folinic acid, as food fermentation continues to be important especially in resource-poor developing countries. restricts the use of techniques such as vitamin fortification. In this study, an increase in folic acid levels in all brands of fermented cornmeal was expected because an increase in vitamin B12, folic acid and also the synthesis of some antibiotics was reported in fermented foods (Van Veen and Steinkraus, 1970). ).
Gregory et al., (1990) reported incomplete extraction of folic acid from some food, which they attributed to interaction of folate with insoluble residues or retention by physical confinement. The aim of this study was 2-fold: First, to detect and analyze folic acid and folic acid content in maize flour, as it is the stable food for the majority of the South African population, and second, to optimize the HPLC method for the analysis of folic acid in cornmeal. At this stage, only the determination of folic acid was possible using the method described here, the use of the HPLC method for the analysis of corn flour is satisfactory and can always be improved to excellent quality.
CONCLUSION
However, during this study it was possible to achieve a chromatographic specificity for the identification of folic acid and the determination of folic acid content in both cornmeal and human serum. The assessment of losses of folic acid and its derivatives during sample preparation is still incomplete. Food Standard: changing the identity standard for the fortified cereal product to require the addition of folic acid.
Schreiber, c., (1981) Cryoprotected LacobaciLLus Casei: an approach to standardizing the microbiological assay of folic acid in serum. Lane, H.W; Nillen, J.L and Kloeries, V.L (1995) Folic acid content of thermostabilized and freeze-dried space shuttle foods. Koivistoinen and Pertti Varo., (1996) Improvements in the analysis of reduction of folate monoglutamates and folic acid in foods by high performance liquid chromatography, Journal of Agriculture Food Chemistry.
Vahteristo, L.T., Ollilainen, V., Varo, P., (1996) Improvements in the analysis of reducing folate monoglutamates and folic acid in foods by high performance liquid chromatography. 1984) High-performance liquid chromatographic determination of the distribution of naturally occurring folic acid derivatives in rat liver. 2000) Erythrocyte folate assay: Saponin added during lysis of whole blood may increase apparent folate concentrations, depending on hemolysate pH.