Ph sta
D
hysico- ability s
Dissertation s
School
chemic studies
na
submitted in
of Chemistr
Superviso Co-Super
cal anal of thei atural a
Veres
fulfilment o Mast ry, University
or:
rvisors:
M
lysis of ir blend
antioxi
by
sha Duk
of the academ ter of Scienc
y of KwaZu
Prof J. Cat Mr Ajay B Prof Nelso
March 2012
transfo ds with
idants.
khi
mic requirem ce
ulu-Natal, W
therine Ngila Bissessur
on Ijumba
ormer o synthe
ments for the
estville, Dur
a
oil and etic and
degree of
rban
d
Physico-chemical analysis of transformer oil and stability studies of their blends with synthetic and
natural antioxidants.
by
Veresha Dukhi
2012
Dissertation submitted in fulfilment of the academic requirements for the degree of Master of Science
School of Chemistry, Faculty of Science and Agriculture, University of KwaZulu-Natal, Durban This dissertation has been prepared according to Format 3 as outlined in the guidelines from the Faculty of Science and Agriculture which states:
This is a dissertation in which the chapters are written as a set of discrete research papers with an overall introduction, literature review, a general experimental and conclusions chapters. All the manuscript-formatted chapters have already been submitted in international peer-reviewed journals.
As the Candidate's Supervisor I have approved the final printing of this dissertation Name: Prof J. Catherine Ngila
___________________
Signature:
___________________
Date: 13 March 2012
III
DECLARATION 1- PLAGIARISM
I, Veresha Dukhi, declare that the experimental work described in this dissertation was carried out at the School of Chemistry, University of KwaZulu-Natal, Westville campus, between March 2010 and December 2011, under the supervision of Mr. A. Bissessur, Prof. J. C. Ngila and Prof.
N. M. Ijumba and that:
1. The research reported in this dissertation, except where otherwise indicated, is my original research.
2. This dissertation has not been submitted for any degree or examination at any other university.
3. This dissertation does not contain other persons’ data, pictures, graphs or other information, unless specifically acknowledged as being sourced from other persons.
4. This dissertation does not contain other persons' writing, unless specifically
acknowledged as being sourced from other researchers. Where other written sources have been quoted, then:
a. Their words have been re-written but the general information attributed to them has been referenced
b. Where their exact words have been used, then their writing has been placed in italics and inside quotation marks, and referenced.
5. This dissertation does not contain text, graphics or tables copied and pasted from the Internet, unless specifically acknowledged, and the source being detailed in the dissertation and in the References sections.
Signed
_______________________________
Veresha Dukhi
IV
DECLARATION 2- PUBLICATIONS
V. Dukhi, A. Bissessur*, J. C. Ngila and N. Ijumba. (2011). Proceedings of XVII International Symposium on High Voltage Engineering (ISH), Hannover, Germany, August 22-26, 2011. E- 029, p294.
I performed the research, data analysis and write-up. All other co-authors are my supervisors who provided guidance and were involved in editing the manuscript.
V. Dukhi, A. Bissessur*, J. C. Ngila and N. Ijumba. (2011). Physico-chemical properties of transformer oil blends with antioxidants extracted from turmeric powder., World Academy of Science and Engineering. (submitted).
I performed the research, data analysis and write-up. All other co-authors are my supervisors who provided guidance and were involved in editing the manuscript.
V. Dukhi, A. Bissessur*, J. C. Ngila and N. Ijumba. (2011). The determination of kinetic parameters of transformer oil and its blends by thermal analysis., South African Journal of Science. (submitted).
I performed the research, data analysis and write-up. All other co-authors are my supervisors who provided guidance and were involved in editing the manuscript.
Signed:………
V
ABSTRACT
This study is focused on the analysis of transformer oil commonly used in South African transformers and the characterisation of the blends of these oils with either synthetic antioxidants or those extracted from natural sources.
The virgin naphthenic based uninhibited transformer oil was shown to have no acidic or saponifiable constituents. Although the oil used in this study is naphthenic based it was found to contain bicyclic compounds identified as tetralin (aromatic) and decalin by GC-MS. The oils were void of typical wear metals and only additive metals/non-metals were present. The blending of transformer oils with synthetic antioxidants was successful as confirmed by 1H NMR, 13C NMR and FT-IR data. The blending showed increased antioxidant activity of the oils as well as thermal stabilities (DPPH assay and TGA respectively). Apparent activation energy for the decomposition reaction was determined by means of the Ozawa, Flynn and Wall (OFW) and Kissinger models. The apparent activation energy for BHT-B, DBP-B and VO were found to be 57.0, 63.7 and 69.3 kJ mol-1, respectively for 10% mass conversion obtained from TGA data (OFW model). The dissipation factor for the oil blends was established to be favourably lower than that of unblended oils; however an undesirable decrease in the dielectric breakdown voltage of the blends was observed (16, 26 and 50 kV for BHT-B, DBP-B and VO respectively).
The blending of transformer oil with synthetic antioxidants is a common practice, however greener approaches are always favoured. In this study, a greener approach was employed by blending the transformer oil with turmeric plant extract in an effort to improve the oil’s performance. Turmeric is known for its antimicrobial, antioxidant and anticarcinogenic properties. Solvent extraction of turmeric powder and subsequent blending into transformer oils, revealed the dissolution of 5 components from turmeric into the oil, viz., curcumene, sesquiphellandrene, ar-turmerone, -turmerone and -turmerone (curlone). In this work, we analysed novel turmeric-oil blends in terms of oxidation and thermal stability in comparison to that of virgin transformer oil. The DPPH assay confirmed that addition of these blends into the oil increased its ability to scavenge the free radical DPPH. Thermogravimetric analysis showed an increase in thermal stability when compared to that of virgin unblended oil. Evidently blending of synthetic antioxidants/turmeric extract has potential to enhance the performance and increase the life-span of transformer oils.
VI
ACKNOWLEDGMENT
First and foremost I would like to thank my supervisors, Prof. Ngila, Mr Bissessur and Prof.
Ijumba. This research work would have not been possible if not for your effort. Thank you for your patience, advice, criticism and your immense pool of knowledge. I could have not chosen a better collaboration for the supervision of this research project.
Prof. Corrine Greyling has my appreciation for all the advice that she has offered throughout this study.
This work would not have been possible, if not for the University of KwaZulu-Natal, which allowed me to register for the MSc degree, ESKOM and the National Research Foundation for funding the project and bursary respectively.
I am thankful to Leon Chetty, Clemant Simane and Isaac Serukenya from the High Voltage Direct Current (HVDC) centre, without whose assistance the electrical testing would have not been possible. I would also like to thank Aaron Mutambo and Charlain King from the HVDC centre for the project administration.
I wish to thank all the technical and support staff of the School of Chemistry (UKZN), in particular, Mr G. Moodley, Mrs T. Naidoo, Mr. N. Broomhead, Mrs. Z Ally, Mrs V. Reddy, Mr.
D. Jagjivan, Mr. L. Murugas and Mrs C. Magwaza. I am also grateful to Mr A. Ramsaroop (DUT) who assisted with thermal analysis and Mr P. Forder (glassblowing services-PMB)
I wish to acknowledge Venkat, Thashni (CRG-UKZN), Dorothy (natural products group-UKZN) and Darrel Naidu (Research assistant) for all the help and assistance.
Many thanks to Prof. Yeboah and Dr. Schilongo from the University of Botswana for all the suggestions that they have given me during a research collaboration visit.
VII
To my mum, dad, brother and extended family, thanks for all the moral support and motivation that you have given me over the years. Your encouragement and sacrifice has been greatly appreciated.
To my group members, Joseph, Richard, Stephen, Banele, Isaac, John and Philiswa, thank you for your interesting debates and willingness to lend a hand in whichever way possible.
Lastly to my friends that have always been there Shaeen, Santosh, Lee, Mageshni, Saisha, Lynette, Michael, Dunesha, Mohamed, Ebrahim and Leeven thank you for all the motivation, fun times and much needed laughter.
It goes without saying; I am forever thankful to the Grace of God.
VIII
DEDICATION
This dissertation is dedicated to my family for your love and support.
“You must be the change you wish to see in the world”…Mahatma Gandhi
IX
TABLE OF CONTENTS
DECLARATION 1- PLAGIARISM ... III
DECLARATION 2- PUBLICATIONS ... IV
ACKNOWLEDGMENT ... VI
DEDICATION ... VIII
TABLE OF CONTENTS ... IX
LIST OF TABLES ... XIV
LIST OF FIGURES ... XV
LIST OF STRUCTURES ... XVII
LIST OF SCHEMES ... XVIII
LIST OF ABBREVIATIONS ... XIX
CHAPTER 1 ... 1
INTRODUCTION ... 1
1.1 PROBLEM STATEMENT... 1
1.2 HYPOTHESIS ... 2
1.3 AIM OF THE STUDY ... 2
1.3.1 Specific Objectives of the Study ... 2
1.4 DISSERTATION OVERVIEW ... 3
REFERENCES ... 4
CHAPTER 2 ... 6
LITERATURE REVIEW ... 6
2.1 AN OVERVIEW OF TRANSFORMERS ... 6
2.2 TRANSFORMER INSULATION USING OILS ... 8
X
2.3 IMPACTS OF STRESS ON TRANSFORMER OIL ... 10
2.4 ANTIOXIDANTS/ADDITIVES ... 16
2.5 TURMERIC EXTRACTS ... 23
2.6 INSTRUMENTATION FOR CHARACTERISATION AND ANALYSIS ... 27
2.6.1 Nuclear Magnetic Resonance (NMR), Fourier Transform-Infra-Red (FT-IR) and Elemental Analysis ... 27
2.6.2 Inductively Coupled Plasma-Optical Emission Spectroscopy (ICP-OES) ... 28
2.6.3 Ultra-Violet/Visible (UV/Vis) Spectroscopy ... 28
2.6.4 Gas Chromatography-Flame Ionization/Mass Spectrometry (GC-FID/MS) ... 28
2.6.5 Thermal Analysis (TA) ... 29
2.7 PHYSICO-CHEMICAL CHARACTERISATION METHODS FOR VIRGIN TRANSFORMER OILS AND TRANSFORMER OIL BLENDS ... 29
2.7.1 Acid number, Saponification value and Iodine value ... 29
2.7.2 Metal/Non-metal Analysis ... 30
2.7.3 Viscosity, Water and Hydroperoxide content ... 31
2.7.4 Antioxidant assay ... 33
2.7.5 Thermal analysis ... 33
2.7.6 Dissipation factor and Dielectric Breakdown Voltage testing ... 33
REFERENCES ... 35
CHAPTER 3 ... 40
EXPERIMENTAL ... 40
3.1 INSTRUMENTATION ... 42
3.2 REAGENTS ... 42
3.3 EXPERIMENTAL PROCEDURES ... 43
3.3.1 Instrumental Analysis: Characterisation techniques ... 43
3.3.2 Viscosity and Water Content ... 46
3.3.3 Saponification value ... 46
3.3.4 Iodine value ... 46
3.3.5 Acid Number ... 47
3.3.6 Dissipation Factor and Dielectric Breakdown testing ... 47
XI
3.3.7 UV digestion ... 48
3.3.8 Extraction of turmeric components ... 48
3.3.9 Separation of turmeric extract components using thin layer chromatography (TLC) ... 48
REFERENCES ... 48
CHAPTER 4 ... 50
CHARACTERISATION OF A NAPHTHENIC BASED UNINHIBITED VIRGIN TRANSFORMER OIL AND THE USE OF SYNTHETIC ANTIOXIDANTS. ... 50
ABSTRACT ... 50
4.1 INTRODUCTION ... 51
4.2 METHODS AND MATERIALS... 53
4.2.1 Saponification value ... 53
4.2.2 Iodine number ... 53
4.2.3 Total acid number (TAN) ... 53
4.2.4 Metal/non-metal content ... 53
4.2.5 Thermal Gravimetric Analysis ... 54
4.2.6 Water content ... 54
4.2.7 Viscosity ... 54
4.2.8 Hydroperoxide content... 54
4.2.9 13C and 1H NMR, Infrared Spectroscopy and Elemental analysis ... 55
4.2.10 GC-MS analysis (virgin oil) ... 55
4.2.11 Dissipation factor and Dielectric Breakdown Voltage (DBV) ... 55
4.2.12 DPPH assay [7]... 55
4.2.13 Antioxidant (AO) monitoring ... 56
4.3 RESULTS AND DISCUSSION... 56
4.4 CONCLUSION ... 66
ACKNOWLEDGEMENTS ... 66
REFERENCES ... 66
CHAPTER 5 ... 68
XII
PHYSICO-CHEMICAL PROPERTIES OF TRANSFORMER OIL BLENDS
WITH ANTIOXIDANTS EXTRACTED FROM TURMERIC POWDER .... 68
ABSTRACT ... 68
5.1 INTRODUCTION ... 69
5.2 METHODS AND MATERIALS... 70
5.2.1 AO Extraction from Turmeric Powder with suitable solvents... 70
5.2.2 Thin Layer Chromatography (TLC) ... 70
5.2.3 GC-MS Analysis ... 71
5.2.4 DPPH Assay ... 71
5.2.5 Thermogravimetric Analysis (TGA) ... 71
5.2.6 Dissipation Factor Test ... 71
5.3 RESULTS AND DISCUSSION... 72
5.4 CONCLUSION ... 77
ACKNOWLEDGEMNTS ... 77
REFERENCES ... 78
CHAPTER 6 ... 80
THE DETERMINATION OF KINETIC PARAMNETERS OF TRANSFORMER OIL AND ITS BLENDS BY THERMAL ANALYSIS ... 80
ABSTRACT ... 80
6.1 INTRODUCTION ... 81
6.2 METHODS AND MATERIALS... 82
6.3 RESULTS AND DISCUSSION... 84
6.3.1 Determination of the decomposition activation energy ... 84
6.3.2 Electrical properties of the oils ... 89
6.4 CONCLUSION ... 91
ACKNOWLEDGEMENTS ... 91
REFERENCES ... 92
CHAPTER 7 ... 94
CONCLUSIONS AND FUTURE WORK ... 94
XIII
7.1 CONCLUSIONS... 94 7.2 FUTURE WORK ... 94
APPENDICES ... 96
XIV
LIST OF TABLES
Table 1 Summary of the GC-MS results of turmeric fractions. ... 26 Table 2 Wear metals and additive elements that are generally found in transformer oil samples.
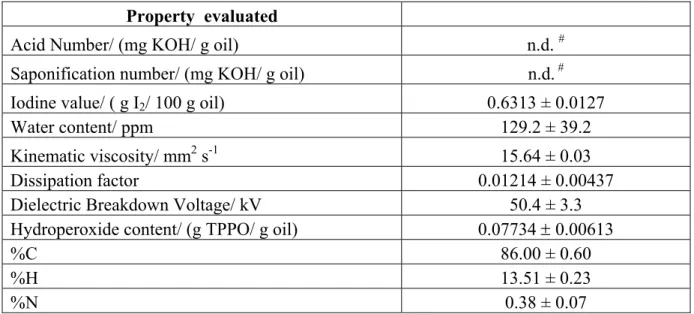
... 31 Table 3 Properties of naphthenic based uninhibited virgin transformer oil (n.d.# = not detected).
... 56 Table 4 Metal/non metal content of a naphthenic virgin transformer oil. ... 57 Table 5 Components of a naphthenic based uninhibited virgin transformer oil and their retention times identified by GC-MS. ... 61 Table 6 Functional groups of compounds in blended virgin transformer oils from FT-IR spectra.
... 62 Table 7 Identification of functional groups of compounds in blended virgin transformer oils from
1H and 13C NMR spectra. ... 62 Table 8 GC column conditions for the separation of extract-oil blends. ... 71 Table 9 Mass spectrometric data of extract-oil blends showing the different components. ... 73 Table 10 Activation energies calculated for oil and oil blends at different conversion values using the OFW model. ... 86 Table 11 Activation energy, Arrhenius factor (Z) and rate constant (K) for oil and oil blends calculated using the OFW method and DSC data. ... 87
XV
LIST OF FIGURES
Figure 2.1 Depiction of a typical GSU, three phase transformer ... 6
Figure 2.2 Representation of primary and secondary windings of a transformer showing the induction of voltage by electromagnetic flux. ... 7
Figure 2.3 Circuit diagram depicting the functioning of the Tettex 2820 apparatus. Adapted from L & tan δ Measuring Bridge Version 1.8 Operating Instructions Haefely Test. ... 34
Figure 4.1 Structure of AO, 2,6-di-tert-butyl-4-methylphenol (BHT). ... 52
Figure 4.2 Structure of AO, 2,6-di-tert-butylphenol (DBP). ... 52
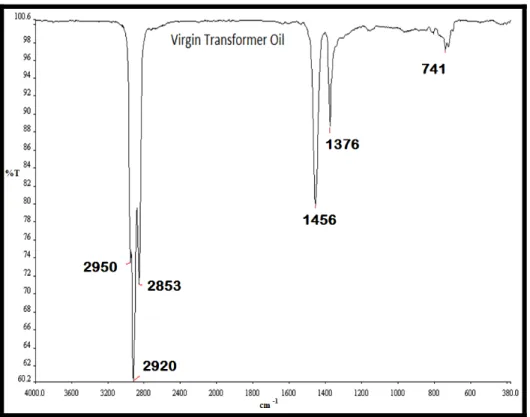
Figure 4.3 FT-IR spectra of naphthenic based virgin transformer oil. ... 58
Figure 4.4 1H NMR of virgin transformer oil. ... 59
Figure 4.5 13C NMR of virgin transformer oil. ... 59
Figure 4.6 GC spectra of a naphthenic based virgin transformer oil. ... 60
Figure 4.7 Change in concentration of DPPH (per 100 g of virgin transformer oil/blended transformer oil) monitored over a 30 minute period. ... 63
Figure 4.8 TGA of virgin transformer oil and AO-oil blends. ... 64
Figure 4.9 Concentration of BHT and DBP over a 24 hour UV exposure period. ... 65
Figure 5.1 A gas chromatogram of an extract-oil blend. The labeled peaks show the constituents of turmeric extract which blended with the virgin transformer oil. ... 72
Figure 5.2 UV-Vis absorbance of DPPH at 517 nm. ... 74
Figure 5.3 TGA of virgin transformer oil and extract-oil blends at a ramp rate of 5 ºC min-1. .... 75
Figure 5.4 Dissipation factor of virgin oils and extract-oil blends at different voltages carried out at a frequency of 50 Hz, at a temperature range of 20-25 ºC. ... 76
Figure 5.5 Electrical resistance of oils and extract-oil blends at different voltages, frequency of 50 Hz carried out at a temperature range of 20-25 ºC. ... 77
Figure 6.1 Glass test cell with copper plates. ... 83
Figure 6.2 Circuit showing incorporation of the test cell using Tettex 2820 adapted from L & tan δ Measuring Bridge Version 1.8 Operating Instructions Haefely Test. ... 83
Figure 6.3 Thermograms of VO at different heating rates (a-f); 1-6 represents the temperatures obtained for different values at 25% conversion. ... 85
Figure 6.4 Plot of the log verses 1000/T using the OFW model for virgin oil. ... 86
XVI
Figure 6.5 Results obtained from DSC data using the Kissinger and OFW model. ... 88 Figure 6.6 Dissipation factor of oils represented at 20 ºC. ... 89 Figure 6.7 Electrical resistance of oils represented at 20 ºC. ... 90
XVII
LIST OF STRUCTURES
Structure 2.1 Molecular structure of compounds found in hydrocarbon mineral oils. ... 9
Structure 2.2 Structure of 2,6-di-tert-butyl-4-methylphenol (BHT). ... 17
Structure 2.3 Structure of 2,6-di-tert-butylphenol (DBP). ... 18
Structure 2.4 Degradation products of AO’s, BHT and DBP. ... 22
Structure 2.5 Components of the curcuminoid family present in turmeric. ... 24
Structure 2.6 Structures of compounds present in turmeric oil. ... 25
XVIII
LIST OF SCHEMES
Scheme 2.1 A scheme representing auto-oxidation reactions of transformer oil. ... 11 Scheme 2.2 Reactions of alkyl radicals with BHT and oxygen. ... 18 Scheme 2.3 (a) Reaction describing the conversion of BHT into a phenoxy radical that is stabilised by steric hindrance and resonance. Alternate pathways of the radical reaction is also outlined in b and c. ... 19 Scheme 2.4 Reaction showing the chain termination step, upon which BHT and methylene cyclohexadienone are formed. ... 20 Scheme 2.5 Reaction scheme for the determination of hydroperoxide content of transformer oil.
... 32 Scheme 3.1 Flow diagram showing an outline of the experimental procedure as per Chapter 4. 40 Scheme 3.2 Outline of the experimental procedure as per Chapter 5. ... 41 Scheme 3.3 Brief outline of the experimental procedure as elaborated on in chapter 6. ... 41
XIX
LIST OF ABBREVIATIONS
∏ pi
°C degrees Celsius
AC alternating current
AO antioxidant
ar- aromatic
ASTM American Standard Testing Methods
ATR attenuated total reflectance
heating rate
BHT butylated hydroxy toluene
BHT-B butylated hydroxy toluene blend C capacitance DBP di-butylphenol
DBP-B di-butylphenol blend
DPPH 2,2-diphenyl-1-picrylhydrazyl DSC differential scanning calomitery
E-OB1 extract oil blend 1
E-OB2 extract oil blend 2
E-OB3 extract oil blend 3
E-OB5 extract oil blend 5
f frequency FT-IR Fourier transform infrared spectroscopy GC-FID gas chromatography- flame ionisation detector GC-MS gas chromatography- mass spectrometry
HV high voltage
I current
ICP-OES inductively coupled plasma- optical emission spectroscopy
IEC International Electro- Technical Commission K Kelvin
kVA kilo volt amps
NERSA National Energy Regulator of South Africa
NMR nuclear magnetic resonance
OFW Ozawa, Flynn and Wall
PCB polychlorinated biphenyls
TA thermal analysis
tan δ tan delta/dissipation factor
TGA thermo gravimetric analysis
TPP triphenylphosphine
XX
TPPO triphenylphosphine oxide
TPPS triphenylphosphine sulphide
UV/Vis ultraviolet/visible
VO virgin oil
w/w weight by weight
α conversion
ω angular frequency
Ω ohm
1
CHAPTER 1 INTRODUCTION
The basic principle of transformers was initially introduced by Michael Faraday in 1831, however transformers were only developed late in the 19th century [1]. Today, their role in the electricity supply industry is indispensable. The performance of a transformer is crucial to the efficiency of power transference. However the lifetime of a transformer is limited. Fouling of the transformer is more likely due to insulation failure than mechanical wear [2]. Many types of liquid filled transformers are commonly insulated using mineral oil. Mineral oil was first introduced as a dielectric fluid in 1892 [3]. A typical generator step-up (GSU) transformer contains several thousand gallons of transformer oil [4]. Although oils function efficiently as coolants and insulators [5], it suffers the drawback in which it is susceptible to oxidative processes. Ageing of insulation material inevitably leads to insulation failure [6]. This work focuses on a naphthenic based transformer oil, used typically as a dielectric fluid in South African transformers.
1.1 PROBLEM STATEMENT
South Africa is a country that is presently advancing industrially and economically [7]. With the expanding growth of the urban population, demand is placed on everyday ‘necessities’ such as clean running water, electricity, among other social amenities. One of the current issues in South Africa is the energy crisis. As a consequence of urbanization, stress is placed on the service providers (such as those that provide electricity) for more efficient production and delivery. The main electricity supplier in South Africa, Eskom cannot deal with such enormous demands for electricity with the limited number of power stations that are currently in place. One of the solutions to curb the power shortage for Eskom has been frequent power cuts across the country [8]. Currently, consumers are still urged to restrict their use of electricity. The matter has however worsened when the National Energy Regulator of South Africa (NERSA) recently granted Eskom a 24.8% hike in the price of electricity resulting in increased bills for the consumer [9].
In order to increase the production of electricity, one has to improve the efficiency of power generation.
2
One of the ways to achieve this is by optimizing the performance of the transformer and one of the key components of the transformer is its insulation, in this case the transformer oil. Insulation failure of transformers inevitably leads to high repair costs, long downtime and very real safety risks. Moreover, transformers are too expensive to repair/replace regularly and must be properly maintained to maximize their life expectancy. This can be achieved by improving the stability and performance of its insulation. Oil filled transformers have two aspects in terms of insulation:
paper and dielectric fluid. The liquid component of the insulation is transformer oil. Oil serves a dual function in transformers, acting as a coolant and an insulator [5]. However the ageing process is unavoidable and reduced quality of the oil and paper eventually results in transformer failure [10]. Nonetheless it was found that some oils underwent the oxidation process at a slower rate than others. The key question was what was the difference between these oils? Later it was established that oils which managed to retard the oxidation process, contained natural antioxidants [11]. Antioxidants are free radical scavengers in which their general function is to donate hydrogen and thereby terminate the radical chain mechanism [11].
1.2 HYPOTHESIS
The synthetic antioxidants, 2,6-di-tert-butyl-4-methylphenol (butylated hydroxy toluene-BHT) and 2,6-di-tert-butylphenol (DBP) as well as turmeric plant extracts when blended with transformer oils can extend the lifetime of the oils by increasing their antioxidant activity and therefore their stability.
1.3 AIM OF THE STUDY
The aim of the study was to compare the stability of naphthenic based virgin transformer oils by investigating the physico-chemical properties of uninhibited oil before and after blending with synthetic antioxidants, namely BHT and DBP, and turmeric plant extract.
1.3.1 Specific Objectives of the Study The specific objectives of the study include:
i. Determination of the physico-chemical properties of uninhibited naphthenic based transformer oil.
3
ii. To determine the physico-chemical properties of naphthenic oil blends with synthetic antioxidants, namely BHT and DBP and the effect accelerated ageing has on these antioxidants.
iii. Characterisation of the effect that, blending of turmeric powder extract with naphthenic oil has on its physico-chemical and electrical properties.
iv. Thermal analysis of uninhibited oils and their blends with synthetic antioxidants so as to determine the kinetic parameters of the decomposition reaction.
1.4 DISSERTATION OVERVIEW
Chapter 1 outlines an introduction on transformers and oil as an insulator. In addition it highlights the problems associated with transformer oils and possible ways to improve its performance.
Chapter 2 reviews the literature on transformers, oil insulators in transformers as well as the effect electrical and thermal stresses have on transformer oils. This chapter also discusses the role of synthetic and plant extract antioxidants, on improving stability of the transformer oils. It also discusses principles of methods and instruments.
Chapter 3 is a general experimental overview to the work that has been carried out in this study.
It includes the instrumental methods used for characterisation of transformer oils before and after blending. The chapter also discusses the physico-chemical parameters of virgin transformer oils including viscosity, water content, acid number, iodine value, dissipation factor as well as dielectric breakdown testing, among other properties of oils.
Chapter 4 presents the first published manuscript (Proceedings): Characterisation of a naphthenic based uninhibited virgin transformer oil and the use of synthetic antioxidants. XVII International Symposium on High Voltage Engineering: Leibniz Universität Hannover, Schering-Institut, Hannover, Germany, August 22-26, 2011: E-029 p294. In this manuscript, the physico-chemical properties of the oil blended with synthetic antioxidants, namely BHT and DBP were carried out. The oil blends were also subjected to digestion by exposure to UV
4
radiation, the antioxidant (AO) content was monitored and the AO degradation products were determined.
Chapter 5 is the second manuscript that has been submitted to World Academy of Science and Engineering Technology: Physico-chemical properties of transformer oil blends with antioxidants extracted from turmeric powder. It details transformer oil blending with extracted antioxidant components from turmeric (Curcuma longa) powder. These blends were then characterised in comparison with virgin non-blended oil.
Chapter 6 presents results of the third manuscript: The determination of kinetic parameters of transformer oil and its blends by thermal analysis, submitted to South African Journal of Science. The study is based on the determination of apparent activation energy of the oil and its blends for the decomposition reaction by thermal gravimetric analysis (TGA) and differential scanning calorimetry (DSC). The study highlights the use of thermal analysis for the determination of the kinetic parameters by means of the Ozawa, Flynn and Wall (OFW) and Kissinger models.
Chapter 7 is the conclusion which presents a summary of the major results of this MSc dissertation work. It outlines suggestions and recommendations for further work with respect to dielectrics fluids that are used in transformer insulation.
.
REFERENCES
[1] Coltman J. W., The transformer, IEEE Industry Application Magazine, 2002, Jan/Feb:8-15.
[2] Verma P., Condition monitoring of transformer oil and paper, Electrical and Instrumentation Engineering, Thapar Institute of Engineering and Technology 2005, Doctor of Philosophy.
[3] Yuliastuti E., Analysis of dielectric properties comparison between mineral oil and synthetic ester oil, Department of Electrical Sustainable Energy, Delft University of Technology 2010, Master of Science.
5
[4] U.S. Department of the Interior Bureau of Reclamation, Transformers: Basics, Maintenance, and Diagnostics, Reclaimation: Managing Water in the West, 2005, www.usbr.gov/pmts/client_service/recent/studytransformers.pdf (accessed 27 July 2011).
[5] Heathcote M. J., J & P Transformer Book, Elsevier, 2007.
[6] Meshkatoddini M. R., Aging study and lifetime estimation of transformer mineral oil, American Journal of Engineering and Applied Sciences, 2008, 4:384-388.
[7] South Africa: Economy overview, http://www.southafrica.info/business/economy/econoverview.htm (accessed 5 October 2011).
[8] Mail and Guardian Online, Eskom: Power supply 'a serious concern' from 2011, http://mg.co.za/article/2010-03-16-eskom-power-supply-a-serious-concern-from-2011 (accessed 5 October 2011).
[9] Mail and Guardian Online, Nersa grants Eskom 24,8% price rise, http://www.mg.co.za/article/2010-02-24-nersa-grants-eskom-248-price-rise (accessed 4 May 2010).
[10] Jarman P., Wang Z., Zhong Q. and Ishak T., End-of-life modelling for power transformers in aged power system networks, Cigré, 2009, C105.
[11] Rudnick L. R., Lubricant Additives: Chemistry and Applications, CRC Press, 2009.
6
CHAPTER 2
LITERATURE REVIEW
2.1 AN OVERVIEW OF TRANSFORMERS
In general terms, an electrical transformer is a device that can transfer electrical energy from one circuit to another [1]. However its precise definition is rather more complex than this. The transformer was developed with the aim to allow electricity to transfer from an electrical generator to the consumer [1]. The transformer is required to ‘transform’ the high current lower voltage output from an electrical generator to a voltage that can be handled by cable direct to the consumer [1]. Power transformers that are rated 500 kVA and larger, are oil filled for insulation and cooling [2]. Transformers rated less than 500 kVA are used for distribution e.g. pole-top transformers [2].
Figure 2.1 Depiction of a typical GSU, three phase transformer [2].
7
Step-up transformers, receives energy at a generator voltage and increases it to a higher voltage for transmission lines whereas a step-down transformer receives energy at a higher voltage and delivers it at a lower voltage for distribution to various loads [2]. Since the power is constant, step down transformers step up the current and vice versa. Transformers are composed of two sets of windings referred to as primary and secondary, which are linked by a ferromagnetic core.
The transference of energy is via the process of electromagnetic induction [1, 3]. One winding (primary winding) of the transformer is energized by an alternating current. This brings about a magnetic field in the core, as a result flux lines circulate the transformer core. The secondary winding is around the same core, consequently the alternating flux lines induce a voltage in the secondary winding (Figure 2.2) [2]. The total voltage induced is equal to the sum of the individual voltages induced in each turn of the windings [2]. As a result in a step up transformer, a greater voltage output is required hence the number of turns in the secondary winding is greater than that of the primary windings; the converse is applicable for step down transformers [2].
Figure 2.2 Representation of primary and secondary windings of a transformer showing the induction of voltage by electromagnetic flux [2].
8 2.2 TRANSFORMER INSULATION USING OILS
As previously indicated the insulation of the transformer is crucial to its lifetime. The transformer insulation must be substantial for forty years or more of service [1]. Oil filled transformers have two aspects in terms of insulation: paper and oil.
The paper insulation can be divided into: (a) Kraft paper and (b) cotton cellulose [1].
The liquid component of the insulation is transformer oil. Oils in general serves a dual function in transformers, acting as a coolant and an insulator. The basic materials of a transformer include copper and iron. These materials bring about energy losses in the form of heat. This leads to an overall increase in the temperature of the transformer [1]. Since the operation temperature of a transformer is dependent on the paper insulation, it is common practice that the temperature should not exceed 100 C. Based on this temperature restriction, a medium is required to absorb heat from the system [1]. Mineral oil has been found to be the most efficient medium for absorbing heat from the core and the windings.
In terms of the oil acting as an insulator; a transformer is made up of a number of different parts held at different electrical potentials [1]. Thus a medium is required in order to insulate the different parts from each other.
The oil is also required to aid in the efficiency of the solid insulation (paper) [1, 4]. The oil penetrates the paper and fills the spaces between the wound insulation [1]. Oils are also relatively inexpensive however their flammability restricts the placement of transformer units indoors.
Previously polychlorinated biphenyls (PCB’s) were employed as insulators, their non flammable nature made them preferential [5]. However PCB’s are now known to be toxic and persistent pollutants [5]. Consequently the use of PCB’s as dielectrics in transformers have been banned [6].
Currently there are different types of mineral oils that are available for use in transformers. Most mineral oils that are used are obtained from crude petroleum. There are three types of hydrocarbon oils that are used: paraffins, naphthenes and aromatics (Structure 2.1). Other dielectric fluids are available; however this work focuses exclusively on mineral oil that is naphthenic based.
9
Structure 2.1 Molecular structure of compounds found in hydrocarbon mineral oils [1].
Criteria that should be met in order for an insulating oil to be deemed efficient include:
i. Low viscosity: heat is dissipated in three ways: convection, radiation and conduction. The reliability on convection is found to be the most important. Convection relies on natural
10
circulation that arises due to the difference in densities of hotter and cooler fluids. Thus efficient convection is dependent on the oil viscosity. [1]
ii. Low pour point: with a decrease in temperature oils become semi solid after which it loses its ability to act as an efficient coolant. [1]
iii. High flash point: the oil should not change drastically in terms of composition due to losses of volatile components. [1]
iv. Excellent chemical stability: formation of sludge and increases in acidity due to oxidation is best avoided. Oxidation processes are accelerated by oxygen, catalysts and elevated temperatures. Even though oxidation reactions are inevitable, oils should provide some chemical stability. [1]
In addition to these properties, the oil should be non-toxic (not listed as a hazardous material), biodegradable, reclaimable and easily disposable [7].
2.3 IMPACTS OF STRESS ON TRANSFORMER OIL
Transformer oils can be subjected to stress under oxidative, thermal and electrical conditions [8].
Such stresses bring about the formation of acidic oxidation products, the occurrence of these products can be catalysed by the presence of metals, oxygen, high temperatures and increases in moisture content [9]. These acidic products eventually lead to the formation of sludge resulting in inadequate cooling of the transformer unit. In addition, primary and secondary breakdown products are known to be able to carry an electrical charge which consequently hinders the electrical properties of the oil [10]. However the formation of carboxylic acids is not only detrimental to the transformer oil but also results in the deterioration of the paper insulation [10].
For most mineral oils it has been found that the rate of oxidation doubles for every 10 °C rise in temperature above 75 °C [11].
The oxidation of lubricating oil can be broken down into different steps: chain initiation, propagation, branching, and termination [12]. Scheme 2.1 illustrates the general outline for oil oxidation reactions.
11
Scheme 2.1 A scheme representing auto-oxidation reactions of transformer oil [12].
a) The initiation step (Scheme 2.1a) involves the formation of free alkyl radicals. Free radical formation can be induced by oxygen, heat and ultraviolet light. This process is rather slow but can be accelerated by metal catalysts and increases in temperature [12].
b) The alkyl radicals produced in the initiation step reacts with oxygen to form peroxy radicals in what is known as the chain propagation step (Scheme 2.1b).
12
The peroxy radicals then can take on a hydrogen atom from another hydrocarbon molecule, to form a hydroperoxide molecule and another alkyl radical. The chain propagation step is irreversible and extremely fast. [12]
c) In the chain branching step (Scheme 2.1c), a hydroperoxide molecule is cleaved and in the process, two radicals are formed viz., the alkoxy radical and the hydroxyl radical.
The formation of these radicals brings about a number of other reactions that these radicals can possibly undergo. These radicals can then abstract hydrogen from other molecules forming more radicals in the process. Primary and secondary alkoxyl radicals that are formed, eventually decompose to form aldehydes and ketones, respectively. [12]
d) Under high temperatures the ketones and aldehydes that are formed, are further oxidized to carboxylic acids. During the oxidation process, the viscosity of the oil increases due to the formation of high molecular weight species, at this time chain termination reactions dominate. Alkyl radicals can combine with each other to form hydrocarbon molecules. In addition an alkyl radical can combine with an alkyl peroxy radical to form a peroxide.
This is however unstable and forms more alkyl peroxy radicals and the process repeats itself (Scheme 2.1d) [12].
The number of transformers that have malfunctioned due to insultaion failure is substantial and incur alot of expenditure [7]. Considerable research has been conducted with respect to ageing of transformer oils and other related aspects in this field.
Meshkatoddini [9] reported that continuous monitoring of transformer oil is essential, considering the fact that oxidation products (acids and sludge) hinders the performance of the solid insulation as well. Copper, paint, varnish and oxygen are contributing factors that catalyse oxidation reactions and speed up the ageing process [9]. In their study, nine on-site transformers were used, all from the same manufacture and all containing the same naphthenic based oil. The tenth sample was virgin transformer oil. The authors collected the following data with respect to time: dissipation factor, dielectric constant, breakdown voltage, specific resistance, viscosity, flash point, acidity and density. From their results the authors found that density, flash point, permittivity and dielectric breakdown voltage showed poor correlation with respect to service
13
life/degradation, consequently these factors were negated as parameters that can correlate to lifetime estimation.
However the authors did find good correlation to ageing in their dissipation factor and viscosity tests. Nevertheless the best correlation to ageing was found with acid number. Subsequently, the authors then aged oil samples at different temperatures using acid number of 0.3 mg KOH/g oil as the criterion for degradation. The data was then used to verify that the Arrhenius Law was valid for transformer oil.
El-Refaie, Salem and Ahmed [13] also outlined the need for continuous oil monitoring. There are several maintenance tests that can be carried out to determine the progression of ageing [13]. El- Refaie and coworkers investigated six transformer oil samples in order to study the changes of certain characteristics as a function of time (service life). They reported the variance in the type of transformer oil used, as: fresh, purified and changed oil. They monitored breakdown voltage, total acidity, flash point, specific gravity and kinematic viscosity over time. They found that the breakdown voltage of the oils decreased over long periods of time. They also observed that changing or purifying the transformer oil caused the dielectric breakdown voltage to initially increase, but then decrease after long periods of time. They obtained a converse pattern for acid value and kinematic viscosity results, where these values increased over long periods of time but changing or purifying the oil showed an initial decrease in these values.
Neto et al. [14] researched the combined effect of metal passivators and antioxidants on transformer oil.
A series of five AO’s; viz. 2,6-di-tert-butyl-4-methylphenol; tetrakis[methylene(3,5-di-tert- butyl-4-hydroxyhydrocinnamate)]methane; 2-amino-5-pentadecylphenol; 2,4-diamino-5- pentadecylphenol; and thiodiethylenebis(3,5-di-tert-butyl-4-hydroxyhydrocinnamate) were used in their study. These AO’s were used in concentrations of 500 and 1000 ppm. They also investigated the combined effect of using both, an antioxidant and metal passivator [n-(1,2,3- benzotriazole)] in concentrations of 500 and 8 ppm, respectively. Their work involved subjecting non doped oils to ageing in a vessel which was maintained at constant temperature (90, 100, 110, and 120 °C) and oxygen flow in the presence of copper wire. Samples were monitored at regular time intervals by FT-IR. After doping the oils with AO’s and the metal passivator, they subjected
14
the oils to accelerated ageing for 164 hours, at a temperature of 100 °C and 1.0 L h-1 flow rate of oxygen in the presence of copper. Degradation of the oil was determined by monitoring the region of the carbonyl band (1713 cm-1) in the FT-IR spectrum.
The non-doped oil was found to have an activation energy of 10 kcal mol-1, however the authors did not determine the activation energy of the decomposition reaction for that of doped oil. Their study concluded that antioxidants, which were more sterically hindered, were most effective in preventing oxidation. They also observed that the metal passivator independently did not reduce degradation levels; however AO and passivator blends significantly decreased the rate of oxidation.
Georgiev et al. [15] focused their study on the monitoring of transformer oil degradation by using FT-IR, making it possible to identify oxidation products both qualitatively and quantitatively. Although accelerated oxidation studies have been done, it is rather difficult to monitor changes perhaps due to inadequate time. In their study, an extraction technique was developed for the isolation of volatile and total acids. FT-IR spectra were obtained for oxidized transformer oil and oxidized transformer oil doped with antioxidants; 0.38% (w/w) of ionol and piperidone and 0.38% (w/w) piperidone: ionol at a mass ratio 1:1.Their results showed that the absorbance at 1710 cm-1 increased with progression in oxidation of the oils. Extracted oxidized transformer oil showed a strong band in the 1710 cm-1 region when compared to the spectra obtained without the extraction step. The authors concluded that the use of the extraction method was far more superior to monitor oil oxidation breakdown products.
A great deal of work has also been done on the prediction of lifetime [9, 16]. The basis of lifetime prediction is the Arrhenius equation (Equation 2.1) [17];
... (2.1)
where, A is the pre-exponential factor, E is the activation energy and k is the rate constant.
The Arrhenius equation indicates that for reactants to form products there is a minimum amount of energy that is needed by the molecules. Materials that have higher activation energy become more resistant to chemical degradation [16]. Thus the application of the Arrhenius equation to
15
insulating materials plays a crucial role. Meshkatoddini [9] did an effective job in looking at thermal ageing and acid value criteria. However, other work focused on the determination of kinetic parameters of polymers using thermal analysis [17]. Thermogravimetric curves provide adequate information to determine the decomposition kinetic data for oils [17].
The OFW approach has been used in many studies to determine the activation energy by iso- conversional method. This method utilises data in which thermal analysis is carried out for the sample under a range of heating rates () [18]. Using Equation 2.2 [16], log verses 1/T is plotted and the activation energy at different conversion values (α) is obtained.
... (2.2)
where, E is oxidation energy, R is the universal gas constant, b is a constant with a value of 0.457, T is the temperature and is the heating rate.
Kenar et al. [18] presented work on the DSC study of blown soya bean oil. Blown oil is obtained by a process involving a combination of heating and blowing air through vegetable oil. The blowing of oil promotes auto-oxidation. Kenar and co-workers used the OFW model to determine the kinetic parameters of the oil. The authors carried out DSC experiments from a temperature of 25-300 C at variable ramp rates () between 3-20 C min-1 for the soybean oils [18]. The oil oxidation reaction was found to be exothermic in nature [18]. These workers recorded the onset of degradation temperature and maximum heat flow values from the DSC curves for each value. They plotted the data of log verses 1/T to obtain the Ea. Application of the OFW method is not unique to oils but can be related to other polymers as well. Zelic et al.
[19] studied the kinetic information obtained from TGA of cement. The authors heated calcium hydroxide in the presence of nitrogen from a temperature of 330 to 460 C at values of 5, 10, 15 and 20 C min-1 [19]. However in their study, different conversion values were used, as discussed previously. Their work outlined the dependence of activation energy on conversion.
The activation energy was found to decrease with conversion and this tied in with literature for an endothermic reversible reaction followed by a irreversible one [19]. Nguyen and Gu [20]
16
focused their study on lifetime estimation of an acrylate based photopolymer for microfabrication and photonic applications. They used the OFW model to determine kinetic parameters and predicted lifetime of their photopolymer from work described previously by Toop [21].
The OFW model is not the only method that has been used for the determination of kinetic parameters from DSC results. The Kissinger model (Equation 2.3) is an alternate method that can be used for the determination of kinetic parameters and is applied to data obtained from DSC.
This method utilizes the signal maxima from the DSC curves [22].
ln
ln
... (2.3)where, T is the maximum heat flow temperature, A, Arrhenius factor, Ea the activation energy and , the heating rate.
2.4 ANTIOXIDANTS/ADDITIVES1
For many years oils were known to undergo oxidation [12]. However those that managed to retard the oxidation process contained natural antioxidants [12]. Antioxidants are free radical scavengers in which their general function is to donate hydrogen and thereby terminate the radical chain mechanism [12].
There are a vast number of oil soluble organometallic and organic antioxidants/additives that are available. These can be placed into the following categories: sulfur compounds, sulfur–nitrogen compounds, phosphorus compounds, sulfur–phosphorus compounds, aromatic amine compounds, hindered phenolic compounds, organo–copper compounds and boron compounds [12].
1 In view of the large number of antioxidant groups that are available, my MSc study will focus on those with
relevant importance to this work.
17
Oils are characterised as uninhibited, that is, they contain no antioxidants, or inhibited oils that contain antioxidants [23]. A new oil is classified by the American Standard Testing Methods (ASTM) into two categories: Type I oil that has 0.08% of oxidation inhibitor and type II oil that contains 0.3% of inhibitor [23].
Sulfur compounds: Earlier, mineral oil was heated with elemental sulfur to produce a non- oxidizing oil.
However, the limitation in the addition of sulfur is that it leads to an increase in the corrosivity of copper in the transformer unit. Phosphorus containing compounds have also been used as a common additive. The addition of elemental phosphorus is known to reduce sludge formation in oils. However the addition of elemental phosphorus leads to problems associated with corrosivity with respect to alloys and non-ferrous metals [12]. Consequently elemental phosphorus is avoided and alternatively oil-soluble organic compounds of phosphorus are preferred [12].
Sterically hindered phenols are extensively used in lubricating oils. This work focuses on the hindered phenolic compounds that are most commonly used in oils filled in South African transformers. Currently the antioxidants that have been used include BHT (butylated hydroxy toluene) (Structure 2.2) and DBP (dibutylated phenol) (Structure 2.3) and are expected to be in the range of 0.25 to 0.35 (w/w) % [23].
Structure 2.2 Structure of 2,6-di-tert-butyl-4- methylphenol (BHT).
18
Structure 2.3 Structure of 2,6-di-tert-butylphenol (DBP).
BHT is a representative example of a sterically hindered phenol. Scheme 2.2 represents the reactions of an alkyl radical with O2 and an alkyl radical with BHT. The reaction rates are k2 and k1 respectively, where k2>k1 [12].
Scheme 2.2 Reactions of alkyl radicals with BHT and oxygen [12].
Since k2>k1, the likelihood of the alkyl radical reacting with BHT is rather low. However during the progression of oxidation, alkyl radicals are converted to peroxy radicals [12]. It is at this point that the addition of BHT takes effect. BHT donates a hydrogen atom to the peroxy radical to form hydroperoxides, BHT in turn is converted into a phenoxy radical (2,6-di-tert-butyl-4- methylphenoxy radical). This radical is stabilised through steric hindrance and resonance [12]
(Scheme 2.3a). However the phenoxy radicals can react with each other (Scheme 2.3b);
19
alternatively with other radicals formed by resonance (Scheme 2.3c) to form different BHT oxidation products.
Scheme 2.3 (a) Reaction describing the conversion of BHT into a phenoxy radical that is stabilised by steric hindrance and resonance. Alternate pathways of the radical reaction is also outlined in b and c [12].
20
Without resonance an alternate pathway is followed. The termination reaction is represented in Scheme 2.4. The phenoxy radicals react with each other. A hydrogen atom is donated from one phenoxy radical to the other, forming a BHT molecule and one methylene cyclohexadienone molecule [12]. Under the influence of high temperatures, the reaction product of Scheme 2.3a (cyclohexadienone alkyl peroxide) becomes unstable and decomposes to eventually form
2,6-di-tert-butylcyclohexa-2,5-diene-1,4-dione [12] [benzoquinone] (Structure 2.4d).
Scheme 2.4 Reaction showing the chain termination step, upon which BHT and methylene cyclohexadienone are formed [12].
Studies related to the degradation of BHT and DBP has been previously carried out. Cook [24]
reported that the oxidation of hindered phenols most commonly leads to the formation of dimeric products. Foley and Kimmerle [25] researched the use of pulse voltammetry for the determination of BHT in transformer oils. The following compounds, 4,4-(ethane-1,2- diylidene)bis(2,6-di-tert-butylcyclohexa-2,5-dienone) [Stilbene quinine] (Structure 2.4a) and 4,4-(ethane-1,2-diyl)bis(2,6-di-tert-butylphenol) [dimer] (Structure 2.4b) are generally found in used oils [25]. Under more wet oxidative conditions 3,5-di-tert-butyl-4-methylbenzaldehyde [benzaldehyde] (Structure 2.4c) and 2,6-di-tert-butylcyclohexa-2,5-diene-1,4-dione [benzoquinone] (Structure 2.4d) are the major products. The oxidation products of BHT are dependent on the nature of the media. In brief, in acidic media an ionic pathway is followed however in neutral media a radical reaction pathway is followed [25].
Hassanein et al. [26] focused on the auto-oxidation of DBP catalyzed by 5,10,15,20-tetrakis[4- (diethylmethylammonio)phenyl]porphyrinatocobalt(II) tetraiodide.
21
These authors determined the rate of phenol consumption by measuring the amount of dioxygen using a gas burette at temperatures of 40 C. They found the major product of the reaction catalyzed by the cobalt(II) porphyrin complex to be the coupling product, 3,5,3,5-tetra-tert- butyl-4,4-diphenoquinone (Structure 2.4e) which was formed by dimerization. The oxygen insertion product, 2,6-di-tert-butyl-1,4-benzoquinone (Structure 2.4d) was also formed through the cobalt(III) complex.
22
Structure 2.4 Degradation products of AO’s, BHT and DBP [24-27].
23 2.5 TURMERIC EXTRACTS
Although antioxidants are currently available for the use in transformer oil, research is focused on the use of cheaper and more natural antioxidants. Turmeric (Curcuma longa) belongs to the Zingiberaceae family, which includes spices like ginger and cardamom [28]. It has been used for centuries as a major spice in Asia particularly in India in the form of a dried powdered rhizome for its aroma and flavour [28]. However, turmeric is also well known for its antioxidant properties. In addition, it is known to possess anti-cancer, anti-coagulative and anti-hepatotoxic properties [29]. The aroma of the turmeric powder is attributed to its volatile oils and its bright yellow colour as a result of its phenolic components [28]. The main active components of turmeric are the curcuminoids and essential oils [30]. Structure 2.5 represents the compounds associated with curcuminoids as outlined by Jayaprakasha et al. [28].
Jayaprakasha et al. [28] summarized that the volatile oil of turmeric is predominantly a mixture of sesquiterpene ketones and alcohols; namely p-cymene, -sesquiphellandrene, -turmerone, ar-turmerone, curlone and other sesquiterpene alcohols. Studies revealed that ar-curcumene is generally found in the rhizome oil at a concentration of 12.2% but absent in tuber oil [28].
Structure 2.6 shows the structures of the components present in the volatile oil.
Jayaprakasha et al. [31] presented a study on C. longa, in which the antioxidant and antimutagenic activity of turmeric oil was characterised. The authors modified the turmeric oleoresin in such a way that the curcumin was removed and only turmeric oil was obtained. The oil was fractioned on a silica gel column. Their findings showed that the turmeric oil contained aromatic turmerone (31.32%), -turmerone (15.08%) and curlone (9.70%). Fraction III had the highest percentage of -turmerone and aromatic turmerone and consequently also showed the greatest antioxidant capacity and strongest antimutagenicity activity against sodium azide [31].
Singh et al. [32] carried out their study on the comparison of antioxidant activity of the oil and oleoresin fractions of fresh and dried rhizomes of turmeric. The constituents of the fresh and dry rhizomes were determined by GC-MS. Their findings are tabulated in Table 1. The DPPH assay was used to monitor antioxidant activities of the different fractions.
24
Structure 2.5 Components of the curcuminoid family present in turmeric [28].
25
Structure 2.6 Structures of compounds present in turmeric oil [28].
26
Table 1 Summary of the GC-MS results of turmeric fractions [32].
Rhizome Type Fraction Composition
fresh
oil aromatic-turmerone (24.4%), alpha-turmerone (20.5%) and beta-turmerone (11.1%) oleoresin alpha-turmerone (53.4%), beta-turmerone
(18.1%) and aromatic-turmerone (6.2%) dry
oil alpha-turmerone (21.4%), alpha-santalene (7.2%) and aromatic-curcumene (6.6%) oleoresin aromatic-turmerone (9.6%), alpha-santalene
(7.8%) and alpha-turmerone (6.5%)
In summary, their results indicated that the alpha-turmeric content in fresh rhizome was substantial when compared to that of the dry rhizome content.
Of interest from studies by Singh and co workers [32] to our study, is the fact that the free radical scavenging activity of the oleoresin and the oils were comparable to that of the synthetic antioxidant, butylated hydroxyanisole (BHA). They established the order of activity as follows;
essential oil (fresh rhizome) > oleoresin (fresh rhizome) > essential oil (dry rhizome) > oleoresin (dry rhizome). They attributed this finding to the fact that alpha- and beta-turmerone content was greater in fresh rhizome.
Nor et al. [33] carried out a study on the antioxidant effects of turmeric using accelerated oxidation and deep frying [33]. High temperatures that are used in deep frying, imparts on the loss and quality of the oil as it accelerates oxidation reactions. In order to prolong the life of the oil, antioxidants such as BHA, BHT and tertiary butylated hydroxyquinone (TBHQ) are generally used. Their results showed that the peroxide content was more favourable with 0.2% C.
longa than 0.02% BHT, after eight hours of frying. Nor and coworkers also found C. longa reduced (decreased) the fatty acid value of the oil after 24 hours of frying, which was superior to that of BHT. Their study concluded that C. longa as a source of natural antioxidants, can be exploited by the food industry [33].
27
2.6 INSTRUMENTATION FOR CHARACTERISATION AND ANALYSIS
2.6.1 Nuclear Magnetic Resonance (NMR), Fourier Transform-Infra-Red (FT-IR) and Elemental Analysis
NMR and IR studies on transformer oils have been previously studied [8, 15]. However different transformer oils will have different functional groups depending on the type of transformer oil, nature of the additives added to the oil and progression of oxidation.
FT-IR is generally used for the monitoring of carbonyl and hydroxyl groups in the oil and NMR deciphers structural changes of the oil [8].
IR is a non destructive technique and becomes useful in the determination of chemical functional groups in a sample. Different functional groups are able to absorb characteristic frequencies of IR radiation. Sampling ranges from the conventional nujol, KBr disc and a newer technique:
attenuated total reflectance (ATR). This sampling accessory works by measuring the changes that occur in a totally internally reflected infrared beam that comes into contact with the sample.
The infrared beam sits on the surface of the crystal which in turn is in contact with the sample [34].
NMR is based on the alignment of atomic nuclei in a sample with or against an external electromagnetic field. A very strong superconducting magnet that is surrounded by liquid helium which in turn is surrounded by liquid nitrogen is used [35]. Through the middle of this magnet there is a small hole that allows for the sample tube [35]. The sample is placed in a static magnetic field, the nuclei are then excited with radio frequency pulse and the frequencies emitted by the sample are then measured [36]. The sample tube contains the sample dissolved in an appropriate deuterated solvent.
CHNS elemental analysers are based on a combustion process. The sample is inserted into a furnace that is maintained at 1000 ºC [37]. In the furnace carbon is converted to carbon dioxide;
hydrogen to water; nitrogen to nitrogen gas/oxides of nitrogen and sulfur to sulfur dioxide [37].
28
The detector system involves non-dispersive infrared absorption detection system and thermal conductivity [38].
2.6.2 Inductively Coupled Plasma-Optical Emission Spectroscopy (ICP-OES)
The use of ICP-OES is an acceptable instrument for the determination of metals/non-metals in lubricating oils [39]. The principle behind ICP-OES initially involves the sample being transported as a liquid [40]. The liquid is converted into an aerosol in a process known as nebulization. This aerosol is then transported to the plasma, where it is desolvated, vaporized, atomized and ionized by the plasma [40]. The plasma consists of argon gas which is directed through a torch consisting of three concentric tubes made of quartz, on the top of the torch there is a copper coil, radio frequency is applied to the copper coil and a spark induces free electrons in the plasma, this causes further ionization and forms the plasma [40].
2.6.3 Ultra-Violet/Visible (UV/Vis) Spectroscopy
UV-Vis spectroscopy is a technique used to determine the adsorption pattern of a sample. Light is irradiated through a sample placed in a cuvette holder. The absorbance is correlated to the concentration of the sample: A= cl, where, is the molar coefficient, c is the concentration, l is the length of the cell and A is the absorbance of the sample. This equation is denoted as the Beer- Lambert law [41].
The UV/Vis spectrophotometer is made up of a light source, a monochromator, sample cell holder for the sample cell (quartz or glass), the detector and display unit (computer system) [41].
2.6.4 Gas Chromatography-Flame Ionization/Mass Spectrometry (GC-FID/MS)
GC is a separation technique based on the difference in volatilities of the components in the sample [41]. A typical GC instrument is composed of a stationary phase which the mobile phase (gas) flows through, an injection port, a column in a column oven and a detector [41]. The detector used in this case is the FID detector. This detector is destructive in nature. FID is mass sensitive rather than concentration sensitive [42]. The carrier gas effluent is mixed with hydrogen and then transferred to a stainless steel jet, here the flame at the tip of the jet ionises the analyte molecules [42]. A potential difference is created across the positively charged collector electrode
29
and the grounded jet causes the negative ions to flow to the collector electrode and an analogue signal is produced [42].
The GC can also be coupled to an MS detector; in this case an electron impact detector is used.
Once the components have left the column, the sample is transferred to the ion source of the MS.
The atom or molecule is bombarded by high energy electrons. Some of the energy is transferred to the molecule. It then ejects an electron to form a positively charged species [43]. This molecular ion then further fragments. The ions are passed through poles of a magnet and are deflected by the magnetic field [43]. The amount of deflection is dependent on the mass to charge ratio [43].
2.6.5 Thermal Analysis (TA)
Thermogravimetric analysis (TGA) is the measurement of weight loss as a function of temperature or time [44]. TGA can be a useful tool to study decomposition of oils and oil blends.
Essentially the sample is heated in a furnace and mass changes are recorded by a balance.
Differential scanning calorimetry (DSC) is a technique in which the difference in flow rate of the sample and reference is recorded and is measured during a phase change by a thermocouple.
2.7 PHYSICO-CHEMICAL CHARACTERISATION METHODS FOR VIRGIN TRANSFORMER OILS AND TRANSFORMER OIL BLENDS
2.7.1 Acid number, Saponification value and Iodine value 2.7.1.1 Acid number
The acid number is defined as the mass of KOH in mg required to neutralise the acidic components in 1 g of transformer oil [45]. An increase in acid number is generally correlated to a decrease in the dielectric strength [10]. Acid number is sometimes used as the failure criterion to determine whether the oil needs to be removed and then processed.
2.7.1.2 Saponification value
Saponification value is a useful tool in the determination of acid and ester groups that are present in oils. It is defined as the mass of KOH in mg that is required to hydrolyse 1 g of the oil sample [46]. The general equation (Equation 2.4) is given below [46]:
30 R COOH + KOH (excess) → R COOK + H
2O, KOH + HCl → KCl + H
2O ……….. (2.4) 2.7.1.3 Iodine value
Iodine value confers the degree of saturation or unsaturation present in oils. It is also known as the number of grams of iodine per 100 grams of oil [47]. The double bonds (if any) in the sample react with iodine monochloride in glacial acetic acid, which is in excess [47]. The un-reacted iodine monochloride that remains behind after the reaction is then decomposed to iodine in the presence of potassium iodide solution. The final step is titration against standardised sodium thiosulphate solution [47].
2.7.2 Metal/Non-metal Analysis
Instruments such as ICP-OES [39] and Atomic absorption spectroscopy (AAS) [48] are generally used for the determination of metals. However the large amount of organics and viscous nature of the oil makes it imperative for the sample to be digested prior to analysis [48]. The metals that are expected to be found are the additive metals rather than wear metals, as the transformer oil analysed was virgin in nature. The presence of wear metals proves to be detri
![Figure 2.1 Depiction of a typical GSU, three phase transformer [2].](https://thumb-ap.123doks.com/thumbv2/pubpdfnet/10705623.0/26.918.220.728.525.976/figure-2-1-depiction-typical-gsu-phase-transformer.webp)
![Figure 2.2 Representation of primary and secondary windings of a transformer showing the induction of voltage by electromagnetic flux [2]](https://thumb-ap.123doks.com/thumbv2/pubpdfnet/10705623.0/27.918.190.732.539.914/figure-representation-primary-secondary-windings-transformer-induction-electromagnetic.webp)
![Table 1 Summary of the GC-MS results of turmeric fractions [32].](https://thumb-ap.123doks.com/thumbv2/pubpdfnet/10705623.0/46.918.146.774.134.370/table-summary-gc-ms-results-turmeric-fractions-32.webp)
![Table 2 Wear metals and additive elements that are generally found in transformer oil samples [39]](https://thumb-ap.123doks.com/thumbv2/pubpdfnet/10705623.0/51.918.149.774.171.732/table-wear-metals-additive-elements-generally-transformer-samples.webp)
![Figure 2.3 Circuit diagram depicting the functioning of the Tettex 2820 apparatus. Adapted from L & tan δ Measuring Bridge Version 1.8 Operating Instructions Haefely Test [4]](https://thumb-ap.123doks.com/thumbv2/pubpdfnet/10705623.0/54.918.179.744.353.777/circuit-depicting-functioning-apparatus-adapted-measuring-operating-instructions.webp)