Review Integrated Development Plan for 2017 - 2022
1
FOURTH GENERATION
Integrated Development Plan
(As prescribed by Section 34 of the Local Government:
Municipal Systems Act 32 of 2000)
IDP 2017-2022
First Review
May 2018
Integrated Development Plan 2017-2022
2
Integrated
Development Plan for 2017-2022
Compiled in terms of the Local Government:
Municipal Systems Act, 2000 (Act 32 of 2000)
Adopted by the Municipal Council on May 2017. IDP 1st Revision adopted in Council on 23 May 2018.
The Integrated Development Plan is the Municipality’s principal five year strategic plan that deals with the most critical development needs of the municipal area (external focus) as well as the most critical governance needs of the organisation (internal focus).
The Integrated Development Plan –
• is adopted by the council within one year after a municipal election and remains in force for the
• council’s elected term (a period of five years);
• is drafted and reviewed annually in consultation with the local community as well as interested organs
• of state and other role players;
• guides and informs all planning and
development, and all decisions with regard to planning, management and development;
• forms the framework and basis for the municipality’s medium term expenditure framework, annual
• budgets and performance management system; and
• seeks to promote integration by balancing the
economic, ecological and social pillars of sustainability
• without compromising the institutional
capacity required in the implementation, and by coordinating
• actions across sectors and spheres of government.
Review Integrated Development Plan for 2017 - 2022
3
Table of Contents
Table of Figures ... 3
Foreword by the Executive Mayor ... 7
Overview by the Municipal Manager ... 9
List of Acronyms... 10
CHAPTER 1 ... 13
CHAPTER 2 ... 19
CHAPTER 3 ... 34
CHAPTER 4 ... 60
CHAPTER 5 ... 77
CHAPTER 6 ... 89
CHAPTER 7 ... 114
CHAPTER 8 ... 183
CHAPTER 9 ... 194
CHAPTER 10 ... 206
CHAPTER 11 ... 244
Table of Figures Figure 1: Map of the Greater Stellenbosch WC024 ... 21
Figure 2: Income Inequality ... 24
Figure 3: Human Development Index ... 25
Figure 4: GDPR, 2005 - 2016 ... 29
Figure 5: Real GDPR per capita, 2005 - 2016 ... 30
Figure 6: Agri - Park Implementation ... 32
Figure 7: Executive Mayoral Committee ... 64
Figure 8: Macro structure ... 66
Figure 9: Klapmuts Proposed Urban Edge ... 117
Figure 10: Stellenbosch Map ... 118
Figure 11: Stellenbosch Urban Edge ... 119
Integrated Development Plan 2017-2022
4
List of Tables
Table 1 Preparation for the Fourth Generation IDP ... 18
Table 2: Ward Description ... 23
Table 3: Indigent Households ... 25
Table 4: Access to Housing ... 26
Table 5: Access to Water ... 27
Table 6: Access to sanitation ... 27
Table 7: Access to Electricity ... 28
Table 8: Refuse Removal ... 29
Table 9: GDPR Contribution per sector 2015 (%) ... 31
Table 10: SPLUMA and Development Principles ... 38
Table 11: PSDF Spatial Agenda ... 40
Table 12: Spatial Challenges ... 46
Table 13: IDP strategic focus areas and the SDF ... 47
Table 14: The role and function of different settlements ... 54
Table 15: Instruments of governance ... 57
Table 16: Council Political Representation ... 60
Table 18: Ward Councillors and Proportional Councillors... 61
Table 19: Executive Mayoral Committee ... 63
Table 20: The Administration ... 65
Table 21: Risk and IDP Alignment ... 68
Table 22: Members of the Audit Committee ... 71
Table 23: Key Partnerships ... 73
Annexures
1. Ward Profiles
Integrated Development Plan 2017-2022
5
Contents - Revisions
Section Changes Made During Annual Review
Foreword by the Executive Mayor The Forward of the Mayor changed to take into account changes in the social, political and economic conditions
Foreword by the Municipal Manager Overview of the Municipal Manager changed to take into account changes in the social, political and economic conditions
List of Acronyms
Chapter 1: Introduction Second year process was updated with the latest dates.
1.1 Integrated Development Planning 1.2 Review of the Integrated
Development Plan
1.3 Legal status of the IDP
1.4 Relationship between IDP, Budget, Performance Fourth generation IDP and Annual Review of the IDP
1.5 The IDP and Ward Plans Revised 1.6 The IDP Planning Process (Five year
cycle)
Revised 1.7 Roles and Responsibilities
1.8 First year Process Followed Revised Chapter 2: State of the Greater Stellenbosch
• The Socio Economic Conditions has been updated taking into consideration changes in the social, political and economic conditions.
2.1 Stellenbosch municipal area at a glance
Updated with Community Survey 2016 and other statistics
2.2 Location 2.3 The Economy
Chapter 3: Spatial Development Planning New Chapter was added for Spatial Development planning
Chapter 4: Governance and Institutional Development 4.1 Roles and responsibilities Chapter 5: Strategic Policy Context
5.1 Global Policy Direction 5.2 National Policy Direction 5.3 Provincial Policy Direction 5.4 Functional Region and District Policy Direction
Revised 5.5 Local Policy Direction
Chapter 6: Public expression of needs
6.1 Effective Community Participation Public Participation Engagements was updated to highlight the greater emphasis placed on community engagements
6.2 Feedback to Comments Received as part of the Public Participation Process
Revised
6.3 Socio-Economic Profile of each Ward
Revised 6.4 Thusong Programme
Integrated Development Plan 2017-2022
6
Section Changes Made
During Annual Review Chapter 7: Municipal level policy directives
7.1 Spatial Development Framework Revised and expanded into a chapter
7.2 Integrated Zoning Scheme Revised
7.3 Air Quality Management Plan (AQMP) Revised 7.4 Heritage Landscape Plan
7.5 Integrated Human Settlements Plan (IHS) Revised 7.6 Comprehensive Integrated Transport Plan (CITP) Revised 7.7 Integrated Waste Management Plan (IWMP) Revised
7.8 Electrical Master Plan Revised
7.9 Water Services Development Plan (WSDP) Revised 7.10 Long Term Water Conservation And Water Demand
Strategy
Revised
7.11 Safety and Security Strategy Revised ( additional)
7.12 Disaster Management Plan Revised
7.13 Local Economic Development Strategy Revised 7.14 Community Development Strategy Revised 7.15 Human Resource (HR) Strategy
7.16 ICT Strategy
7.17 The Relationship between Sector Plans Chapter 8: Strategy
8.1 Reflection, Challenges and Opportunities 8.2 Strategic Focus Areas
8.3 Core Principles in executing our Strategy Chapter 9: Strategy Unpacked
9.1 Strategic Focus Areas, Pre-determined Objectives and Programmes
Revised to include progress of year 1
Chapter 10: Financial Plan 10.1 Introduction
10.2 Capital and Operating Budget Estimates Revised 10.3 Financial Management Arrangements Revised 10.4 Financial Strategies and Programmes Revised 10.5 Medium-Term Capital Expenditure per Strategic Goal Revised 10.6 Medium-Term Operational Expenditure per Strategic
Gal
Revised 10.7 Medium-Term Operational Revenue per Strategic
Gal
Revised 10.8 IDP and Capital Budget 2017/20 Revised 10.9 Stellenbosch Municipality MIG Investment 2017/18 to
2019/20
Revised figures for 2018/19 and 2019/20. MIG projects table Shifted to chapter 10, the finance chapter Chapter 11: Top Layer Service Delivery and Budget Implementation
Plan
Revised Plan
Integrated Development Plan 2017-2022
7
Foreword by the Executive Mayor
This is our first review of our fourth generation Integrated Development Plan (IDP). The IDP remains the basis of our planning process, which will enable Stellenbosch Municipality to continuously plan ahead and deliver services over the next five years.
The purpose of the IDP is to create a framework within which the municipality will fulfil its mandate and apply its budget. It allows us to do short, medium and long term planning for our entire municipal area, and link these plans to projects implemented by the district, provincial and national governments. This is essentially our business plan for the next year.
Our challenges are similar to those faced by our neighbours. Poverty and a harsh economic climate have impacted directly and indirectly on the people that call our town home. To meet these challenges and continue to improve our levels of service delivery, we have to take an integrated approach to development planning. To enable us to do this successfully we need the input from our residents to ensure we meet their needs within our prescribed mandate.
We are indeed making progress in addressing the challenges we face. A significant accomplishment in the past year has been the approval of our new organogram. This allows us to address our skills shortage and enhance the areas of service delivery that has been a challenge.
The needs of our community have been the guiding principle for everything we do. We have listened to them, and their needs were translated into projects provided for in the budget. This resulted in various projects geared towards service delivery
improvement and the improvement of the lives of our residents. Some of the highlights include:
The upgrade of the Stellenbosch Waste Water Treatment Works (WWTW). The upgrades to this facility significantly improved its capacity, resulting in an approved capability to delivery services to our community.
The handing over of 117 title deeds to residents from across the municipal region.
The roll out of the Enkanini Electrification Project The construction of trading spaces in Idas Valley and Kayamandi
Our focus over the next five years will be guided by the needs expressed by our community and informed by our municipal strategy.
The Highlights include:
Taking over of the Pniel Electricity Network from Drakenstein Municipality,
Upgrading the Waste Water Treatment Works in Raithby, Wemmershoek and Pniel
Continuous commitment to new housing developments
The upgrade of the Stellenbosch Fire Station A Heritage Tourism Centre in Jamestown Upgrades and improvement to the Kayamandi Town Centre
Integrated Development Plan 2017-2022
8
As our communities change, their needs change and our strategies evolve. We remain dedicated to the continuous updating of our IDP and the accompanying budget, through extensive public participation, to make sure that the community needs are addressed by our plan.
Adv. Gesie van Deventer Executive Mayor of Stellenbosch
Adv. Gesie van Deventer Executive Mayor
Review Integrated Development Plan for 2017 - 2022
9
Overview by the Municipal Manager
The Integrated Development Plan (IDP) for the Stellenbosch Municipality is more than just a document that we are legally required to draft every five years and review annually.
It is the geographic map that provides us with the framework within which we aim to reach the Municipality’s strategic focus areas. It is the guidelines which we must follow to ensure that services are delivered and lives are improved. It is the blueprint that will determine the developmental trajectory and economic growth of the municipality going forward. The process of reviewing the IDP is a strategic process and one that must be followed annually to ensure that the municipality remains in touch with the needs of residents and businesses in an environment that is continuously changing.
Stellenbosch Municipality faces the problems of a secondary city and experiences unique challenges. In compiling the IDP review, hard work and long hours were put in to ensure that we interacted and consulted with as many of our residents as possible to ensure appropriate responsiveness to the unique challenges faced throughout the greater Stellenbosch area. Numerous public engagements were held across all wards in the municipality and invaluable inputs were received through these interactions. This forms the backbone of the entire IDP process, we were able to ensure that our IDP objectives and targets remain relevant and attainable.
The IDP review provides us with a golden opportunity to revisit the progress made over the past year, revise our priorities going forward and recommit to our strategic objectives. It acts as a tool for us to ensure that we are on track to deliver better services and improve the quality of life for all citizens. Our aim must always be to create a just and equitable society for our communities and the IDP review plays a key role in ensuring that we reach this objective.
Together with the residents and stakeholders of the Stellenbosch Municipality, we can make our towns places of excellence and opportunity for all. Let us work together on this plan to leave a lasting legacy for future generations.
Geraldine Mettler Municipal Manager
Geraldine Mettler Municipal Manager
10
List of Acronyms
AQMP Air Quality Management Plan GDP-R Gross Domestic Product in Rand
CBD Central Business District GCM Greater Cape Metro
CBO Community Based Organisation GVA-R Gross Value-Added in Rand CITP Comprehensive Integrated Transport
Plan GGP Gross Geographic Product
CRR Capital Replacement Reserve GIS Geographic Information System
CoCT City of Cape Town GRAP Generally-Recognized
Accounting Practices CSP Community, Social and Personal
Services HDI Human Development Index
CWDM Cape Winelands District Municipality HIV/AIDS Human Immunodeficiency Virus/Acquired Immune Deficiency Syndrome DBSA Development Bank of South Africa HR Human Resources DEADP Department of Environmental Affairs
and Development Planning ISC Integrated Steering
Committee
DLG Department Local Government IDP Integrated Development
Plan DTPW Department of Transport and Public
Works
IHS Integrated Human
Settlements DGDS District Growth and Development
Strategy IHSP Integrated Human
Settlement Plan Cogta Department of Cooperative
Governance and Traditional Affairs IIC Infrastructure Innovation Committee
du/ha Dwelling units per hectare IPC Integrated Planning Committee
DWAF Department of Water Affairs and
Forestry (now Department of Water and Sanitation)
I-MAP Implementation Plan
ECD Early Childhood Development IMATU Independent Municipal Allied Trade Union
EDA Economic Development Agency IWMA Integrated Waste
Management Act GDP Gross Domestic Product IMESA Institute for Municipal
Engineers South Africa ITP Integrated transport Plan EPWP Expanded Public Works Programme
11
FPSU Farmer Production Support Unit PSTP Provincial SustainableTransport Program
KPA Key Performance Area RAP Rural Area Plan
KPI Key Performance Indicator RSIF Regional Spatial
Implementation Framework LED Local Economic Development SALGA South African Local
Government Association LGMTEC Local Government MTEC SAMWU South African Municipal
Workers Union
LHA Lanquedoc Housing Association SANBI South African National Biodiversity Institute
LM Local Municipality SU Stellenbosch University
LUMS Land Use Management System SAPS South African Police Service LUPA Land Use Planning Act SDBIP Service Delivery and Budget
Implementation Plan
MAYCO Mayoral Committee SDF Spatial Development
Framework
MDGs Millennium Development Goals SITT Stellenbosch Infrastructure Task Team
MEC Member of the Executive Council SLA Service Level Agreement MFMA Municipal Financial Management Act
(Act no. 56 of 2003)
SMME Small Medium & Micro Enterprises
MOU Memorandum of Understanding SM Stellenbosch Municipality MSA Municipal Systems Act (Act no. 32 of 2000) SOP Standard Operating
Procedure MTREF Medium-Term Revenue and Expenditure
Framework SOE State Owned Enterprisess
MTSF Medium-Term Strategic Framework SPLUMA Spatial Planning and Land Use Management Act IRDP Integrated Residential Development
Programme
UDS Urban Development Strategy JPI Joint Planning Initiative US University of Stellenbosch PMS Performance Management System UISP Upgrading of Informal
Settlements Programme PSDF Provincial Spatial Development
Framework
NDP National Development Plan FLISP Finance Linked Individual Subsidy
Programme
NHDP Neighbourhood Development Plan PMS Performance Management System NGP New Growth Path
12
NMT Non-motorized Transport WSA Water Service Authority
NPO Non-Profit Organization WSDP Water Services Development
Plan
NSDP National Spatial Development Perspective WtE Waste to Energy
PEA Potentially Economically Active WWTW Waste Water Treatment Work PGWC Provincial Government of the Western
Cape
Wesgro Western Cape Tourism, Trade and Investment Promotion Agency WCDSP Western Cape Draft Strategic Plan WCG Western Cape Government
NGO Non-Governmental Organization WDM Water Demand Management
13
CHAPTER 1
Introduction
1.1 Integrated Development Planning
The Municipal Systems Act (MSA) 32 of 2000 mandates South African municipalities to formulate a five-year Integrated Development Plan (IDP) plan to inform the municipal budget and guide all development within the municipal area. The IDP is considered the Municipality’s principal strategic plan that deals with the most critical development needs of the municipal area as well as the most critical governance needs of the organisation.
As the principal planning instrument that guides and informs the municipal budget, the planning process has to provide a forum for identifying, unpacking and resolving the real issues that face the residents of Stellenbosch. Clearly identifying these issues in consultation with communities, makes it possible for the Municipality to propose realistic and workable solutions that can be budgeted for, implemented and monitored in a controlled environment. These issues may be over-arching issues that affect the whole municipality or may only affect specific communities. It is therefore crucially important that the IDP be developed after the completion of a public participation process in which community stakeholders were thoroughly consulted. The plan is also developed in partnership with the provincial and national government.
At the heart of the IDP lies the improvement in the provision of basic municipal services and expanding livelihood opportunities for the people of the Stellenbosch Municipality. The IDP also focusses on expanding and transforming municipal capacity, enterprise development and crucially, exploring new ways of working and living together. This is especially relevant in an ever changing environment.
1.2 Review of the Integrated Development Plan
Section 34 of the Local Government: Municipal Systems Act 32 of 2000 prescribes that a municipality –
a) must review its integrated development plan-
(i) annually in accordance with an assessment of its performance measurements in terms of section 41; and
(ii) to the extent that changing circumstances so demand; and b) may amend its IDP in accordance with a prescribed process.
The review process serves as an institutional learning process where stakeholders can meet to discuss the successes and frustrations of the previous year. It is not designed to interfere with the long-term strategic objectives of the municipality. The review process is a strategic process of ensure the institution remains in touch with their intentions, informed of the varying needs of
14
residents and up to date with the changing environment within which it functions.The Stellenbosch Municipality, in collaboration with all relevant stakeholders and following the completion of the IDP focused engagements during the past financial year, must now review its IDP.
This is the first IDP revision to occur since the adoption of the Fourth Generation IDP.
Importantly, this review does not seek to replace or rewrite the IDP that was adopted by council on 31 May of 2017. The purpose of this review, as instructed by the MSA, is to examine the progresses made and assess the municipality’s strategic objectives and targets as set out in the IDP.
The priorities and actions identified in this review of the IDP will seek to better inform the municipality’s budget and streamline service delivery initiatives. This will ensure that the Stellenbosch Municipality remains on course to attain its strategic objectives.
The IDP review outlines:
An updated analysis of the Greater Stellenbosch area, including updated information on socio-economics factors.
Governance and institutional development The strategic policy context
Public expression of need (public participation) The various sector plans
A Strategy to reach objectives Financial planning
Details of the implementation, monitoring and review mechanisms
1.3 Legal Status of the IDP and IDP review
In terms of Section 35(1) of the Municipal Systems Act No 32 of 2000 an IDP is adopted by the council of a municipality-
(a) is the principal strategic planning instrument which guides and informs all planning and development, and all decisions with regard to planning, management and development, in the municipality;
(b) binds the municipality in the exercise of its executive authority, except to the extent of any inconsistency between a municipality’s integrated development plan and national or provincial legislation, in which case such legislation prevails; and
(c) binds all other persons to the extent that those parts of the integrated development plan that impose duties or affect the rights of those persons have been passed as a by-law.
In terms of the core components of IDPs, Chapter 5 and Section 26 of the MSA indicate that:
An integrated development plan must reflect-
(a) The municipal council’s vision for the long term development of the municipality with special emphasis on the municipality’s most critical development and internal transformation needs;
(b) An assessment of the existing level of development in the municipality, which must include an identification of communities which do not have access to basic municipal services;
15
(c) The council’s development priorities and objectives for its elected term, including its localeconomic development aims and its internal transformation needs;
(d) The council’s development strategies which must be aligned with any national and provincial sectoral plans and planning requirements binding on the municipality in terms of legislation;
(e) A spatial development framework which must include the provision of basic guidelines for a land-use management system for the municipality;
(f) The council’s operational strategies;
(g) Applicable disaster management plans;
(h) A financial plan, which must include a budget projection for at least the next three years; and (i) The key performance indicators and performance targets determined in terms of section 41.
The IDP is informed by a leadership agenda – as contained in national and provincial policy documents – as well as the needs of local citizens and public, private and community organisations. It directs and is informed by different aspects of the municipality’s work, including how the municipality is structured politically and administratively, the municipal budget, the sector plans and service delivery and budget implementation plans of different municipal services, and how the municipality manages its performance.
1.4 Relationship between the IDP, Budget, Performance Management and Risk Management
The IDP Process, together with the performance management process, should be seemingly integrated, where the IDP ensures that the planning stage for performance management occurs and performance management fulfills the implementation, monitoring and evaluation of the IDP process. This is prescribed according to the Performance Management Guide for Municipalities, DPLG, 2001.
The role of the Budget is to attach money to the objectives that are contained in the IDP and the Budget gets monitored through the SDBIP (Service Delivery Budget Implementation Plan). The IDP therefore provides strategic directions for the IDP, whereas the Budget should ensure the implementation of the IDP.
Risk Management is one of Management’s core responsibilities according to section 62 of the Municipal Finance Management Act (MFMA) and is an integral part of the internal processes of a municipality. It is a systematic process to identify, evaluate and address risks on a continuous basis before such risks can impact negatively on the service delivery capacity of the Stellenbosch Municipality. When properly executed risk management provides reasonable assurance that the institution will be successful in achieving its goals and objectives.
1.5 The IDP and Ward Plans
The twenty two (22) ward plans, include:
The profile of the ward, as well as the strengths, weaknesses, opportunities and threats facing the community;
A consensus on priorities for the relevant ward(s);
An implementation plan; and
The capital budget available for the relevant ward(s, including the small capital budget.
16
Ward plans help to ensure that the IDP is more targeted and relevant to addressing the priorities of all groups, including the most vulnerable. These plans provide ward committees with a systematic planning and implementation tool to perform their roles and responsibilities. They form the basis for dialogue between the municipality and ward committees regarding the identification of priorities and budget requests and will also be used by ward committees for ongoing monitoring and evaluation throughout the year. The information is however on a detail level and not duplicated in the IDP, but a detailed Ward Plan is available on request.1.6 The IDP Planning Process (five year cycle)
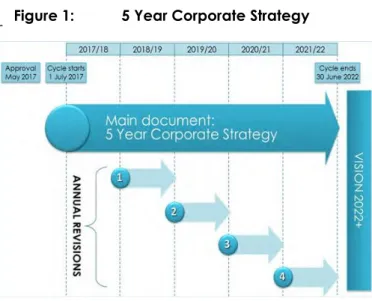
According to the Municipal Systems Act, every new council that comes into office after the local government elections has to prepare its own IDP that will guide them for the five years that they are in office. The IDP is therefore linked to the five year term of office of Councillors. This does, however, not restrict all proposals in the IDP to five years. The strategic goals that are part of the Municipality’s strategy all have a longer than five year horizon, similar to the spatial development framework (SDF) of the municipality.
A clear distinction must also be made between the main IDP which is compiled every five years (or if a new council comes into power within the
five year period and does not accept the previous council’s IDP) and the annual review of the IDP. The annual review is not a replacement of the five year IDP and its purpose is not to interfere with the long-term strategic orientation of the municipality. The annual review reflects and reports on progress made with respect to the five year strategy (and strategic goals) and proposes adjustments to the strategy if necessary because of changing internal and external circumstances that impact on the appropriateness of the IDP.
The figure on the right reflects the five year process of the IDP.
1.7 Roles and Responsibilities
(a) Executive Mayor
In terms of the Municipal Systems Act and the Municipal Finance Management Act, the Executive Mayor must:
Manage the drafting of the IDP;
Assign responsibilities in this regard to the Municipal Manager;
Submit the draft plan to the municipal council for adoption; and
co-ordinate the annual revision of the IDP and determine how the IDP is to be taken into account or revised for the purposes of the Budget.
Figure 1: 5 Year Corporate Strategy
17
(b) The Municipal CouncilThe Council is the ultimate decision-making authority. Decisions to approve or amend the Municipality’s integrated development plan (IDP) may not be delegated and have to be taken by the full Council.
(c) Proportional Councillors, Ward Councillors & Ward Committee Members (Ward Committees) Assist with public participation process;
Assist the ward councilor (who is the chairperson) in identifying challenges and needs of residents;
Provide a mechanism for discussion and negotiation between different stakeholders in the ward;
Interact with other forums and organisations on matters affecting the ward;
Draw up a ward plan that offers suggestions on how to improve service delivery in the particular ward;
Disseminate information in the ward; and
Monitor the implementation process concerning its area.
(d) Municipal Manager and Management Team Provide technical/sector expertise and information Provide inputs related to the various planning steps
Summarise/digest/process inputs from the participation process Discuss/comment on inputs from specialists
Address inputs from and give feedback to the community.
18
1.8 First Year Process Followed
Table 1 below, reflects Preparation for the 2017/18 financial year to complete the Fourth Generation IDP.
Table 1 Preparation for the Fourth Generation IDP
DATE ACTION(S)
July /August 2017
• Approval of IDP/Budget/SDF Process Plan and Time Schedule.
• Provincial Government hosted a District Alignment Workshop on the Joint Planning Initiative (JPI’s).
September – November 2017
• Community engagement meetings were held in all 22 wards, explaining the processes to be followed for the next five years and the time schedule for the 2018/19 financial year for the first review of the Fourth Generation IDP. Feedback was provided on the implementation of priorities listed by the wards. The priorities in the basic needs assessment were presented and the communities were given time for additional inputs.
• Provincial IDP Manager’s Forum hosted by Department Local Government
• Sector engagement was held to determine the basic needs and collectively devise plans to address the needs.
December 2017 –
February 2018
• Compilation of Draft IDP document in collaboration with all Directorates.
• Administration prepared the Draft IDP in finalizing the chapters of the document.
• Administration prepared the Draft Budget.
• Administration prepared the draft high-level SDBIP.
• Ward plan update meetings were held in all 22 wards with the respective ward committees and Ward Councillors.
• Provincial LGMTEC held to agree on Joint Planning Initiatives to support the Fourth Generation IDP.
• Various thematic sector engagements held to determine the needs in WC024 and exploring potential partnerships in addressing the needs March – April
2018 • Mayco and Council considered the draft IDP and Budget.
• IDP/Budget/SDF public meetings held in 22 wards within WCO24 (Cluster meetings)
• Closing date for submission on draft IDP, Budget & SDF (30 April 2017)
• Inputs received from the IDP/Budget/SDF meetings - collated and distributed to the Directorates for inputs.
May – June 2018
• Budget Steering Committee – to consider inputs received from IDP/Budget/SDF meetings
• Consultation and refinement of IDP and Budget documents
• Approval of Final IDP, Budget, SDF; Tariffs and Budget related policies
• Submit approved IDP to Provincial Government
• Approval of SDBIP by the Executive Mayor within 28 days after adoption of the IDP and Budget.
19
CHAPTER 2
State of the Greater Stellenbosch Area
2.1 Stellenbosch Municipal Area at a Glance
Demographics Population Estimates
Population
176 523
Households
52 374
Education 2016 Poverty
Matric Pass Rate 86.9% Gini-Coefficient
Human Development Index
0.62 0.72 Learner-Teacher Ratio 32.4%
Gr 12 Drop-out Rate 23.0%
Health 2016
Primary Health Care
Facilities
Immunisation Rate Maternal Mortality Ratio (per 100 000 live births)
Teenage Pregnancies – Delivery rate to women U/18
14 85.6% 0.0 4.5%
Safety & Security % Change between 2016 & 2017 in # of reported cases/100 000 Residential
Burglaries DUI Drug-related Crimes Murder Sexual Offences
2.4% 35.0% 7.7% -16.7% -2.8%
Access to Basic Service Delivery % HHs with access to basic services, 2016
Water Refuse Removal Electricity Sanitation Housing
98.5% 71.0% 90.9% 98.1% 65.1%
Road Safety Labour Socio-economic Risks
Fatal Crashes Road User Fatalities
41
Unemployment
11.9%
Risk 1 Drought
Risk 2 Financial Sustainability
Risk 3 Sluggish Economic Recovery Finance, insurance, real estate
and business services Wholesale and retail trade, catering and
accommodation Manufacturing
21.6% 20.2% 17.0%
21
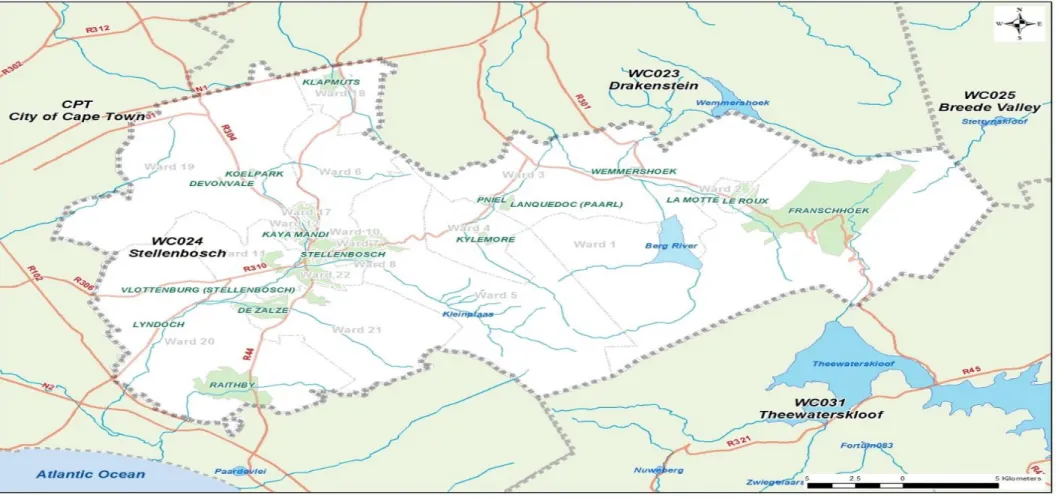
Location
Figure 1 illustrates the Greater Stellenbosch in relation to neighbouring municipalities, within the Western Cape. Stellenbosch Municipality is located in the heart of the Cape Winelands.
Figure 1: Map of the Greater Stellenbosch WC024
22
Stellenbosch is situated about 50 km from Cape Town and is flanked by the N1 and N2 main routes.The municipal area covers roughly 900 km². According to population growth estimates, of the Community Survey the population figures for Stellenbosch for 2016 indicates a number of 176 543 people and 52 374 households. The Municipality’s area of jurisdiction includes the town of Stellenbosch and stretches past Jamestown to Raithby in the South, Bottelary, Koelenhof, and Klapmuts to the North, and over the Helshoogte Pass to Pniel, Kylemore, Groendal and Franschhoek in the East.
Apart from formal settlement areas, the municipal area also includes a number of informal settlements.
Stellenbosch town is the second oldest town in South Africa, dating back to 1679 when an island in the Eerste River was named Stellenbosch by the then Governor of the Cape, Simon van der Stel. The first farming activities in the area were started in that year. Today, the area has become primarily known for its extraordinary wines, fruit, world renowned cultural landscapes and exceptional scenic quality. The towns of Stellenbosch and Franschhoek are renowned for various architectural styles such as Dutch, Georgian and Victorian, which reflect their rich heritage and traditions, but also the divisions of the past.
The area houses excellent educational institutions, including the University of Stellenbosch and a number of prestigious schools. It has a strong business sector, varying from major South African businesses and corporations, to smaller enterprises and home industries. The tourism industry alone is responsible for the creation of about 18 000 jobs in the area. The area’s numerous wine farms and cellars are very popular and the area is the home of the very first wine route in South Africa.
A variety of sport facilities are available. Coetzenburg, with its athletics and rugby stadiums, has hosted star performances over many generations while the Danie Craven Stadium is the home of Maties rugby, the largest rugby club in the world. The municipal area has a number of theatres, which include the University’s HB Thom Theatre, Spier Amphitheatre, Dorpstraat Theatre, Aan de Braak Theatre, and Oude Libertas Amphitheatre – well-known for its summer season of music, theatre and dance.
The area is known for its quality, award-winning restaurants and is a tourist haven with many boutiques, galleries, and curio shops. There are several museums and art galleries and the area is host to a number of annual cultural, food, wine and sports festivals. A wide array of accommodation is available for visitors to choose from.
Welfare and community organizations play a leading role in assisting to meet the needs of previously neglected communities.
The following municipalities share their borders with Stellenbosch Municipality:
The City of Cape Town (South)
Drakenstein Municipality, Cape Winelands District (North) Breede Valley Municipality, (North-east)
Theewaterskloof Municipality, (South-west)
Stellenbosch municipal area is now divided into 22 Wards, with recent amendments to some of the ward boundaries by the Municipal Demarcation Board in 2016. The wards consist of urban settlements as well as the surrounding rural areas which contain agricultural and natural environments. The table below describes the urban settlements and rural areas within the different wards and the figure on the next page indicates the ward demarcation for the respective 22 wards within the WCO24 boundary.
23
Table 2: Ward DescriptionWard Areas Included
1 Franschhoek Town, Bo-hoek Farms and Mooiwater
2 Langrug, La Motte, Dennegeur, Groendal, Domain Agnes 3 Wemmershoek, La Motte, Lanquedoc, Maasdorp
4 Pniel, Johannesdal, Kylemore
5 The Ridge, Lindida, Ida’s Valley (Hydro in the direction of Ida’s Valley and Omega Street to Jonkershoek)
6 Ida’s Valley and farms (Nuutvoorbij,Timberlea, Morgenhoff, Remhoogte, Muratie, Groenhof, Delheim, Kanonkop, Uitkyk, Peckham, Laundry, Peckham, Warwick) 7 Mostertsdrift, Koloniesland, Karindal, Rozendal, Uniepark, Simonswyk, Universiteitsoord
(De Weides)
8 Stellenbosch Central and University Areas
9 Eerste River, Krige, Herte, Skone Uitsig, Bird, Merriman, Bosman, Victoria, Neethling, The Avenue
10 Tennant Street, Bell Street, Lappan Street, Lackey Street, Long Street-south, La Colline – Faure Street, Dr Malan Street to Irene Park, Conde Street, Mount Albert, Taylor,
Voorplein to Kromriver, Municipal Flats (Lavanda, Aurora, Phyllaria), Molteno Avenue to Paul Kruger Street and Banghoek Avenue
11 Dorp Street to Herte Street, Mark Street, Alexander Street, bottom of Bird Street to the Stellenbosch Train Station, all areas in Onder-Papegaaiberg and surrounding
businesses
12 Kayamandi: Enkanini, Snake Valley, Watergang, Thubelitsha, New Watergang(106), Zone O (next to Enkanini), Chris Hani Drive, Municipal Flats(10TH and 13th Street), School Crescent
13 Kayamandi: Old Location from Lamla Street to Luyolo Street, Red Bricks, Old Hostels 14 Kayamandi: Zone I Setona Street), Zone O(lower part )Mgabadeli Crescent, Monde
Crescent , Costa Land, Strong Yard, Zone M (8th Avenue)
15 Kayamandi: Mjandana Street (Zone L), Mputa Close, Zone K, Ndumela Street (Zone J), Distell Hostels, Vineyard, Zone O Middle part (Fire Street), Municipal Workers Flats, Zone N, and M, Old Corrobricks Hostels, Mdala Street(Old Hostels)
16 Lang Street, Eike Street, Jakaranda Street, Short Street, Curry Street, Quarry Street, Primrose Street, Pine Street, Hoop Street, North-End Street, Vredelust Street Noord Vredelust West Street, Laai Street, Last Street, Arnolds Street, Anthony Street, Carriem Street, Davidse Street, Cupido Street, Ismael Street, Crombi Street, Chippendale Street Bergstedt Street
17 Longstreet, Kloof Street, Fir Street, Williams Street, Rhode Street, Hendrickse Street, February Street, Weltevrede and Welgevonden, King Street, Hein Street
18 Klapmuts and surrounding farms
19 Elsenburg, De Novo, Kromme Rhee and surrounding farms 20 Vlottenburg, Raithby, Lynedoch, Eikendal, Mooiberge
21 Jamestown, Techno Park, Paradys Kloof, De Zalze, Surrounding Farming Area 22 Die Boord, Dalsig, Krigeville & Brandwacht
24
2.2 Economic Perspective
Population Growth
In 2018, the Stellenbosch municipal area will have an estimated population of 176 523 and after five years this population is projected to be 190 680. This equates to an estimated growth rate in this time span of 8.0 per cent.
The matric pass rate within the Stellenbosch area is the highest when compared to the other municipalities in the Cape Winelands District.
Health Care
Stellenbosch had 14 public healthcare (PHC) clinics in 2016, which comprises of 7 fixed PHC clinics and 7 mobile clinics as well as 1 community day centre to serve the community. Access to emergency medical services is critical for rural citizens due to the distances between towns and health facilities being much greater than in urban areas. Combined with the relatively lower population per square kilometre in rural areas, ambulance coverage is greater in rural areas in order to maintain adequate coverage for rural communities. Stellenbosch, has 3.4 ambulances per 10 000 inhabitants in 2016 which is above the District average of 2.2 ambulances per 10 000 inhabitants.
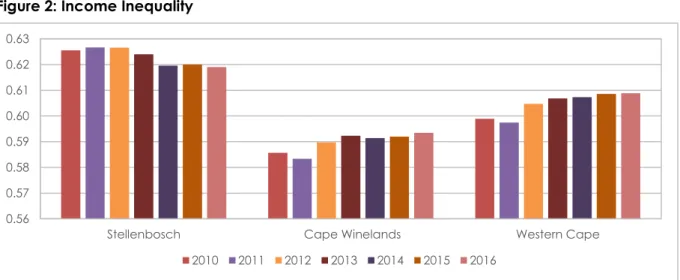
Income Inequality
The National Development Plan has set a target of reducing income inequality in South Africa from a Gini-coefficient of 0.7 in 2010 to 0.6 by 2030. Income inequality has remained steady in Stellenbosch between 2010 and 2013 and dropped to 0.62 from 2014 to 2016.
Figure 2: Income Inequality
Source: Global Insight, 2017 0.56
0.57 0.58 0.59 0.60 0.61 0.62 0.63
Stellenbosch Cape Winelands Western Cape
2010 2011 2012 2013 2014 2015 2016 Education
The learner-teacher ratio in Stellenbosch increased from 26.3 in 2014 to 33.0 in 2015 and declined marginally to 32.4 in 2016, which could in future affect learner performance within the Stellenbosch municipal area. Factors influencing the learner-teacher ratio is the ability of schools to employ more educators when needed and the ability to collect fees.
The learner – teacher ratio in Stellenbosch increased from 29.3 in 2014 to 34.4 in 2015 and up to 35.4 in 2016, which could in future affect learner performance within the Stellenbosch municipal area. Factors influencing the learner-teacher ratio is the ability of schools to employ more educators when needed and the ability to collect fees.
25
Income inequality levels were slightly higher in Stellenbosch than in the Cape Winelands District and the Western Cape.Human Development
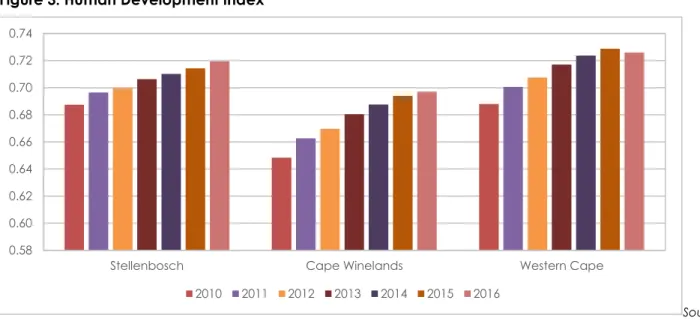
The United Nations uses the Human Development Index (HDI)1 to assess the relative level of socio- economic development in countries. Indicators that measure human development are education, housing, access to basic services and health.
Figure 3: Human Development Index
Source:
Global Insight, 2017
There has been a general increase in the HDI in Stellenbosch, Cape Winelands and the whole of the Western Cape between 2011 and 2015, with the exception of a drop in HDI levels for the Western Cape for 2016.
Indigent Households
The objective of the indigent policies of municipalities is to alleviate poverty in economically disadvantaged communities.
Table 3: Indigent Households
Area 2014 2015 2016
Stellenbosch 5 336 6 030 6 626
Cape Winelands District 33 406 34 704 42 756
Western Cape 404 413 505 585 516 321
Source: Department of Local Government, 2017
The Stellenbosch municipal area experienced an increase in the number of indigent households between 2014 and 2016, implying an increased demand for indigent support and additional burden
1 The HDI is a composite indicator reflecting education levels, health, and income. It is a measure of peoples' ability to live a long and healthy life, to communicate, participate in the community and to have sufficient means to be able to afford a decent living. The HDI is represented by a number between 0 and 1, where 1 indicates a high level of human development and 0 represents no human development.
0.58 0.60 0.62 0.64 0.66 0.68 0.70 0.72 0.74
Stellenbosch Cape Winelands Western Cape
2010 2011 2012 2013 2014 2015 2016
26
on municipal financial resources. Similarly, the number of indigent households has increased in the Cape Winelands District as well as the Western Cape.Access to Basic Services
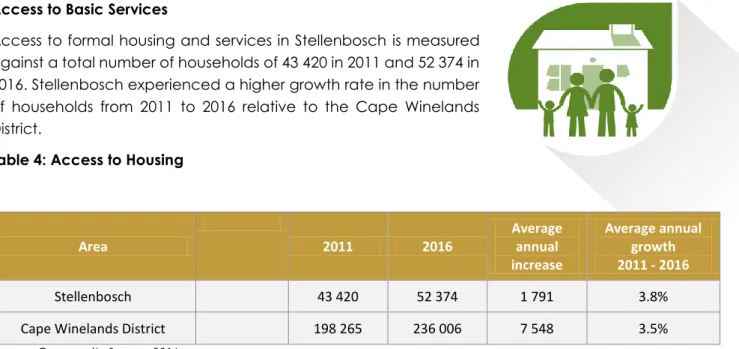
Access to formal housing and services in Stellenbosch is measured against a total number of households of 43 420 in 2011 and 52 374 in 2016. Stellenbosch experienced a higher growth rate in the number of households from 2011 to 2016 relative to the Cape Winelands District.
Table 4: Access to Housing
Source: Community Survey, 2016
The number of formal dwellings in Stellenbosch increased by 1 447 between 2011 and 2016, at an average annual rate of 0.9 per cent, which translates into approximately 289 additional formal dwellings per year over this period.
This increase in formal dwellings was however unable to keep pace with the growth in the total number of households, resulting in the percentage of formal households declining from 75.1 per cent in 2011 to 65.1 per cent in 2016.
Access to Water
Given the Western Cape’s current drought situation, great focus is currently placed on water availability and supply. This goes hand in hand with due consideration for water quality. Access to safe potable water is essential to prevent the contraction and spread of diseases and maintaining a safe environment.
Service Standard Definition: Households with access to piped water inside the dwelling or yard or within 200 metres from the yard.
Area 2011 2016
Average annual increase
Average annual growth 2011 - 2016
Stellenbosch 43 420 52 374 1 791 3.8%
Cape Winelands District 198 265 236 006 7 548 3.5%
27
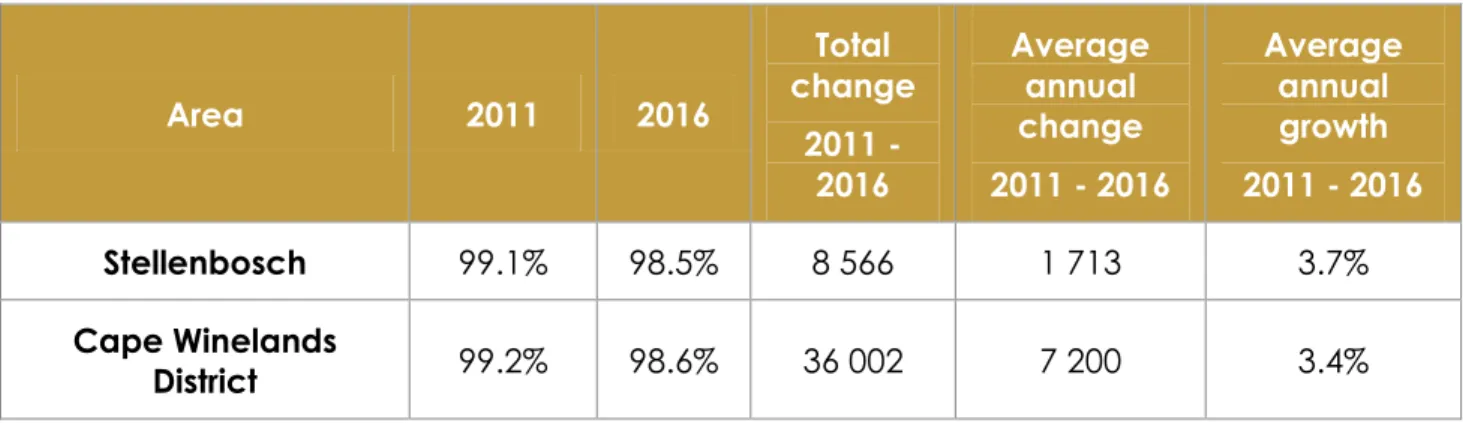
Table 5: Access to WaterArea 2011 2016
Total change
2011 - 2016
Average annual change 2011 - 2016
Average annual growth 2011 - 2016
Stellenbosch
99.1% 98.5% 8 566 1 713 3.7%
Cape Winelands
District
99.2% 98.6% 36 002 7 200 3.4%
Source: Community Survey, 2016
Although Stellenbosch experienced an annual increase of household access to piped water (to within 200 metres of the yard) of approximately 1 713 households per annum between 2011 and 2016, the proportion of households with access declined over this period from 99.1 per cent in 2011 to 98.5 per cent in 2016. This again is an indication that access to piped water was unable to keep pace with the growth in the total number of households.
Access to Sanitation
Access to sanitation promotes health and dignity through the provision of safe disposal and treatment of human waste. Where sanitation systems are inadequate, negative health effects can be extremely serious. The current drought highlights challenges in the use of potable water within the sanitation services process.
Service Standard Definition: Households with access to a flush toilet connected to the sewerage system.
Table 6: Access to sanitation
Area 2011 2016
Total change
2011 - 2016
Average annual change 2011 - 2016
Average annual growth 2011 - 2016
Stellenbosch
91.7% 98.1% 11 552 2 310 5.2%
Cape Winelands
District
91.5% 96.9% 47 232 9 446 4.7%
Source: Community Survey, 2016
Stellenbosch experienced significant progress in household access to sanitation services, as the proportion of households with access to acceptable standards of sanitation services increased from 91.7 per cent in 2011 to 98.1 per cent in 2016. The Municipality was able to provide an additional 2 310 households with access annually; access growing at an average annual rate of 5.2 per cent.
Access to Electricity
Energy is essential for human life; generally identified household uses include energy for cooking, heating and lighting. Energy sources also have usage risks; for example, health and safety risks
28
especially in the use of paraffin and open flame usage. The information below relates to the use of electricity for lighting purposes.Service Standard Definition: Households with access to electricity as the primary source of lighting.
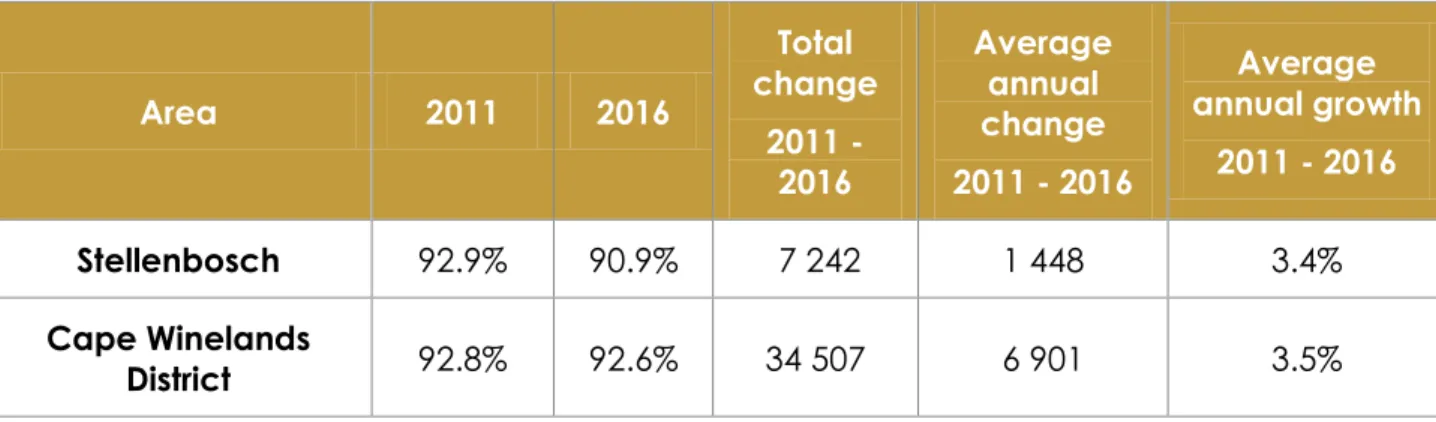
Table 7: Access to Electricity
Area 2011 2016
Total change
2011 - 2016
Average annual change 2011 - 2016
Average annual growth
2011 - 2016
Stellenbosch
92.9% 90.9% 7 242 1 448 3.4%
Cape Winelands
District
92.8% 92.6% 34 507 6 901 3.5%
Source: Community Survey, 2016
The annual growth in household access to electricity of 1 488 did not keep pace with the total household growth of approximately 1 791 on average per annum. The proportion of households with access to electricity also decreased from 92.9 per cent in 2011 to 90.9 per cent in 2016.
Access to Refuse Removal
Refuse removal is an essential service that ensures that health-related problems are kept at bay. A lack of regular refuse removal or inadequate service is likely to result in uncontrolled and unregulated dumping. There are growing concerns around the land and environmental limitations in the creation and lifespan of landfill sites. This would benefit greatly from the ‘reduce – reuse – recycle’ approach, that firstly encourages non-wasteful consumption practices (reduce), the reuse of products where possible (reuse) and the recycling of the product where its use in current form has been exhausted (recycle).
Service Standard Definition: Households who have waste removed by local authorities at least weekly.
29
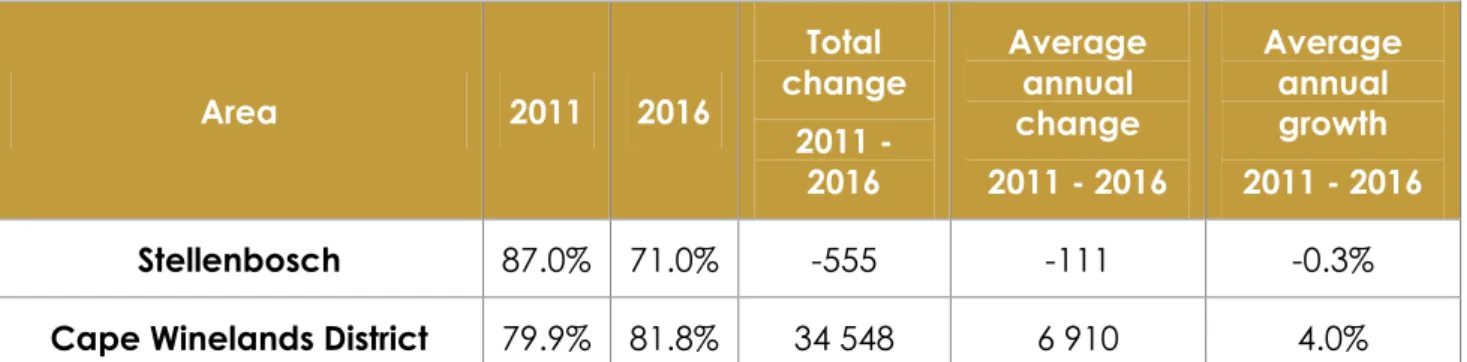
Table 8: Refuse RemovalArea 2011 2016
Total change
2011 - 2016
Average annual change 2011 - 2016
Average annual growth 2011 - 2016
Stellenbosch
87.0% 71.0% -555 -111 -0.3%
Cape Winelands District
79.9% 81.8% 34 548 6 910 4.0%
Household access to refuse removal services in Stellenbosch has decreased from 87.0 per cent in 2011 to 71.0 per cent in 2016; household access to this service decreasing over the 5-year period and unable to keep pace with the growth in the total number of households.
2.3 The Economy
Stellenboch Municipality has the 2nd largest economy in the Cape Winelands District area.
Economic patterns of the greater Stellenbosch area followed the same trend between 2005 and 2016.
Figure 4: GDPR, 2005 - 2016
Source: MERO 2017, Western Cape Treasury
The figure above confirms that the economic recovery after the 2009 recession was short lived.
General increases in food prices due to the drought, rising national unemployment and increasing interest rates are all having a negative effect on investment while the volatility in the Rand against currencies such as the US Dollar, Pound Sterling and Euro are contributing to rising inflation as South Africa is generally a net importer of goods. Other factors such as declining business confidence, political instability and the sub-investment credit rating by rating agencies are all contributing to the deteriorating economic conditions.
2006 2007 2008 2009 2010 2011 2012 2013 2014 2015 2016
Stellenbosch 5 6 4.7 -2.9 2.7 3.2 3 2.5 2.5 1.6 0.5
Cape Winelands 4.7 6.4 6.3 -1.9 2.4 3.5 3.2 3.1 3.3 1.6 0.5 Western Cape 5.7 6.4 4.1 -1.3 2.3 3.8 2.9 2.6 2.2 1.5 0.7
-4 -2 0 2 4 6 8
2005 -2016
GDPR (%)
30
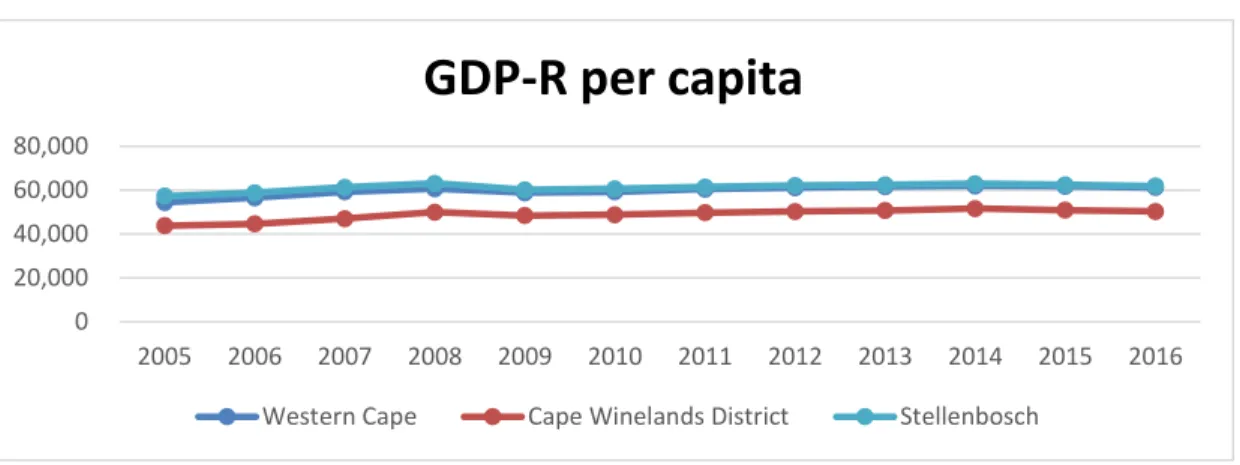
An increase in real GDPR per capita, i.e. GDPR per person, is experienced only if the real economic growth rate exceeds the population growth rate. The figure below shows that real GDPR per capita2 for the Stellenbosch municipal area (R61 871 in 2016) is slightly higher than of the Western Cape Province (R61 199 in 2016), and much higher than the CWD average (R50 239). It can be seen that although Stellenbosch has a higher GDPR per capita than the Western Cape average, the gap has narrowed in the last few years.Figure 5: Real GDPR per capita, 2005 - 2016
Source: Quantec/Urban-Econ 2017
It can be seen that although Stellenbosch has a higher GDPR per capita than the Western Cape average, the gap has narrowed in the last few years.
GDPR per Sector
These broad classifications are groupings of sectors by their main activity within the economy; primary sectors are those involved with using or extracting natural resources and consist of the agriculture, forestry and fishing sector and the mining and quarrying sector. Secondary sectors utilise raw materials obtained from primary sectors in production and consists of the manufacturing sector, the electricity, gas and water sector and the construction sector. The tertiary sector can also be referred to as the services sector and consists of the wholesale and retail trade, catering and accommodation sector, the transport, storage and communication sector, the finance, insurance, real estate and business services sector, the general government sector and the community, social and personal services sector.
The Stellenbosch municipal area has the second largest local economy within the CWD with a GDPR of R13.5 billion (2015). This municipal area has a well-developed tertiary sector; however, the manufacturing sector also contributes significantly to the local economy. The table below indicates the Stellenbosch municipal area’s GDPR performance per sector.
2 Real GDPR per capita is an indicator used by economists to estimate the income per person within an economy, and inherently the standard of living. It is calculated by dividing the real gross domestic product of an economy by the total population of that economy.
0 20,000 40,000 60,000 80,000
2005 2006 2007 2008 2009 2010 2011 2012 2013 2014 2015 2016
GDP-R per capita
Western Cape Cape Winelands District Stellenbosch
31
Table 9: GDPR Contribution per sector 2015 (%)Contribution to GDPR (%)
2015
R million value 2015 Sector
Trend Real GDPR growth (%)
2005 - 2015 2010 - 2015 2011 2012 2013 2014 2015 2016e
Primary Sector 5.7 768.8 1.4 1.0 -0.4 0.5 1.6 6.8 -3.5 -9.2
Agriculture, forestry and fishing
5.5 747.0 1.4 1.0 -0.5 0.5 1.6 6.8 -3.6 -9.3
Mining and quarrying 0.2 21.8 0.7 3.3 3.0 1.5 3.4 7.2 1.2 -5.9
Secondary Sector 24.1 3 258.8 0.5 0.4 0.3 1.4 0.0 0.1 0.1 -0.8
Manufacturing 17.0 2 303.3 -0.6 -0.5 0.3 0.4 -1.5 -0.9 -0.6 -1.2
Electricity, gas and water 1.4 192.1 0.8 0.8 3.2 1.6 0.7 0.0 -1.5 -3.4
Construction 5.6 763.3 6.5 4.1 -0.3 6.0 6.8 4.4 3.6 1.1
Tertiary Sector 70.3 9 520.9 3.9 3.5 4.6 3.8 3.4 2.9 2.5 1.8
Wholesale and retail trade, catering and accommodation
20.2 2 736.0 4.2 4.1 5.5 5.2 3.7 3.2 3.1 2.2
Transport, storage and communication
11.0 1 497.1 5.9 5.0 6.5 5.0 5.3 5.4 2.9 2.6
Finance, insurance, real estate and business services
21.6 2 925.4 4.3 3.3 4.0 3.3 3.0 2.6 3.8 2.3
General government 10.6 1 441.1 2.6 2.4 4.8 2.3 3.4 1.9 -0.2 0.4
Community, social and personal services
6.8 921.2 1.7 1.5 2.3 2.5 1.8 1.0 0.1 0.2
Total Stellenbosch 100 13 548.4 2.8 2.6 3.2 3.0 2.5 2.5 1.6 0.5
Source: Quantec Research, 2017
The tertiary sector is the main contributor to the local economies of all municipal areas in the CWD dominated by finance, insurance, real estate and business, business services sector, wholesale and retail trade, catering and accommodation sector and manufacturing sector.
The wholesale and retail trade, catering and accommodation sector, the finance, insurance, real estate and business services sector and the manufacturing sector collectively contributed R8.0 billion (58.8 per cent) to the economy of the Stellenbosch municipal area in 2015, making these sectors the economic drivers within the area.
The economy of the Stellenbosch municipal area has not fully recovered after the recession, with the five-year average growth rates lower than the 10-year average growth rates. Since 2011, growth dwindled year-on-year to reach 0.5 per cent in 2016, the lowest experienced by the local economy since the recession when the economy contracted by 2.9 per cent. The sectors contributing to the decline in growth for the 2016 period are mainly the primary and secondary sectors (excluding the construction sector). This indicates that even though the agriculture sector contributes less to the overall economy in terms of GDPR, it is still a valuable local sector.
Agriculture is also an important sector within the greater Stellenbosch area providing products such as grapes, apples, pears and peaches, for the manufacturing sector and supports many local tourism activities, particularly wine tourism. The primary and secondary sectors have experienced volatile growth rates since 2010 with the agriculture, forestry and fishing sector contracting.
Factors that will have an adverse impact on the agriculture sector, such as increasing fuel prices, changes in labour legislation, input cost increases, the current drought, etc. will therefore also result in indirect adverse effects on other sectors within the District as many local sectors support the agriculture, forestry and fishing sector.
32
The agriculture sector contributed R4.8 billion to the economy of the CWD in 2015 and employed 73 361 people of which 13 386 are informally employed. Farm workers are typically low-skilled, which leads to lower salaries and lower standards of living for these workers. The contribution in terms of GDPR of the agriculture sector is small when compared to other economic sectors. However, the agriculture sector forms the basis of many additional economic activities in the CWD and is the primary driver of tourism in the area. The farming of grapes, peaches and pears are the main agricultural activities. The production of these crops is dependent on fertiliser, of which some is manufactured locally, seedlings (also obtainable locally), labour, fuel, mechanisation (supplied locally), water and energy. Farmers also require funding and insurance, which forms part of the finance and business services sector.National and global impacts that have a positive or adverse impact on any facet of farming can therefore also influence the broader economy of the CWD.
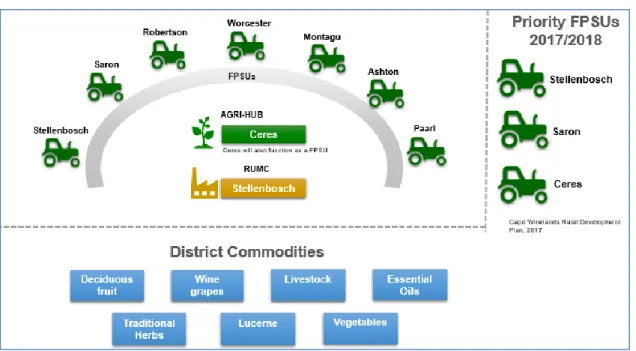
Agri-Parks
Agro-processing opportunities, such as vegetable packing facility, an abattoir and feedlot, cold storage for fruit as well as a fruit pulp processing plant, is fast becoming a key economic contributor in Stellenbosch. The below diagram outlines the locations for Farmer Production Support Units (FPSUs), the Agri-Hub and the RUMC within the CWD. The Agri-Park Programme will not only focus on the main commodities (wine grapes and fruit), but also on other commodities that are unique to the areas around each FPSU. These commodities include livestock and lucerne, as well as essential oils, traditional herbs and vegetables.
Figure 6: Agri - Park Implementation
Source: Cape Winelands Rural Development Plan, 2017
Due to the importance of the agricultural value chain, initiatives such as the Agri-Park Programme has the potential for widespread economic benefits since it will not only support farming activities but also promote local processing. Not only will these development support and generate new farming activities in the District, it will also stimulate the economy through the construction sector, the manufacturing sector (forward and backward linkages), the wholesale and retail trade, catering and
33
accommodation sector and the transport, storage and communication sector, contributing to economic growth and employment creation.Due to the importance of the agricultural value chain within the District, initiatives such as the Agri- Park Programme has the potential for widespread economic benefits since it will not only support farming activities but also promote local processing.
General Demographics of Farmworkers
The Farmworker Household Survey Report of 2014/15 reports on general demographic trends of farmworker households within the Cape Winelands area. According to the study, Stellenbosch had 811 households and approximately 3 351 people living and working on farms.
The study further indicated that there is approximately an equal split between males and females with an average age of 27.37 years. It was also found that over 66% of individuals were below the age of 35, i.e. classified as youth.
The study found that an overall of 62.63% of individuals living in farmworker households have permanent jobs both on and off the farm on which they reside. Approximately 18.1% of individuals living on farms were unemployed, while 19.27% had either temporary or seasonal work.