Immunolocalization of the kinin moiety and bradykinin (B2) receptors on synovial fluid neutrophils in rheumatoid arthritis. Immunolocalization of the kinin moiety and bradykinin 2 receptors on synovial fluid neutrophils in rheumatoid arthritis.
Demographics of patients from whom synovial tissue
Demographics of patients from whom synovial tissue
FUNCTIONAL INTERACTION BETWEEN THE
CONCLUSIONS _____________ _
INTRODUCTION
RESULTS
LIST OF TABLES
INTRODUCTION
ABSTRACT
THE SYNOVIAL JOINT
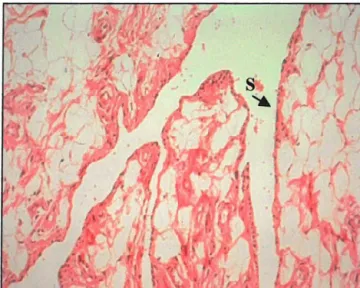
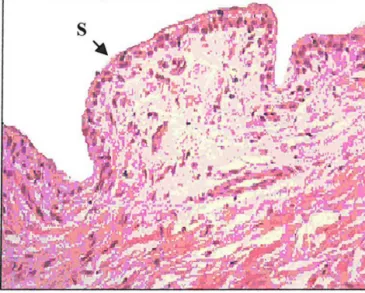
Synovial fluid is rich in neutrophils ranging from < l 000 to > 1 00 000/mm3• These pathological changes result from activation and complex interaction. Photomicrograph of synovial tissue from a patient with rheumatoid arthritis showing hypertrophy of the synovial layer (S) and dense inflammatory cell infiltrate in the subintimal layer (I).
RHEUMATOID ARTHRITIS
- Clinical presentation
- Diagnostic features
- Pathogenesis
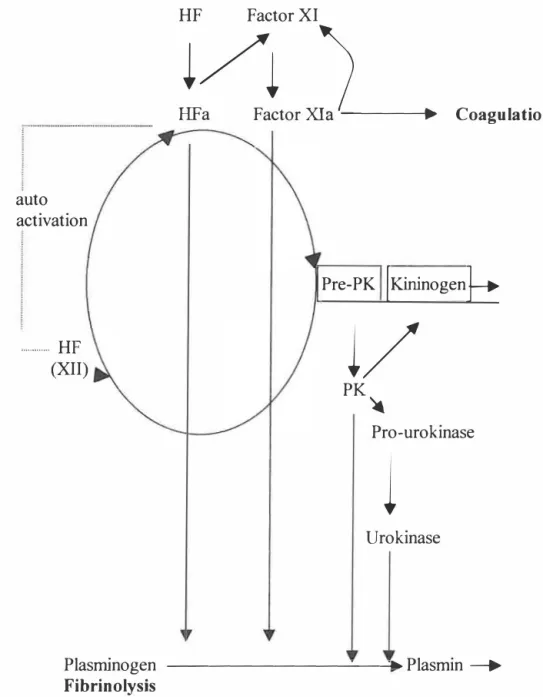
Activated HF also converts factor XI (bound to HK) to activated factor XI (Xia) which initiates the coagulation cascade (Ratnoff et al. 1961. Aprotinin (trasylol) is an in vitro inhibitor of PK and TK, and replacement of an amino acid has resulted in the synthesis of aprotinin [Val 15], which selectively binds PK and neutrophil elastase (Wenzel et al. 1986).
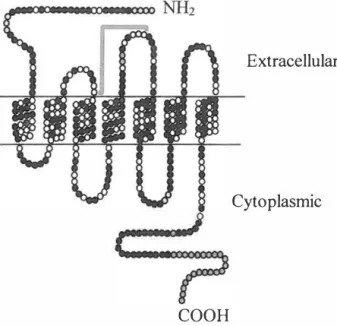
Uhl et al. 1992) and a higher density of B2 receptors has been reported in RA compared to osteoarthritis (OA). Upregulation of the B2 receptors has been reported after myocardial infarction {Tschope et al. 2000) and in response to cytokines.

I Factor
TNF complement
- Therapeutic management of RA
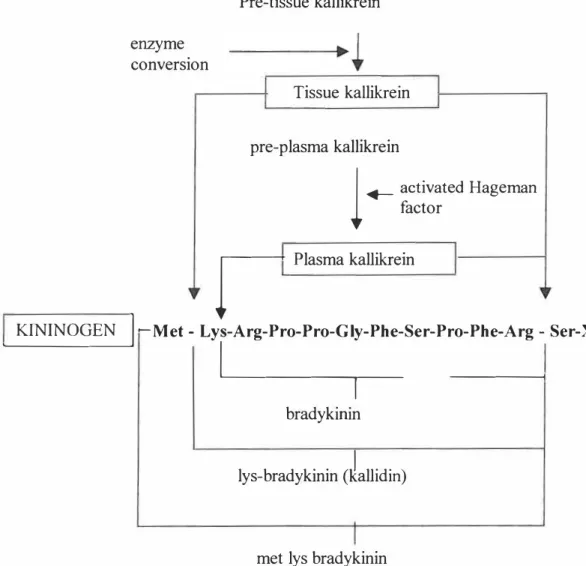
- THE ROLE OF KININ PEPTIDES IN INFLAMMATORY JOINT DISEASE Kinins are potent vasoactive peptides, with the cellular actions of stimulation of
- INTER-RELATIONSHIP BETWEEN THE CYTOKINE AND KININ CASCADES
- SUMMARY
- HYPOTHESIS
- AIMS OF THE STUDY
High levels of MMPS have been observed in the serum and synovial fluid of patients with RA (Clark et al.). Furthermore, increased KI-CPN levels have been reported in the blood and synovial fluid in patients with RA (Chercuiffe et al. 1987). PK has been identified in the synovial fluid of patients with RA (Rahman et al. 1995).
Active enzyme levels were reported to be higher in patients with RA compared with OA (Selwyn et al. 1989).
CHAPTER2
SAMPLE COLLECTION
- Ethical approval and Patient/Guardian Consent
Ethics approval for this study was obtained from the University of Natal Faculty of Medicine Ethics Committee. Permission to collect post-mortem tissue samples was obtained from Professor M A Dad�, Head of the Department of Forensic Medicine, University of Natal. Control synovial tissue was collected at autopsy in collaboration with the attending forensic surgeon.
PATIENT SELECTION
ASSESSMENT OF DISEASE ACTIVITY
SAMPLE COLLECTION .1 Blood
- Synovial fluid
- Synovial tissue
Synovial fluid (SF) was collected from the knee joint of RA patients requiring therapeutic arthrocentesis. Synovial tissue was obtained from the knee by needle biopsy under local analgesia, thoroughly washed in cold sterile saline (physiological saline; 0.9% NaCl, Sabax, Adcock Ingram, SA) at 4 °C to remove excess blood, and then suspended for 5 % formal saline (41% formaldeyd/0.9% NaCl, I: 8 v/v) for 48 h at room temperature (RT). Control synovial tissue was obtained at post-mortem, performed within 24 hours of death, from individuals who had died of trauma not involving the joints or sudden unexplained death.
Histologically undiagnosed, visually normal synovial tissue was removed and washed in cold sterile normal saline (physiological saline; . 0.9% NaCl, Sabax) at 4°C to remove excess blood before sectioning into approx.
SAMPLE PROCESSING AND STORAGE .1 Neutrophil isolation
- Tissue processing: fixation and wax embedding for light microscopy
- Histology
The slides were allowed to air dry and then stained with hematoxylin and eosin (H&E) (Appendix 2.5) to confirm the presence/absence of disease in post-mortem synovium, to determine the histological diagnosis in arthroscopic specimens and to ensure that tissue the treatment was optimal.
IMMUNOCYTOCHEMISTRY .1 Neutrophils
- Protocol for immunolabelling : synovial tissue
Three-micron sections of wax-embedded tissue were mounted on slides coated with adhesive (poly..lysine; Sigma, St. Louis). Three-micron thin sections of wax-embedded tissue sections on slides were heated on a heating block (Clifton, UK) at 60 °C for 5 min (to melt the wax). During each immunolabeling run, this tissue, demonstrating the presence of TK in human salivary gland ducts, served as an appropriate method control for the labeling procedure.
During each labeling run, the presence of immunoreactive BI receptors was demonstrated in neurons in the substantia gelatinosa of the spinal cord (Raidoo and Bhoola, 1997).
MEASUREMENT OF TISSUE KALLIKREIN IN SYNOVIAL FLUID Assays for tissue kallikrein
- Eozymic assay (amidolytic micro-assay)
- Enzyme linked immunosorbant assay (ELISA)
In this amidase assay, the enzymatic activity of TK on H-D-Val-LeuArg-pNA releases para-nitroaniline (pNA), which has a maximum absorbance at 405 nm. After measuring the total protein in an aliquot of the extract using the Bradford Protein Determination method (Bradford 1976) (Appendix 2.8), the enzyme was To determine the arnidolytic activity of TK, the blank absorbance values were subtracted from the standards, controls and samples on each plate.
The net enzyme activity of HUK standards was used to fit a curve of absorbance versus HUK concentration using Biorad Microplate Manager software (Biorad, UK).
KININ GENERATION ASSAYS
Acid-Alcohol Extraction Synovial fluid was mixed with an equal volume of 0.003 % HCI in absolute ethanol, vortexed, and then incubated at -20°C for 90 min. SPDP (13 μM in 0.1 M phosphate buffer pH 8.6, containing 20% ethanol) was mixed with an equal volume of cytochrome C (type IIS from Saccharomyces cerevisiae, Sigma, UK, 10 μM in phosphate buffer pH 2 ° and 2°6). C for 60 min. One volume of bradykinin (1 rnM) was then added and incubated at 22°C for 60 min.
ELISA procedure: The acid-alcohol extracts were reconstituted to the original volume of the synovial fluid in PBS, and the quinine concentration was measured by an ELISA method as follows.
CYTOKINE MEASUREMENTS
The standard solution was reconstituted to produce a stock solution of 32 pg/ml and then serially diluted from 32 pg/ml to 0.5 pg/ml. The optical density of each well was determined within 30 minutes using the microplate reader set at 490 runs with correction at 650 runs (Appendix 2. I 2). The standard solution was reconstituted to produce a stock solution of 8 pg/ml and then serially diluted from 8 pg/ml to 0.125 pg/ml.
The optical density of each well was determined within 30 minutes using a microplate reader set at 490 nm corrected to 650 nm (Appendix 2.13).
STATISTICAL ANALYSIS
Patient information/consent form
The 1987 revised criteria for the classification of rheumatoid arthritis*
Composition of inhibitor and buffer solutions
Fixation, Dehydration and Embedding schedule for light microscopy
H&E Staining of wax-embedded tissue
TIME
- Immunocytochemical localisation by immuno-fluorescence
- 7 Immunocytochemical localisation by immunoprecipitation
- Measurement of total protein (Bradford 1976)
- Enzymic / amidolytic micro-assay for Tissue Kallikrein
- Tissue KaUikrein ELISA
- Kinin generation ELISA
- Tumour necrosis factor a ELISA
- Interleukin 1 13 ELISA
Biorad Protein Assay Reagent (Biorad, UK) - was diluted 1/5 in RT-distilled water and 300 µl was added to each well of the plate. Calculation: Subtract the absorbance of the blanks from the RT absorbance of the standards and samples. Calculation - subtract the absorbance of the blanks from the absorbance of the standards, controls and samples.
Plot a standard curve using the absorbance of the standards versus the concentration of the standards.
CHAPTER3
RESULTS
DEMOGRAPHICS
- Patients with rheumatoid arthritis
- Controls: Blood and urine
- Synovial tissue: patients with inflammatory arthritis
- Synovial tissue: controls
For synovial fluid and neutrophil studies, 50 patients with rheumatoid arthritis who met the inclusion criteria were enrolled in the study (see 2.2). Blood samples were taken from 50 healthy volunteers who did not have any known disease and were not taking regular medications. For the study of synovial tissue, samples were taken from 6 patients with rheumatoid arthritis during arthroscopy.
Control synovial tissue was obtained from 10 patients in whom autopsy was performed within 24 hours of sudden death.

SYNOVIAL TISSUE IMMUNOCYTOCHEMISTRY
- Immunolocalisation of tissue kallikrein
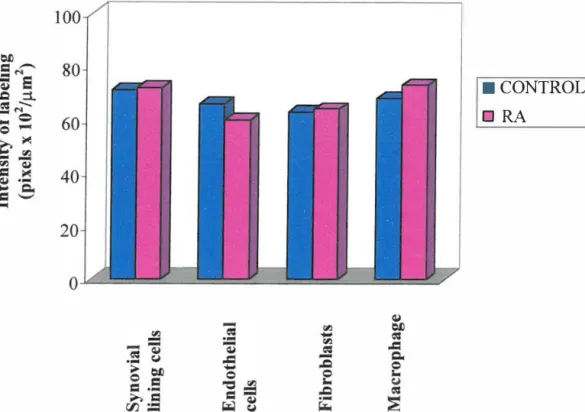
The kinin B2 receptor has been identified in human synovial tissue by autoradiography (Bathon et al. 1992a) and Scatchard analysis (Uhl et al. 1992). Therefore, this study was undertaken to determine the expression of TK, Bl and B2 receptors in normal and inflamed synovial tissue. Both control and inflamed synovial tissue samples were then immunostained to detect the presence or absence of (i) TK and (ii) kinin B1 and B2 receptors.
TK labeling in both control and rheumatoid synovial tissue is shown in Fig.
CONTROL
Immunolocalisation of the kin in Bl receptor
The quinine BI receptors have been demonstrated in the neurons of the substantia gelatinosa in the spinal cord (Raidoo and Bhoola, 1997). Shows positive labeling for quinine B1 receptors in the neurons (N) of the substantia gelatinosa (A) and absence of labeling in the method control (B). Immunoperoxidase staining. In both normal and rheumatoid synovial tissue, labeling was demonstrated in synovial lining cells, endothelial cells, and subintimal fibroblasts and macrophages.
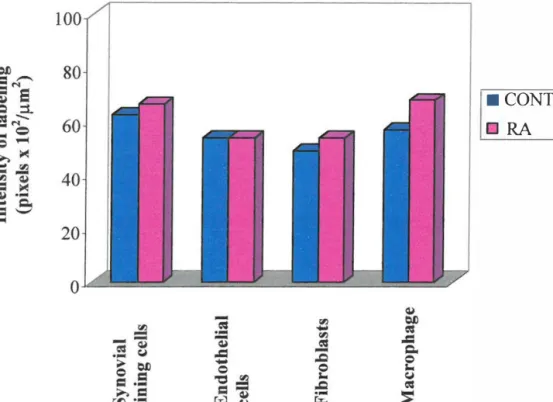
Intense labeling for the kinin B 1 receptor is seen in the synovial lining cells (S) and endothelial cells (E) in the rheumatoid synovial tissue (B and C) compared to control (A) synovium.

Immunolocalisation of the kinin B2 receptor
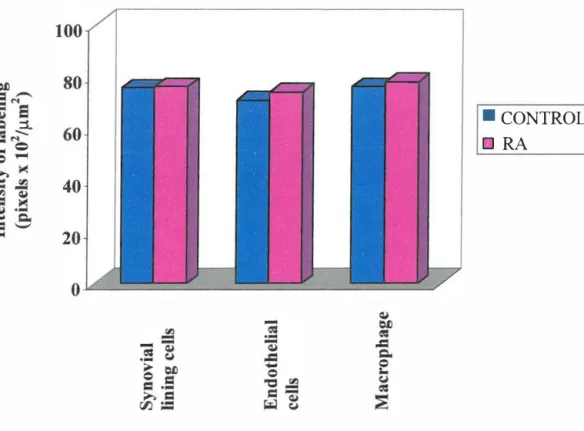
Intense kinin B2 receptor labeling was observed in the synovial lining layer, endothelial cells, and in subintimal fibroblasts and macrophages in rheumatoid and control tissue. Intense kinin B2 receptor labeling is seen in synovial lining cells (S), endothelial cells (E), and fibroblasts (F) in control (A) and rheumatoid synovial tissue (B and C).

TISSUE KALLIKREIN ACTMTY: SYNOVIAL FLUID
- Measurements of TK
- Measurements of disease activity
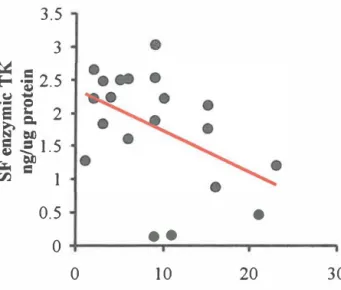
- Correlation between synovial fluid TK and disease activity
The erythrocyte sedimentation rate (ESR, Westergren method) and C-reactive protein were performed as biochemical indices of disease activity. A disease activity score (DAS) was calculated which includes the number of 28 joints for tender and swollen joints and the ESR (Prevoo et al. 1995). The levels of enzymatic activity and concentrations of antigen TK were correlated with measurements of disease activity.
There was no correlation between the measures of disease activity and the level of antigenic TC.

KININ GENERATION: SYNOVIAL FLUID
- Measurement of basal and generated kinins
- Measurement of disease activity
- Correlation between measures of disease activity and basal kinin levels
- Correlation between measures of disease activity and generated kinin levels The relationship between the measures of disease activity and the levels of generated
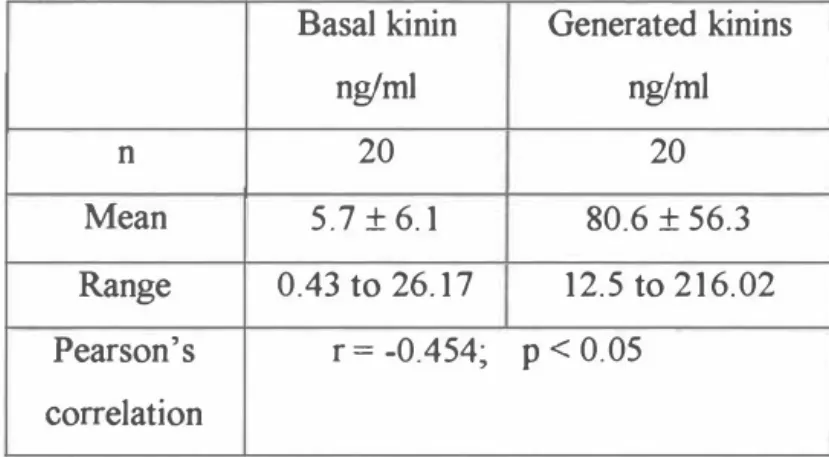
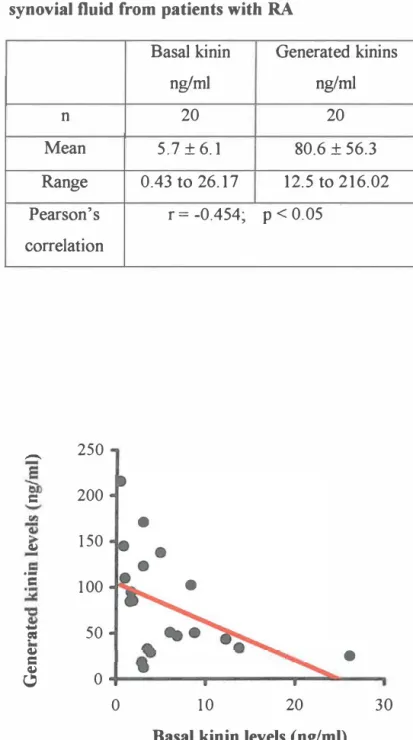
A competitive ELISA was used to measure basal kinin levels and the capacity to generate kinins in the synovial fluid (see section 2.8). The mean values for the measures of disease activity in the 20 patients in whom basal and generated kinins were measured in the SF are presented in Table 3.6. The basal levels of kinins in the synovial fluid are correlated with measures of disease activity.
There was a significant correlation between the generated kinin levels and the 28 tender and swollen joint scores, ESR, CRP, HAQ and the disease activity score (Table 3).
CYTOKINE STUDY : SYNOVIAL FLUID
- Interleukin 1 J3
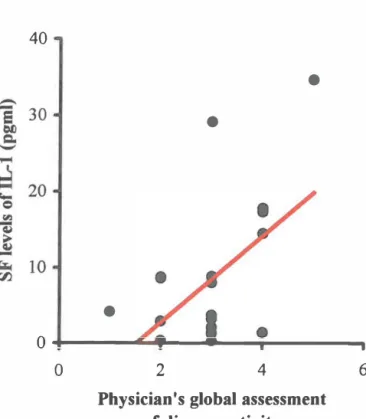
There was a significant correlation between the SF levels of IL 1 f3 and pain (VAS), the physician's global assessment of disease activity, the number of painful joints and CRP (Table 3.8 and figures). Although there appeared to be a correlation between IL lf3 and the disease activity score, the relationship was not significant (Fig. 3.29).
- Tumour necrosis factor a
- CORRELATION BE1WEEN THE KININ AND CYTOKINE CASCADES To determine the relationship between the kinin and cytokine cascades in RA. the levels of
- Correlation between SF levels of IL-1(3 and enzymic TK
- Correlation between SF levels of IL-1(3 and generated kinins
- Correlation between SF levels of TNF a and the kinin cascade
- Immunolocalisation of immunoreactive tissue kallikrein
- Immunolocalisation of the kinin moiety
- Immunolocalisation of the kinin Bl receptor
In the RA patients, there was a loss of the quinine moiety from both the SF and circulating neutrophils (Fig. 3.38B and C). Immunolabeling of the quinine moiety on circulating neutrophils from volunteers (A), and the circulating (B) and synovial fluid (C) neutrophils from RA patients. Although there was a marked increase in the intensity of quinine B1 receptor labeling on the SF neutrophils of RA patients (n=8), compared to the circulating neutrophils of healthy volunteers (n=8), the mean values are not the same. reach significance (Kruskal Wallis; .p > 0.05).
There was no correlation between the measures of disease activity and the intensity of labeling for the kinin 82 receptor on the neutrophils of the RA patients.
Clinical characteristics of the patients with rheumatoid arthritis
Demographic details of the RA patients and healthy volunteers
Appendix 3.3
Male Myocardial Infarction Male Suicide by Hanging Male Suicide by Hanging Male Shot Chest Female Stabbed Chest Male Stabbed Chest Male Shot Chest Male Stabbed Chest.
Twenty eight tender and swollen joint count
Modified Health Assessment Questionnaire
- Dressing and Grooming Are you able to
- Rising
- Eating
- Walking