SOUTH AFRICAN SOLAR RADIATION SURVEY.
The instruments were ereeted on an open space near the nurses·
home. They 11 ere ::;et up on a pillar 4 feet aboYe the g-round. U nfor- tunutely one of the instruments broke down in DeeemLer and could not be repaired until May as spare parts had to be ordered from ..l!.:urope. Thus measurements of the total amount of sun and sky radiation were only taken from July until Deeem ber, 19J7. ln May, 19a8, the instruments were transferred to the Boyden Station Observatory and were regit>tering there the foll01nng June.
(b) The Total Amount of Sun and Sl~y Radiation at Bloemfontein.
As measurements of the total amount of sun and sky radiation are not availalJle for the months J anunry until June, 1938, it is not possible to discuss the main features of the amount of the radiation obtaiued during the course of the year except for the first six months.
Graph II shows the total amount of sun and sky radiation for every day.
During the period beginning- with July ancl ending 1vith September, fine, cloudless winter weather predominated, resulting in a steadily increasing amount of sun and sky radiation. ln October and November, the preYailing influences on the amount of radiatiou were the altitude of the sun and infrequent cloudy weather, resulting- in a further steady increase of intensity. A marked intiuence on the radiation due to the rainy weather 1vas only noticeable t01varJs the very eno of N oveml:er and during December. This is also shown by the fluctuation from the monthly average amount of sun and sky radiation (s11e Graph~).
3. The Radiation at Nelspoort Sanatorium.
(a) General Remarks.
N elspoort Sanatorium is situated in the Karroo and in spite of being lo!'ated on the edge of it, its climate is typical of that area (Long. 23° 011 E., Lat. 32° 091 S., 3,319 feet abo\-e sea-level).
The instruments were fixed on the roof of the new European ward.
The characteristic features of the climate at N elspoort are the follDwing-: For pressure conditions refer to general remarks on Johannesburg (see page 360).
In summer: the prevailing wind direction is south-south-east;
mean air temperature 73° F. with very marked diumal fluctuation; low relative humidity; small rainfall and little cloudiness.
In winter : prevailing winds from the north to the west sector;
mean air temperature 51° F., influenced by the strong lincident radiation during daytime and loss of heat through out-1..-ard radiation at night; extremely dry; almost cloudless RkieR.
'-·
367-368
369-370
G. lUEMERSCIIMlD.
(11) Tf,c Totab dmo11nt of Sun (llld Sky Hadiation at irelszJMn-t
,\anato·ri'U?7~.
The total ;lmount of su11 and sky radiation is gin·n i11 Uraph llJ.
J~xcept for a le1r fairly clotul,v clay;:; u Yery steall,Y total amom1t
of ::;lul and :>ky r<~cliatiou took place from J ul.r until the middle of
Uctoher, prodnciug a Yery long pe1·iod of increa~:;iug intensity. 'l'ben the illHueuce of the rainy ljeawn commencell. 'l'he three· months, XoYemlwr, Decembm· and .fmmaty had an equal mean amount of radiaiion 'ritl1 many J"<1the1· cloud;.· <lH,vs; but tllere we1·e also bYo cle;t r pe1·ioch> of Hbout I tloys e;H:h 11·.ii h o1·er SOU calories per sc1uare
<·entintPi n· Jler <lay, whicl1 j,., a Yel·_v latgt• amount. During the
foJlowi11g JUOJJths llleaSlU:ellleJIJ~ \I"PrP only i<1ken periodically and
<·<Ill therefon· not he <lisrussed.
4. T!u~ Narlinlirm nt Durban.
~a) Ueneral Hcmarl.:s.
'l'l1P HPIY Tuhercul.osi~ U ospiLil ii"HS still under construction and tbe measuren1ents of the NoLn lbdiatiou Sun·ey at Durban vve1·e therefore, carried out at the .A.erochomP (Long. ~no O:Y E., Lat. 29°
:W/ ~., :!U feet aboYe sea·lewl).
The inshulllettt::; \Yete set up on the roof of ti1e new Aerodrome 1Juildings. '.l'he hori:wn was c1uite dea1· except for the Derea ridge sltat1ing the i11shuments ;;hartly beforP sunset.
'l'he climatic conditions at ])urban may he briefly sunnnarised
<IS :f'o llO\\"S : -
1 n :; ununer: pre3::>ure relati 1·ely lo"·; the preYailing >rinds blow along the coast, eitht·r from n-orth-east or from south-\Yest; mean air temperature 7!'!0 P.; Yery humid, the summer being the railly season; cloucl an1o11nt u;;unlly high especially ''"ith south-\Yesterly ,,·imls.
In winter: pres::mre relati1·ely high; \Yinds sho11· a tendency to blo,,· more ·Oft the land; mean air temperature 64° F.; humid; still n. fair amount of clmHls (lnP to proximity to the ocean tl10ugl1 m11<·h less tl1nn iu summer.
(/1) 'l'11e Total flmounb of Sun and Sky l~adiation at D1truan.
'l'he total amount of suu aml sky radiation at ])urba-tt 1s glYeu in Graph IV .
.After three months of winter conditions (July, .August and Septelllber) including several periods of about 10 clays when the radiation \Yas practically undisturbed, the beginning of Oc,toher brought IYith it the distinct change to summer eonditions. The rainy season lasted until February, rechwing the n1diation considerably. Cloudless da:·;is ''"ere quite ml·e. At the encl. of February there \\·ere 8 days of clear \Yeather, followed h;.· another period of dec·reased sun anr1 sky radiation. 'Chis decrease was not as pronouneed in
33 T;'l
:SOUTH ,\YHU'.I:\ SOL.\1! IU.Ili.\'JJOK Sl'H\'1-:Y.
M.an.:lt as in .April. 'l'he11 a dwuge io dear 11·iuier weather conditions took placP. 'L' he amount of ntdia hon \\·a K neYerth eless not Yery l rnge because of the lo1Y altiturle of ilw Sllll in 11·inter.
During four 11·inter months, :r1lly and ~\ugust, Hl37, and l\Ia:v and June, 1038, lhe fluctuai.i.on from ll10 <l ,·rrflge monthly amount of sun <lnd ,;];-~~ radifltion "·as snnll. Dm·ing the otl1er months the radiation 1·aried considerably from <ln_,. to clay. This fact has to be taken inio a!·r·oJillt as fill impori<llli fa1·ior of the rarliflhon dimniP at Durh<n,.
f>. '/'h, /(adiation ret Port Elizabeth.
(a) Ueneml Nemarlcs.
Pmt Elizabetl1's geographical <bLi <In·: J,ong. 2r1° ;)71 1<:., ·Lai.
33° 371 S., 250 feet ;~hove sea-leYel.
'flie Solar H:l(liution Stalion \\·:1s set up on the grouncls of tlH•
new Lady Don kin Tsobtion Hospitnl. The locntion of the instrument"
was 11ot fayourahle because they "·e1·e shaded lluring the earl.)·
morning and late r1Hen1oon by ::;ome h!'e.;;. :NeYeltbeless this place
\Yas chosen as it roul1l not he improYed 11pon at an~~ of tl1e othe1·
hospitals in that m·eu.
Port ElizalJeth, sit uaterl Oll Ll1e south r·oasi of the ('ape J>r01·im·P, falls in the climatic zone wl1id1 receiYes rain in all seasons.
Prevailing 'IYincls are from the enst and west, more or less along the coast; mean air tempemhue i11 smmnPr 70° F., in winter 59° F.;
in late "·inter occasim1ally hot, dr:v antl unpleasant north-'IYesterly
\Yin1ls; cloud amount fairly l1igh tln011glwnt the .\~ear.
(b) 'l'ornl Amount of Sun and Sl.·y Rmhotio11 at Port Eliw!Jeth. 'fhe total amount of sun and ,;ky mcli<lhon, as sho1Yn in C:haph Y, rlemonstrates the influenre of the ruins ocrurring in all season. There was no rlefini le peri ocl of uninterrupted mdiation as at the inlanrl stations with snmmer rainfall, nor the dear summer season m; in Oapetmm. On the other hand, partl~r dourly clays \\·itl1 n large amount of radiation occurred frequent]~~ for the reason, ihat thP reflection from the clouds increases the total intnnsitv when the Rllll
shines beh·een white clouds. ·
'!'here were large and frequent fluctuations from the mean monthly amounts.
G. The Radiation at Capetown.
(a) General RP?narlcs.
In Oapeto1Yn the instruments \\·ere established at the Royal
Observatm·.\~ (Long. 10° 28' K, Lat. 33° 561 S., 40 feet ahove sefl- lrwl).
The inshuments were fixed m1 the roof of the main building, freely expnserl to tl1 e elements.
373-374
375-376
G. lUEMERSCHliHD.
Important for the conditions prevailing at any particular place in Capetown is its position on either the southern, eastern or northern slopes of 'l'able Mountain, because cloudiness :111(1 rainfall are strongly influenced thereby. Thus quite a pronounced 1·nriation of these elements exists within a limited area.
The main features of the climate of Capetown :ne those of the winter rainfall area.
In su?nm,er: fairly dry and clear weather; winds almost exclusively from the south to south-east; mean air temperature 71°
F.; cloud amount fairly lo1Y during the midsummer mollths.
In u·inte1·: prevailing winds from the south-ea<>t- and north- west, the latter resulting in rloud.v and miny weather; mean air temperature 56° F.; both humidity and cloud amount high; \Yeather frequently unsettled.
(b) The Toud .1 mount of Sun and Sl.:y Radiation at Caz1etown.
The influence of changing \Yeather conditions in Capetown is at once obvious on looking at Graph VI, which shows great variations of the total amount of sun and sky radiation nearly the \Yhole year round. The interruption of fine clays by cloudy days reduced the radiation again and again. It is certain that this must be of great importance to biology, particularly to plants, \Yhich are exposed to this frequent change of light intensity.
The fluctuation from the month ]y mean amount of radiation was very great all the year round. ·
Another important conc1usion which can be drawn from Graph 6 is the fact, that Cape To,vn was the place which received the greatest 1rwnthly c~?IUJurnt of mdiahon during the. pe~·iod under invesigation. This was clue to the fact that the dry summer season coincides with the highest altitudes of the sun. A period of more than six weeks (from the 1st of December until the 12th January), interrupted only by a few cloudy clays, brought a daily average amount of 797 calories per square centimetre, a remarkably great intensity.
On the other hand, the influence of doucly weather was sometim.es very gTeat. It reduced the total amount of sun and sky radiation considerably, e.g. while 740 calories were registered on one clay
(12.1.1938), only 110 calories occurred the next.
The significant features of the total amount of sun and sky radiation in Capetown were:-
(1) A steady increase of the mean total amount with the increase in sun's altitude.
(2) A period of comparatively many bright clays with a great amount of radiation from December until the middle of February.
(3) Great fluctuations from the mean total amount during the remaining months.
35 377
SOUTH AFRICAN SOLAR RADIATION SURVEY.
COMPARISON OF THE TOTAL AMOUN'l'' OF SUN AND SKY RADIATION OBTAINED AT SIX STATIONS IN THE UNION.
1. Comparison of the Monthly Average Amount.
The amount of radiation impinging on a horizontal surface at any particular place depends mainly on two factors: firstly, on the altitude of the sun, or in other words on the angle of incidence of the rays, and seoondly, on the atmospheric disturbances such as the cloudiness, water vapour content, and amount of dust and other particles in the air.
(a) The Inland Stations.-Graph VII shows the average monthly amount of sun and sky radiation at the six Solar Radiation Stations in the Union. It indicates that the influence of the sun's altitude was the dominating factor at the inland stations during the winter months (July and August 1937 and June 1938). This is proved by the following fact :-
The greatest total amount of radiation during these months was experienced in the most northern station, Johannesburg, where the sun's altitude is greatest. Taking the average amount of radiation for cloudless days only, a comparison of the three inland stations shows, that Johannesburg again received the greatest amount. Next in order was Bloemfontein and then N elspoort Sanatorium. After August, 1937, the atmospheric disturbances influenced the total amount. Johannesburg no longer experienced more radiation than the other inland stations further south. This refers to the months October and November 1937, when the rainy season was not yet very pronounced. In December and January the sequence -of the amount of radiation experienced from the north to the south was opposite to that in winter. Nelspoort had the greatest amount followed by Bl,oemfontein and then Johannesburg. A comparison for the months February until May, 1938, is unfortunately not possible due to the absence of readings at either Bloemfontein or N elspoort.
In June, 1938, the sequence of the amount o£ radiatiou was again from north to south as during the winter months 1937.
(b) The Coastal Stations.-Before comparing the results at the the three coastal stations, the following facts have to be empha- sized : -
(1)
(2)
Cape Town and Port Elizabeth are situated at the same latitude, 340 S., which resullts in an equal altitude of the sun in both places. Thus, as far as the influence of the sun's altitude is concerned, the total amount of radiation in Cape 'l'own and Port Elizabeth should be equal. Any difference in amount must consequently be due to atmospheric conditions.
Cape Town is situated in the small area of pronounced winter rainfall; Port Elizabeth experiences rains more or less the wholle year round "·ith no distinct rainy season.
D"';l-rban, situated at 30° S., lies· in the area of summer ra1ns.
GltAPH VII. Monthly flveTage Amount of Sun and Sky Radiation at Six Stations in the Union. July. August. September. October. November. December. January. February. March. April. May. J. B. N. J. B. N. J. B N. J. B N. J. B N. J. B. N. J. J. J. J. N. J. 800 ~
! l l 1 l ! l l l l l ! l ! l ! ! ! ! l ! l l
0 700 600 c.;, 500 -:( c:o ~ 400 300 200o--0-.o I
f
p ~
P..., I 0 I v"o 0 ,d I '0 I 0 I o' I
::\
o' I d 0 9/ I I 0, 'o·"o I I
~
I I 0 '0---o d
~
0 0 'o CA. 'o-0 ''-o -o ~
' 'a..
~ ' ''0 'o 100t t t r r t t t t t t t t t
tt t t t t t t t t t t t t f l t t t
D. P.E. C.T. 0. P.E. C.T 0 P.E. C.T. 0 P.E C.T. D. P.E. CT. D. P E. C.T. D. P.E. C.T. 0. P.E. C.T. D. P.E. C.T. 0. P.E. C.T. D. P.E. C.T. J. -Johannesburc. B. -Bloemfontetn N • Nelspoort 0 • Durban. P.E -Port Elizabeth. C.T.-Cape Town.June. J. B.
! ! ~
o,'
'o--0t t t
0. P.E. C.T.Q ~ H t;::j .... ..., t:J ~ rn 0 ~ ~ H t;;
SOUTH AFRICAN SOLAlt RADIATION SURVEY.
The results : -
Cape Town and Port Elizabeth experienced a similar amount of radiation all the year round exceP.t for two months, namely December and January. During these two months a considerable amount of radiation was recorded at Cape 'l'own where the clear summer season then coincides with the greatest altitudes of the sun. 'fhis amount not only exceeded that of Port Elizabeth but "·as also greater than that at any of the in1land stations.
The third coastal station, Durban, had a greater amount of radiation than the other coastal stations from July until September, 1937, and again from March until June, 1938.
This applies to the monthly average as well as to the amount obtained on cloudlless clays. During the rainy season (October until February),however, the reduction of the radiation by clouds was so effective that it could not be compensated for by the greater altitude of the sun in this most northerly coastal station.
(c) Comparison of the Inland and the Coastal Stations.-Another interesting comparison is that between the amount of radiation registered at Durban and at Bloemfontein, because both are situated at about the same latitude. 'l'he approximately equal altitudes of the sun at both stations result in nearly the same angle of incidence of the sun's rays on a horizontal surface. Differences in the amount of radiation were accordingly due only to atmospheric disturbances, i.e. the differences in atmospheric conditions at sea-leYel (Durban) and at an altitude of 4,500 feet (Bloemfontein).
As far as readings for Bloemfontein are available, a comparison with the Durban readings shows that the amount of radiation at Bloemfontein was always greater than the amount registered at Durban. This result could be expected because of three factors present at Durban:-
(1) (2)
(3)
The greater amount of cloudiness at the coast.
The reducing influence of smoke and carbon particles in the area of a town and harbour in contrast to clear air conditions at a place like Tempe Isolation Hospital ,...-hich is situated 5 miles out of Bloemfontein.
The influence of a thicker layer of atmosphere above the sea as compared with the thinner layer above the high veld.
These points are mentioned here to indicate that there are also minor factors influencing the am~unt of radiation at any particular place, namely the altitude above sea-level and the locaJl atmospheric conditions.
Referring to Graph VII again there is still another result which can clearly be demonstrated from this graph. The a?1WW1t of radiation ?'ecoTded at the inland stations exceeded the am,ount at the coastal stations p1'actically all the year round. 'fhis is also shown in Table 1, \vhich gives the monthly total amount of sun and sky radiation for the six stations in the Union.
G. IUEMERSCHMlD.
'J.'ABLE 1.
Monthly Total Amounts of Sun and Sl~y Racliation at Six Stat£ons in the Union.
.J[onth.
I Johannes-
burg.~
fontein. Bloem-I
Nelspoort.l Durban .I
Elizabeth. Port Town. Cape rJuly ....... 12,436 10,883 v,r,o9 9,26:2 7,977 6,614 August ... 14,373 13,536 10,872 11,341 10,330 9,686 September ...
.... .
15,052 16,187 13,858 13,409 12,582 12,371 October ......... 18,389 18,525 17,633 13,158 16,031 17,105 Xovember ........ 20,544 20,691 20,385 16,223 18,451 17,644 December ....... 16,897 20,520 20,979 14,186 19,268 22,301January ........ 18,087 - - 17,451 18,606 20,698
February .. ... 16,604 - - 14,999 16,919 17,389 }[arch .......... 17,299 - - 15,733 14,754 15,404 April. ........ 11.712 - 10,186 10,559 9,769 9,487 :VIay ......... 12,324 - -
I
9,849 8,236 7,1.87 June ............. 10,008 9,289 - 8,645 (i,777 6,945
'l'he figure,; in this table giYe the total monthly amount~ of radiation in calories impinging on one square centimetre of a hori- zontal surface. The figures in black indicate the greatest amount for each station, the figures in italicR sho"· the small est amount for each station.
The figures in Table 1 are Yet.\· instructiw. They sho\Y the following outstanding features <lnring- t11P course of the year:-
The greatest monthly amount of radintio·n in thP Union was obtained by the following stations:-
During-
July and August, 1937.. 2 months September, October >tnd November, 1937 :3 months
December, 1937, Jam.ary anc:l February,
1938................... 3 months . \larch, April, ?\lay and June, 1938. 4 months
in Johannesburg.
in Bloemfontein.
in Cape Town.
in Johannesburg .
'l'his sho,vs that during six months of the year under investig-a- tion, Johannesburg of all stations, obtnine<l the grealest :lmount of radiation. But it is also possible that during some of these six months the amount at Bloemfontein may have been g1·eater. During :tt least three other months B'loPillfon tein Te('Pi vecl the greatest amount of radiation.
'l'he distribution of the monthly maximum amounis of radiation obtained in the Union may be summarised as follows : -
During nine out of twelve months the grerLtest mnounf of rac/.;iation was obtained in the cli1natic zone of the h1:_qh1Jeld. During the 1'emain1:ng three months (Decmnbe1·, 1937, January and Februmy, 1938) the greatest amowd ll'as J·econl ed in Cape T men.
381
SO"CTH AJ:'RTCA» SOLA.lt JtADlATlOX Sl:RYJ::Y.
The snwllest amount of rad·iation in the Union u·as obtained at the following stations : -
During -
July, August and September, 1937 ... . October, November, December, 1937, January and February, 1938 ... . )[arch, 1938 ............. ..
3 months 5 months 1 month
in Cape Town.
in Durban.
in Port Elizabeth.
April and May, 1938 .............. . 2 months in Cape Town.
June, 1938 ....... . 1 month . . . in Port Elizabeth.
This may be summarized as fo'llows : -
Dwing all the twelve months the snwllest amount of radiation was obtained at one or other of the coastal stations.
In five of the twelve months Cape Town reco1·ded the least;
during five othe1· months Duruan received the snwllest amount. It has to be considered, however, that the " greatest " and
" smallest " amounts are often not very outstanding, as the differences between the total amounts at the various stations were sometimes relatively small
After r1iseussing the <1uestion tt•here the greatest and smallest amounts of racliation were measured during the course of the year it is perhaps relevant to consider when these values were obtained at the v:nious stations. The figures in Table 1 show that:-
At each station the greatest amonnt of radiation occun·ed
d~tring the months .Vovember o1· December, 1937. The smallest amounts were recorded during the months of l1tly, 1937, and June, 1938.
Furthermore it is of interest to compare, at each station, the ratio of the greatest to smallest monthl:v amount of radiation. These figures are giYen in Table 2.
TABLE 2.
Di.ffe1'('11r·es het1cewn the Greatest and the Smallest lJ!fonfJhly Am01mt of Radiation at Four Stations in the Union.
Greatest Name of Station. Monthly Amount.
Johannesburg ....... . 20,544 Cape Town ..................... . 22,301 Port Elizabeth ........... . 19,268 Durban ................... . 17,451
Smallest Monthly Amount.
10,108 6,614 6,777 8,645
Ratio.
2 ·1 : 1
3·4: 1 2· 8: 1 2·0: 1
G. RIEMERSCHMlD.
The ratios are of particular biological interest in botanical and veterinary science because they demonstrate the extremes to which plants and animals are exposed while living in the open all the year round. The figures in Table 2 indicate that:-
Johannesburg reg'istered during the month of greatest radiation, twice as much solar ene1·gy as it did during the month of lowest radiation. Capevown, Po1·t Elizabeth, and DU1·ban 1·eceived in the month with rnaximum 1·adiation respec- tively 3·4, 2·8 and 2·0 times the amount that was registered dur,ing the month with minimum radiation.
Before concluding the discussion on the monthly total amounts of radiation at the six stations in the Union it is of interest to show their distribution over the year on a graph, as given in Graph 8.
Referring to the various stations separately the main features of this graph may be summarised as follows:-
The amount of radiation obtained shows, in all six stations, an increase and decrease with the seasons. Johannes- burg received a rather irregular amount of radiation during the cowrse of the year. At Bloemfontein and Nelspo01·t the increase of th~ monvhly amount with the inc1·ease of the aZ.titude of the sun was 7J'rogressive. In Durban great 'Garia- tions of the amount of mdiation occu.rred from month to month. Port Elizabeth showed a ve1·y regular dist1·ibution over the year. In Capetown the amo1lnt also increased and dee1·eased steadily in accordance with the sun's altitude, but showed distincvly high 1·eadin,r;s in Decembe1· and January.
2. Compar,ison of Half-Yearly Total Amounts of Sun and Slcy Radiation at the Six Stations in the Union.
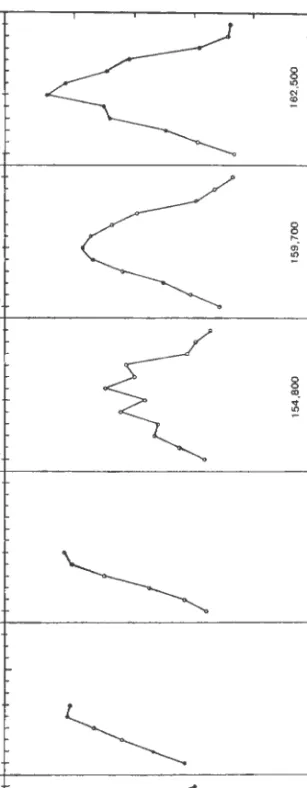
The total amount of sun and sky radiation for all six stations is only available for the first half-year of the Solar Radiation Survey 1937/38. Table 3 gives the figures for July until December, 1937 (first half-year) and for January until June, 1938 (second half-year) separately.
TABLE 3.
Yearly Total A mount of Sun and Slcy Radiation at Six Stations in the Union.
INLAND STATIONS. CoASTAL STATio.·s.
Johannes- Bloem-
Nelspoort. Durban. PorL Cape
burg. fontein. Elizabeth. Town.
First half year ..... 97,700 100.300 92,700 77,600 84-,600 85,700 Second half year ... 86,000 -
-
77,200 75,000 77,100Total for the year. 183,700 - - 154,800
I
159,600 162,800383
20,000 15,000 ~ 10,000 " •.ooo
July.
GRAPH VIII. Monthly 1'ota~ Amounts of Sun and Sky Radiation and their Distribution over the Year. JOHANNESBURG. BLOEMFONTEIN. NELSPOORT. DURBAN. PORT ELIZABETH. Dec. JuneiJuly. Dec. JuneiJuly. Dec. June I July. Dec. June IJulv. Dec. JuneiJuly. Total: 183,000 154,800 159,700
CAPE TOWN. De<. June 162,500
w 0 c:j >-3 t:Q i> ":! 1=:1 H (") i>
z
w 0 t"' ~ 1=:1 i> t; >-< i> .... ,_:j 0z
w c:j 1=:1 -<: t-l ><u. ltiEhlERSCHl\IlD.
Summa ritlill g- 'fable 0 sho\YS the following :-
Dnr·ing the ji1·st havf-year under investi,qation the total amournt of sttn and sky radiation was largest at Bloemfontein, next in anwunt teas that at Johannesburg and then N elspo01·t Sanato1·-iwn. At the coast, Capetown and Po1·t Elizabeth had an app1·oximately equal amount of radiation. Durban's amount was dist1:n.ctly smaJller, lwuiu,r; recei·ved 22 per G'ent. less mdiation thnn Hloe mfontein.
The second half-year siwwerl a greater amount at Johan- nesburg than at the coastal stations. Tl1 ese exzJe?·ienced a fairly eq1wl amount dm-inr; the pen.od.
The total for the year teas distinctly lm·.r;er at Johannes- liurr; than at the three coastal stntions.
3. Comparison of the Amount of Sun and Sl.:.y Radiation at Johannes- lnt?',r; 1cith that at Three Other Places in the fl7 odd.
In order to gi,·e the reader a better general interpretation of the facts and figures given in the fmegoing te:x t it "·ill perhaps be o± interest to present a comparison of these results "·ith those obtained at places in other parts of the \Yorld. The readings from the follo"·ing places were r hosen for this comparison :-
(1) Johaunesbmg, South Ahie:n, 5,800 ft., 2R0 S., readings from Jul~·, 1937, to June, ]938.
(2) Nairobi, Kenya, U,OOO ft., 4° S., readillg'S from December, 1934, to May, 1935.
(3) Davos, Switzerland, 4,700 fi., 47° ~-, rearlingR during the :vears 1920 an c1 '1921.
( 4) Bad N auheim, Germany, 450 ft., 50° K., readings during the yenr 1935.
The local conditions of .T ohannesburg have already been discussed. Nairobi, capital of Kenya, is located on the East African Highlands, about 400 miles from the roast. DnYos, the famous health resort in Switzerland, is situatec1 in a wide open mountain Yalley, and Bad N auheim, a well ]mown spa in Germany, lies on the north-eastern slopes of the Tnunus, a mountain o£ medium height, nnd represents an aYerage semi.-humicl climate at low altitude.
Table 5 gives ihe monthly ave1·ng'e amount of su11 ~mel sk~~ radia- tion for the above-mentioned placeR.
A comparison of the figures in this table is mmc> signifirrtnt
"·hen considering the conditions mentio11ef\ in 'r::1 blP 4.
3G 386
~UrTH .\l'RIC',\?\ SOL.\H li.\lli.\TlOi\ "l"HYEY.
::.
Place.
'l'AllLE .J..
1.. Range of SLtn's Culmination.
Highest. Lo\\·esl.
2. Altitude Above Sea-level.
:~. Yearly Average Xum ber of
Hours of llailv Sunshine.
---~---~---~----
Xttirobi ....... . 68 6·000 ft. 6 :3 hr.
Jolumncsbu,·g .. 5·800 ft. 8 7 hr.
])a,vos ... . 67 20 +·700 ft. .) (\hr.
.B>td ~auhcim .. 62 16 4ii0 ft. :3 · 8 hr.
'1'.-UJLB 6.
Jfuntlrly Arcrayc .lmuuni uj Snn and Sk.r; Radiation at Jolranncsluu(J and Tlnee Othc1· Places i11 the lVorld.
l\lonth.
July ... . r\ugust .... . . Neptcmber.
October ...
.\fovem bcr.
Decem her.
January ...
l~c bruary . .\[axeh ...
April. ....... -I ~ .\lay ......... ~ "l:!
.Juno... . ... j:;:::
Total for the Y em· ...
SouTHER~
HG~!ISPilF.RE.
Xairobi.
61!) 66.)
-~66
il87 i5+8 40:3
Johannes-~ burg.
+01 +M 502
603 593 5:58 390 398 :334 183,700
- - - -
l\Iont h.
J">tnuary .... I <;
February ...
t
;~:llnrch ... j ;::::
.-\.pril .... -I
~Jay ........ I o.: ~ June ....... ~ ~~
8<-o!.
July... ~~
.-\ugust ..... I '"'"'
September .. j
~~~?o~!~~; .. : ~ ~
December .. J §:
- - - - · - - -
]\f OR'l'HEH~
Hr-:~n~Pu F:Rl·:.
I
Had Nauheim.
- - - ' - -
.lfi4 i57 307 1:2-1-
+70 :w+
ii28 :!HI
.)38 +!Hi (i:!l .)~7
640 ;;:J:l :511 -13:~
468 :!87
:3:)8 lH+
l91 72
14-1 ii:3
150,029 103,380
In "·inter (Southeru <lllll :\"" orthem hemi,;plwrt') the amount of radiation "·as much larg-er at Joltannesuur.r; tball at DaYos and l l l
the latte1· again far superior to the amount at Jh<l Xauheim. In summer the greatest montbly <Herage <lmouut in naros \Yas slightly hig-her than that at .Johanneslmrg-.
;rairobi experienced lluri 11p: p1 adi<"all.v eYery month in tlw perio<l Unller inYestig-ation a gTe<lter-amount of rarliatio11 than the other
places. This i,; lll<<illly <lne to the g-JPatPr altihl(lps of the ,;una,; 11·ell as to tl1e fad that 1·ery freq11elJI.ly, white t"umnli clouds ,,.Pl"E' sr·a1tPrP<l OYer the sky, causing a further incre<\Se in ra<liation hy reflection.
LX. IUE.\lEl~SClUIIJJ.
/Jad .\"auhe·im receiYecl a Yety much smaller amount of r:uliation tkut ])n.,·os aud the other places all the year ronnel.
'l'he ratio between the month with the largest and the monilt IYith the smallest amount of radiation was 2 · 0 : 1 at J ohannesb1.ug.
lu D<.n·os is was 4 · 5 : 1 and in Bad K auheim 10 · 4 : 1, which sh011·~
<l.istinctly that tl1e difference between summer and winter is Yery much more pronounced in these t"·o latter places than nearer the equator.
R.eferring to the yearly total amount of sun and sky radiation tlte figures shmY that the slightly greater amount at DaYos during- the b1·o midsummer months compared with Johannesburg does 11ot compensate for the smaller amount during the other months. 'l'akiug tlte yearly total amount at DaYos as 100 per cent., Joh:mnesburg receiYecl 122 per cent., "l"l'hilst Bad Nauheirn obtained only 69 per c-ent. It has to be emphasi7.ecl, hmYeYer, that Da1·os does not represent general European conditions. On rrcconnt of its situation in a higl1 :tltitucle and the clear· aml hequcnlly cloudless atmospherP over the Alps the radiation in particular is rhfferent from that in the lowlandR.
Bacl N'auheim is more likely to represent the general conditions in Europe.
A further interesting item may be stressed, i.e. the :H:nl.v
;nemg·e number of hours '"ith sunshine (Tahle -±). The.v Hllo11· very dearly the excessive amount of sunshine in Johannesburg, rrncl the Hnperiority of Davos over Bad N auheim. The yearly nYer:1g-e for London is 3·8 hours of sunshine per day.
'l'hel'le romparisous may brief1y he l'lllmnwrised as follo11·s:-
!u winter t/u; au1ount of sun and sky radiation {(/; Johau- 'JJeslwrv teas distinctly laryer than in Daros (S1ciLzel·land) at similar alvitude abme sea-le cPI. 1 t was 5 to 10 times larger than in Bad Nauheim (Ur:nnany) at a lo1c altitude ahwre sea-le eel·.
/Juring two nwnths in mirlsu1nmer the a111ount at D(wos tcos slightly larger than that du rin.r; the resper-ti re months 'in Johannesburg.
Nairobi (Kenya) e.xpe1'1:encNl during the si.'C months 1mder i11 uestigation a g·reater amount of u~diation tl1nn any of tl1 e
other places mentioned in th-is comparison.
Tho ratio bettcr:en hi.r;l1est sum?nter and lou·est 1cintpr 'readings pe·r month 1ws 2·0 : 1 at Johannesbu1·.r;, 4·5 : ] at
Da1;os, and 10 ·4 : 1 at Bad Nauheim.
The yearly total amou1d at .Jolumnesb1~r.r; 1crts 122 per c'r:nt. of what 1cas recei'Ved in flm·os; Bad !Ycmheim olJtained only 69 per cent. of tlwt amount.
087
SOL"TH .U:'IiH'AS SOLAl{ lL\DlATIOK SURVEY.
F. THE RESULTS OF THE COOLING TEMPERATURE MEASUREMENTS.
'l'be following chapter deals with the n·sults of the cooling terupe1·ature measuremeuts.
It has been mentioned before (see page 351) that the cooling temperature is a "·ell-defined physical unit \Yhich is approximately equal to the me<-lll "kin temperature of a resting, naked human body exposed in the opeH and that it indicates the variations of the com- bined bioclimatic factors of radiation, "·ind ancl air temperature.
vVhen studying the hioclinwtic conditions of an area, it i~:>
_preferable to examine the detailed figurel:l of the cooliug temperat"lue rather than ally mean values. On the other hand, the original data collect eel rluring the SurYe~- 1937(38 a mounted to morl' than 24,000 hourly readings, an a1nouut o£ :figures \Yhich is too un\\·ieldy to be dealt with in this paper. The number of fignrel:l \Yas, therefore, rcduce11 in such a m1y that the characteristic featureR of the comli- tions '"hich are of general biologic interest were made appa1·ent by comparatiYely few figures. The four outstanding itemg ot general bi.o logical interest chosen for this are discussed be I 0\Y.
Fi1·stly, there is the aYerage change of the cooliug temperature during the clays of each month ancl the change of conditions during the course of the vear. These results can be studied bv means of the graphs \Yhich are 'given separately for each of the six s"olar RacliatiOJl Statiom. [They are also giYen in the form of a tnhle ('l'ables 13 awl BA) (pnge 419) to make a r;omparison of the resulis obtainetl at ihe Yarious stations easier.
J
These gTaphs were ohtainecl hom tht·original hourly reading:; by calculating the aYerage vah1es per month for enrh hour of the day.
The second item il:l the difference beh1·eeu i.he highe:;t and the lo,Yest average cooling temperature readings. These are of biological interest because they represent the extremes to which the human hody may be exposed. These daily ranges are given in Part A of the tables which contain the detailed results of the cooling tempera- hue measurements for each station. Another significant range is that bebYeen 6 p.m. and G a.m., as this drop represents the conditions during the nights. 'l'hese dab are given tog·etl1e1· \Yith the dady range in Part A of the ahoYe-mentionecl tables.
The th·iul extract of the cooling tcmperaJure readings is basc>tl on the consideration that biologists are particularly interested i11 sudden changeR of the conditions to which o1·gani.e life is exposed. The figures \Yhich ran giYe information on this point are those which represent the frequency of large and rapid Yariations of the cooling temperature. A change of 10° or more during a time interval of one hour was considered to be large, that is to say, if the cooling tempe- rature rhang·ecl by more than 10° during one hour, this hour waR rounted as being one with a large Yariation. The tobl number of hours ,,-ith such large variations \Yere counted for each month ancl are given in Part B of the tables, together "-ith the m1mher ot cb~rR
on whirh these large Yari.ations orcmrecl.
·.
G. ltll·:.\lJ-:lU:iClL\11 JJ.
'l'he juut/;ft detail of ('()OJi11g temperat\ll'f' 111e<lfiUJ'P1JieJ1b; \Yhit;h l'Ull <.;erns the biulog ist is t h.e ot·(' unPJJ l'P of pP rioll s of houn; >Yi th very high or yery lo'" ('ooling tempPratures. During these hours a great
"train IYould be experi en cecl by a human bod;~r i£ expo::;ecl in the open.
Uareful inYestigations .in Europe haYe proYed that for a cooling·
temperature aboye 40° m· helo"· 20° thl~ physiological ;;train to <1 li~Lked expm;ed hun1n11 body "·ould be so great thnt the clnnger of oYerheating or on·n:ooling "·fif.; imminent. Periods o£ lllOl'e thnn ,->
hours "·ith coohug tenqlc>raim·es higher than 40° or lo1Ye1· than 20°
"·ere, therefore, counted for t>arh stntion anr1 the number ;md nYer;Jgf' (luration of snrh periods ;Ht• giYPll in J:>;tl't C of ea('h tnhlP.
In allditiuu to i:Le debiled results given sepantlely for e;u·li
;;tatiou, a comp~nison of the ('ooling tempen1turc cont1iti.ons at the six staiio11s in the Union if> pre,;ented.
'1'1m HEsur.Ts OF TliE CouLl.\(; 'J'EMPElU'ITHE :H E.ISL'ItE.\IE:KTS .IT K\Cll ()I' TilE SIX RT.\T10XS.
1. The Coohnr; 1'emperatt11'e a/. Johannesburg.
'J'he mean monthly cooli1tg telllperature for e;tt;h hour per da.1· is giYen in Gr;tph IX (:;ee also Table 13 ::uHl l:)A, pn.g·e -1-19) \\~hen· the horizontal clivision;; 1·epresent degrees ct>n tigTn (l (~ ;ttt(1 the yerticnl c1iYi.sions the 2-l: hours of i·he cl<IY:
Du1ing the f'onniP of ihe _,·e;\1' a 'll'ctlly iucreas<· of !he l'Oo1ing- ie.mperature took place from .Tttl_v until Kovemlwr i.ndusin•.
Del'ember 1·eadiugs, mJ Uw oHH·r h;lnll, shmYed ;t dist-ind. cle(Tf';JsP l'Olll]Ktrecl >Yith thosP i11 ::'lol·f'nJlwr. Duri.ug both llt<luths thP nigh! ('ooliug· iemperahues 1ren• 11e;1rl)· tlw s:llllf', but tlw tLly IT<Jilin:!;:'l in December· >Yere 7° lo1ver. ln Januan· 3JtCl Ft~hntarY lht> l'ooling·
effect of the rains \l·t·re still noli('P<Jble,· 11·hilst· i.n )Ln~h rather high readings >nre reGordecl. '.I.' he approach o£ winter, Goincident "·ii h another outbreak of r3ins, resulted in Vf'l'V lmY rea<hngs chning·
Ap1·il. During )lay -the 11 ight readir1g·s 11·e1·e .)0 Jo,,·er th~111 lhui11g·
April.
A. Ranucs.- 'l'lw llifl'nPJJ<·(• of the ltri]:i· :lYt>1·age rtuYes 111
"·inter nnd Sllllllllf'l' is ;ti onc·p eYicleJtt when looking ilt the g;raph.
!he daily range being nnl('h grP;tter in 11·inier than i11 summer. The exact figures ~ue giYen in Part A of Table G. It :-;ho\\·s that the ditte1·enl'e hd11·een tlw highest cla5·- ;tnll tlw lmn'st night 1·eaclings >Yas Yery Lng-e all tht> _~·e;w 1011n<l, hut p;nii('nbrly :-;o lhuing the ~vinter
mon!hs, '"hen a l·le;tr sky pennit1Pc1 n strong· irradiation from the e;n·th at Jlight. ])uring tl1r 1·;<iu_1· se~tSOll c·loucl,; fref1uentl,,· '[ll'eYentf'l1 this intensi.Ye los,; of hrnt i'rmn ihe l'nrth nnd t.h<• average 1·augf) nf the l'Ooling tempf'1'::Jitll'<-' lwt,n•t>n llay ancl nig-ht her;<me smnlle1·.
Kl~YrrthPh·~c> th(• ycnrly aYPrng-t> rang-e IY:ts 18°.
'l'h<' averng-e llrov of Ill<' c·oohng !t·mpcrature durinp; the nights (giveu iu the seconll line of l>;Jrt A of Tnhlt> G). >nR also gTl•nt E'~-rept
dming the rainy ;-;ea,.;on.
37 38!)
T_\llLE (i .
.foliWIIU'olilll'ff, Coolin!/ 1'ellljJerature: (A) Rnn!Jes, (H) f!'ri'I[III'III".'J
of
lnr.r;r Foriations and (C) Paiods 1rith Hir;h rnul Lou; l'olues.
r Total lllllll bt·r of honr~
I
I wtth vanatwns grcatr•
I
1~ ~ than 10°.. . . . 18 :U 2!l 21 :n 43 38 :3:~ 03 :31 31
·,xumbctofct,,ysonll-hJ("h I
l <~mer!... . . . . . . l!l :!1 Ul 1:? 2.i 20 17 L.> n :Z:! :!.i --·
I these vat tat wns 0('· I
I
-r
Aw,:;;;o '~''"of hont:;:- - - ,- -- - - ---~----- - - -1 !'c~ day 11·ith mon• tluw I . _
-I· _
I 40 eool. 1"-cJllp.... .. . . 0 0 li li 7 li h·.J " (j·;, (i 0
1 Xumucr of <lay" 011 whkh I
1 I hrs<' high cool. tcm p. I
I were rccorrlcrl. . 0 0 .) I 7 Hi :l (i I l :)
('-\
I .-\,·erage 1nunbcr of hour:-;
I per day with less than
I 20° cool. t<' m p. . . [.) 13 I:? I 0 ((j II !) 0 !I·.) I:!
(I
I Xtllllbcrofd;oy~on which
I t ltc~c loll- tool. (em p.
l ll'l'l"(' !'("(•OJ"(Ic-d . . :!4 :~I ·l() 7
- I :! :l
I
o :!()JJ. lluriulious.- l';uL H of 'L'nhl<' (i ""ii·I'S !'or l'<t("lr month thv Lotal Hunl11er of lwnr,; rhniug 11·hich n V<J 1~nli;,,, of 1·ooling- temper<~
ture of lllOl"e (han 10° \YaS l'P!"Orded. '!'he roudlr Jine lll the tabJ1:
,-oub.i.us the numbe1· of du,y::; on whiuh the::;e large ntr.i.ation::: ouc.urred. For instance, in )Iarch there were Zl day~ IYith 65 jumpl:i. This indicates that on 27 out of the 31 day:> of t lti~ mouth considerable' :mel rapirl Y::niation~ of the ,.ooliug temporal u1 <' took placP, and that quite frelluently the:;- oucuned more than nrtct~ during a day. lrr Johannes1nng the llUlllber of hours flll(l oay,.; 1\-ith large anll n<pill Yari<ttiom; of the cooli1Jg t('ll1]Wla1.nr(' \\"a,; g·rc'at during the wholt' _year uncler invPstig-ation \Yith no cli~iinut maximum of occuneuce in any ;;eawrt. .Another fad, 11·hich <":Ill. not lH) seE'n from the figures, is 11-oJ"th \\·hilE' meutioning, 11amE'ly that during· }[arch, 19!iK, ab1rormal drops of morp tlwn 20° occ:lJJT('d on 4 fl('p:nrl':e occasion:;.
C. H. i.r;h rwcl Loll' Volues.- 'l'he ::werage number of hours per month with readings <lhOH' -1-0° arlll those brlow 20° are given in Part(' of rrable fi. Ln adclition, ilw lllllllhE'r of: cla\6 011 \Thi,.h thE'1i(' outstanclinp: H'ading,; \\-ere J·ecortl('cl, nre indicfltecl. ]<'or insbnre: In Septemlwr ihere \Hl"e :l da,\-s IY.i.tlr reading;:; n1roY<' 40°. During·
each of the,;c cbys tht- high re:uling~ o<·curorPcl on an aYel·flgr for G hours. During· the s:JllW month c·oolirrg tcmpc•r:dun· reflcling,; ht-loll"
20° \1-ero registcn'd OYl'l" aq•r:lg't' lH'riods of 12 hours on P:trlr of 2G ll:t_vs. Outstanding· amollgsl tlr!' fig·me,; in PLtrt C of 'rahlt· (i un·
those for .No1·r1nlwr ancl )Jarch. \\~e S<'C lrere thai: the <·ooli11g
391-392