Arguing in favor of the latter, López-Calva and Ortiz-Juarez (2014) proposed an approach to define the middle class anchored in the idea of economic security. The size of the middle class can be expected to be relatively robust to small variations in this threshold, as it lies in the upper tail of the distribution.
Data, definitions and estimation
While self-employment of the head of household in the informal sector is associated with a 7.6 percent higher risk of poverty, self-employment in the formal sector is associated with a one percent lower risk of becoming poor. Similarly, head of household union membership is, all else equal, associated with a 2.5 percent lower risk of remaining poor and a one percent lower risk of sliding into poverty.
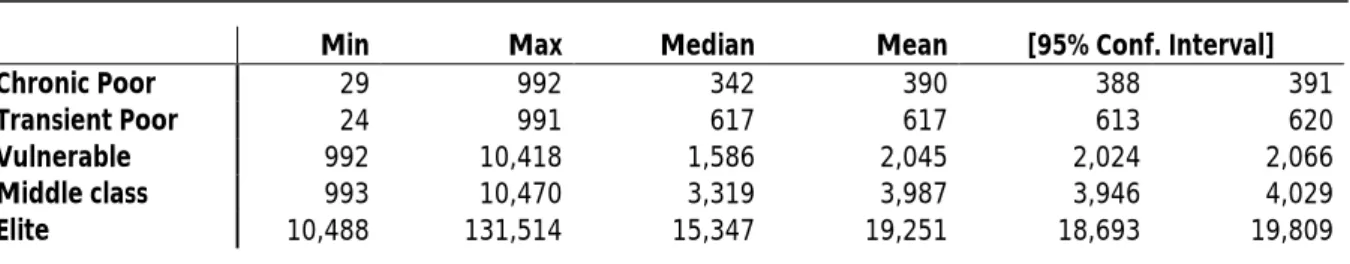
Predicted poverty transition probabilities and class thresholds
In terms of geographic patterns, access to basic services is associated with a four percent lower risk of chronic poverty and a 2.7 percent lower risk of becoming poor. For the initially non-poor, the risk of falling into poverty is about 5.8 percent lower in urban areas than in "deeply rural" or "traditional" areas of the country, which include traditional villages and. While the effects for most explanatory variables point in the same direction for both sets of estimates, the size of the effect on poverty propensities differs significantly, depending on whether the individual was already poor in the initial period or not (a t i if the two sets of coefficients are identical, it can be rejected at all joint significance levels, compare Table 2).
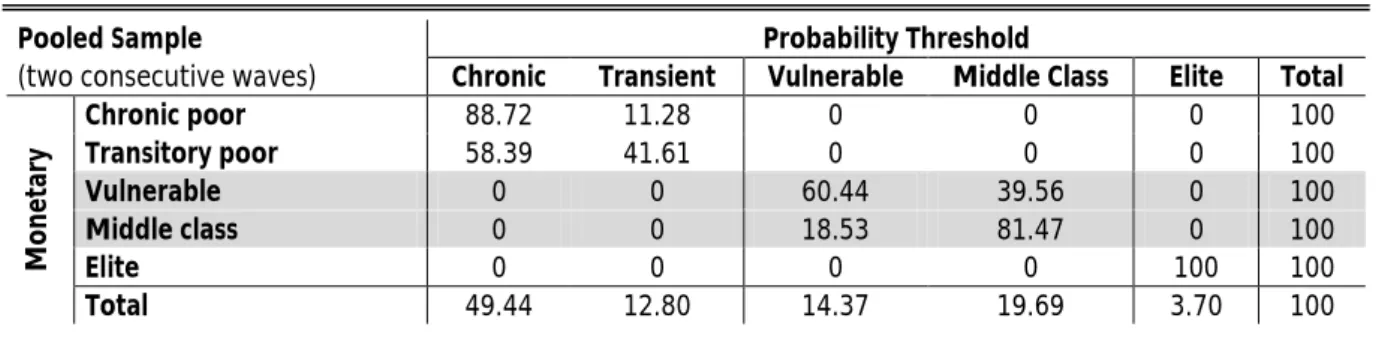
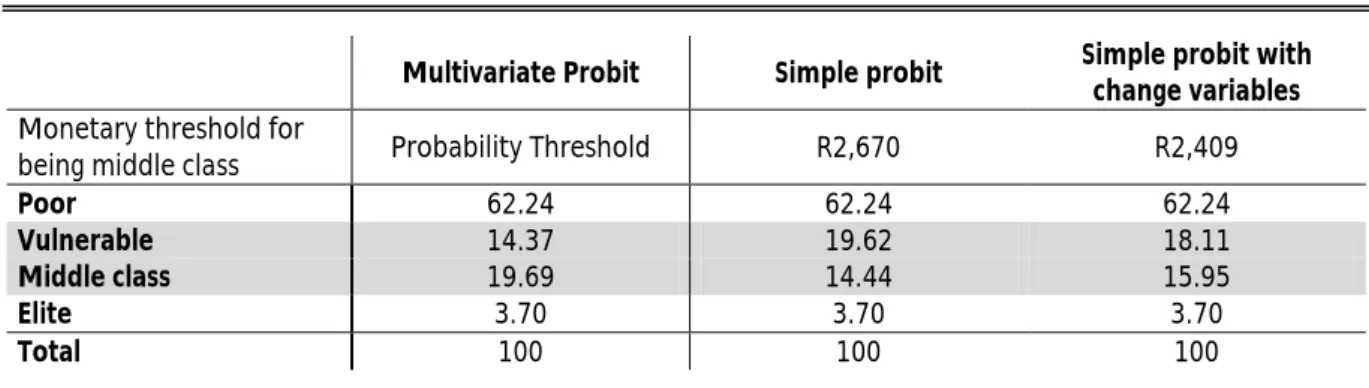
The results reported in Table 3 suggest that one of the channels through which a past poverty experience appears to increase the risk of future poverty is through the depreciation of human capital, as well as potential signaling effects – in the sense that employers use past experiences of (long term). In Table 7, we compare the relative size of the five social classes, when probability thresholds as opposed to monetary thresholds are used to distinguish the class sub-layers. That is, by using a monetary threshold to identify the middle class, we risk missing a non-negligible part of the population, which falls below that threshold by still falling relatively safely from poverty.
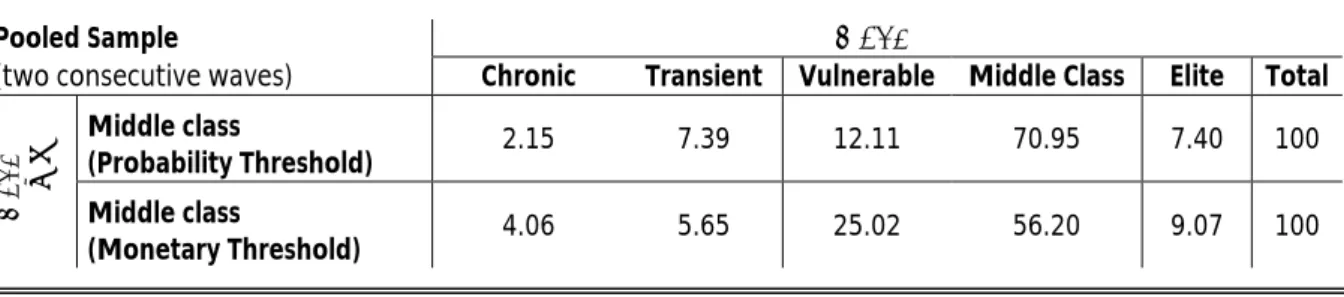
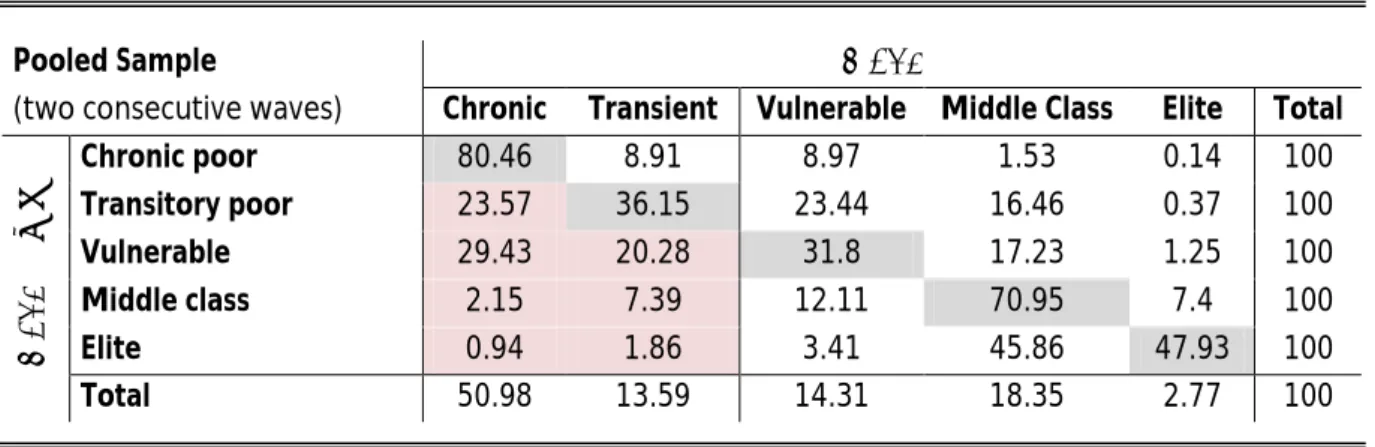
Despite the identified middle class being larger, on average only 9.5 percent (compared to 9.7 percent) fell below the poverty line within a two-year time horizon. We observe that using this approach, on average, about 71 percent of those classified as middle class in one survey wave would still be classified as middle class two years later, while 12.1 had entered the group of disadvantaged. When a monetary threshold was applied, only 56.2 percent of all middle-class individuals would still fall into this categorization two years later, while 25 percent had fallen below the vulnerability threshold.
Sensitivity analysis and comparison to alternative approaches
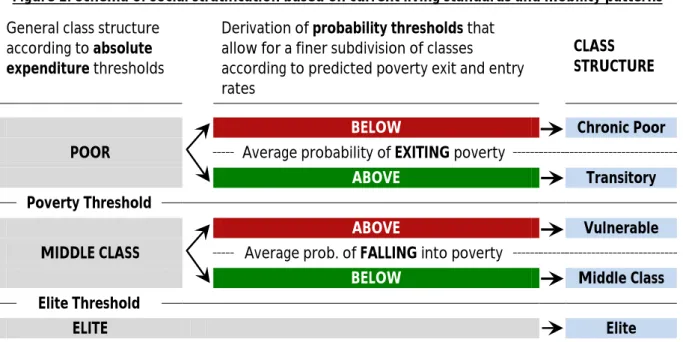
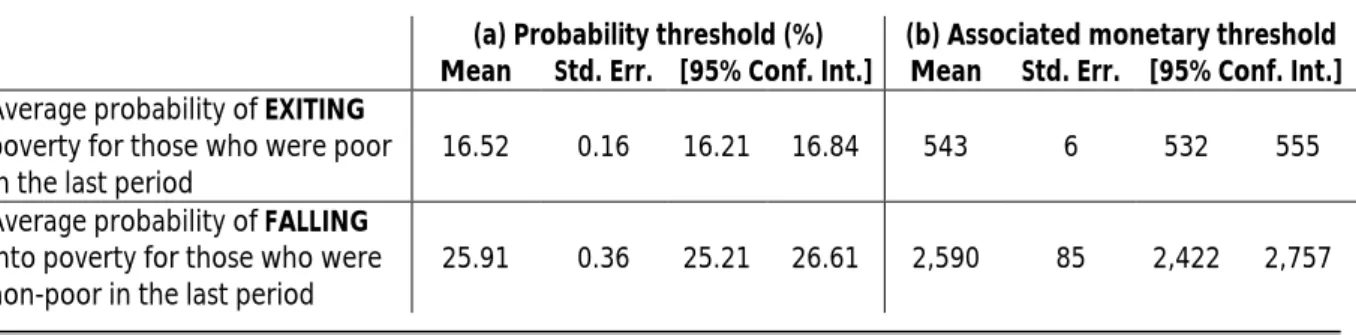
To derive the vulnerability threshold, following López-Calva and Ortiz-Juarez (2014), we calculate the predicted average per capita income level associated with a predicted poverty propensity of 10 percent, which is considered the maximum acceptable poverty risk for people. be classified as middle class (the estimation results are shown in Table A.4 of the appendix). That is, some of those classified as middle class based on their income level face a predicted risk of poverty exceeding the ten percent threshold, and some of those classified as vulnerable face a predicted poverty risk of less than ten percent. per cent. Replicating their approach for the South African context using the same explanatory variables as in the regression framework above, we estimate a middle-class monetary threshold of R2,670, which is surprisingly close to the original thresholds proposed by López-Calva and Ortiz-Juarez (2014).20 However, a slightly lower threshold of R2,409 is obtained when control variables are included.
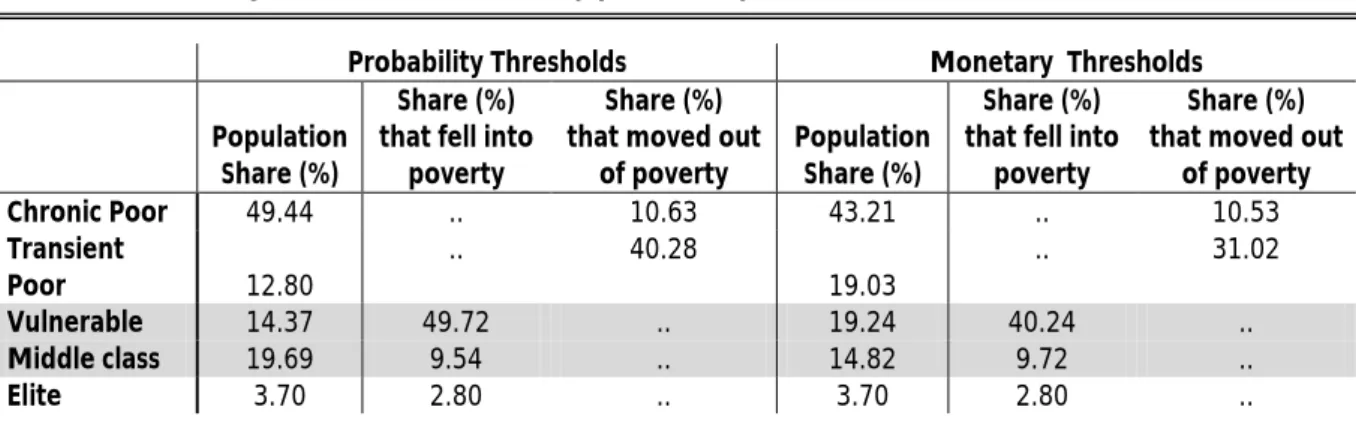
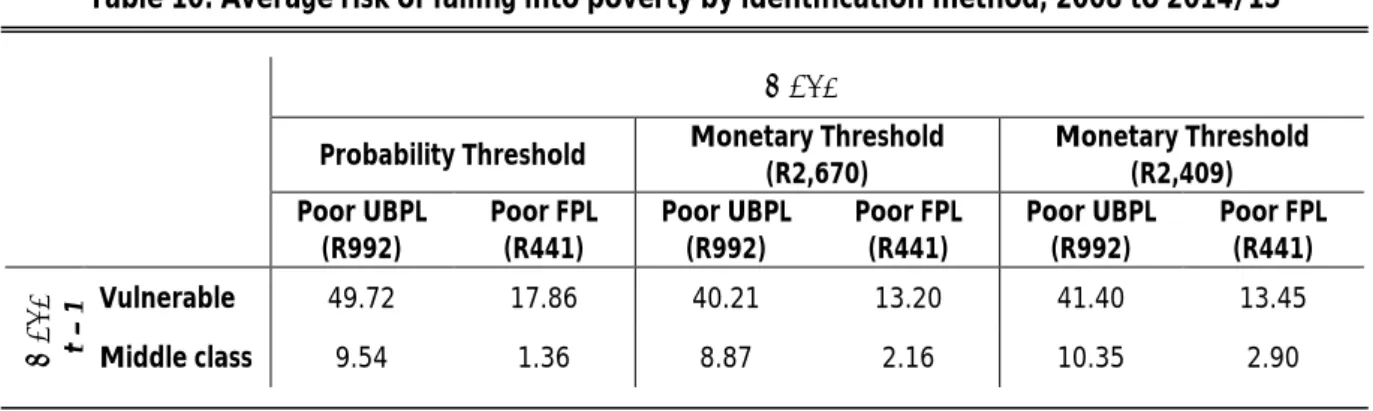
Using these monetary thresholds, the size of the middle class varies between 14.4 and 16 percent, compared to 19.7 percent using the approach presented in this paper. As a useful way of exploring how consequential the classification mismatch between the approaches is, we look in Table 10 at the proportion feeling into poverty (UBPL) and extreme poverty (FPL) out of the respective identified vulnerable group and middle class. We observe that both our approach and that of López-Calva and Ortiz-Juarez (2014) perform similarly well in identifying a middle class that is fairly safe from falling into poverty.
For both approaches, the identified middle class faces an average risk of about ten percent of falling into poverty over time. It is worth noting that this similarity holds despite the larger size of the middle class we identify. Moreover, this middle class faces only half the risk of falling into extreme poverty (below the FPL) compared to the middle class that would have been identified using conventional methods.
Class formations, social inequality and mobility in South Africa
Class characteristics and inequality patterns
In contrast, only 14 percent of all children under 15 can be classified as stable middle class or elite. In the middle class, 6.5 per cent originate. of the total household income from subsidies (see table 11). Similarly, 26.5 of those in the vulnerable group live in traditional areas, compared to 4.6 percent of those in the middle class.
As shown in Table 11, only one in five of the chronically poor had access to electricity, running water, a flush toilet and formal housing, compared to three in five among the transient poor and three in four among the poor. middle class. In addition, seven in ten chronically poor individuals live in female-headed households, compared to five to six in ten among the transitory poor and vulnerable, and three in ten among the middle class and elite. These two groups also represent the vast majority of the transiently poor and vulnerable.
This means that while Africans make up around 80 per cent of the total population, in 2014/15 they made up just over 50 per cent of the middle class. On the other hand, while whites make up barely 10 percent of South Africa's population, almost one in three members of the middle class and two out of three members of the elite are white. The head of a household in the middle class usually has a high school degree, while those in the elite usually have some tertiary education.
A dynamic perspective on the determinants of social class and inter-class transitions The net changes in South Africa’s class structure reported above may mask a substantial degree of
Of the less than 10 percent who fell below the poverty line, only a small portion fell into the trap of chronic poverty. Of the ten members of the elite, an average of five were able to retain their positions, while the rest belonged to the middle class. Our reference person, case (1), can be seen as a 'typical' member of the middle class in South Africa.
In the following, we first examine how the predicted probabilities of entering and exiting poverty and the level of expenditure change, while incrementally adjusting the characteristics of the reference person's household (case (1)) to obtain a 'typical ' to represent a member of the vulnerable class (case (case (1)). 7)).23 Compared to the middle class, household heads in the vulnerable group are often somewhat younger and female, leading to a moderate decline in the predicted expenditure level (from R2,959 to R2,495), but almost. Reducing the level of education attained by the head to nine years of schooling (secondary education not completed) leads to a further contraction in the forecast level of expenditure to R1,812 and an increase in the. A typical member of the vulnerable class living in a household where the head has a fixed-term employment contract and no union coverage faces an average poverty risk of 48.9 percent – confirming that the vulnerable group is often just one income shock away of falling into poverty.
In line with the previous simulations, we also examine the effects of changing the characteristics of the middle-class referent to represent a 'typical' member of the elite in South Africa. Like middle-class households, for an elite household, a job loss for the head of the household tends to line up with one. 23 As discussed in section 4.1, when we look at the average characteristics of the transient poor and the vulnerable, we observe striking similarities between the two groups.
The distribution of risks and coping mechanism across class categories
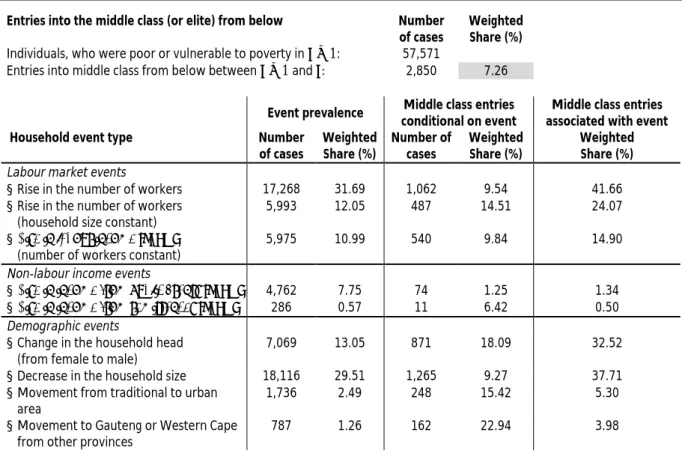
In addition, we look at the insurance mechanisms and financial instruments that can be associated with being in the middle class. We observe that more than one in three middle-class entries in our data set can be associated with an increase in the number of workers present in the household. The associated probability of entering the middle class is much higher in cases where the increase in the number of workers occurs without an accompanying change in family size.
In addition, increases in labor income (by at least 10 percent) holding the number of workers in the household constant can be associated with an average probability of entering the middle class of 9.8 percent. The latter in particular tend to be associated with increased chances of entering the middle class. We observe that 30.2 percent of all middle-class populations are associated with a decrease in the number of workers in the household.
By contrast, cuts in labor earnings (by at least 10 percent), while keeping the number of workers unchanged, do not appear to be a driver of exit from the middle class. Having access to a bank loan significantly increases the chances of staying in the middle class. Also, informal loans from family members or friends seem to be insufficient to keep someone in the middle class.
5 Conclusion
The Middle Class and Inequality in South Africa. South African Labor and Development Research Unit, unpublished paper for Pro-Poor Policy Development Support Programme). The problem of random parameters and the problem of initial conditions in the estimation of a stochastic process of discrete-time discrete data. South Africa's Evolving Political Order in Comparative Perspective (South African Labor and Development Research Unit Working Paper No. 138).
Theorizing middle-class consumption from the global South: A study of everyday ethics in the Western Cape of South Africa. The rise of the African consumer: A report from McKinsey's Africa Consumer Insights Center, McKinsey Global Institute. Not the Middle Class, but the Middle Class: An Assessment for South Africa, Paper prepared for presentation at the International Workshop on Middle Class Inequality and Development in Africa, Cape Town (04–06 May).
Methodological report on the redetermination of national poverty thresholds and the development of pilot provincial poverty thresholds.
Appendix