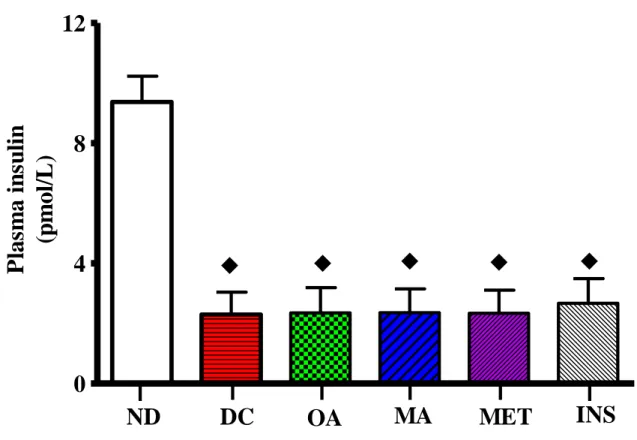
Furthermore, the effects of OA and MA on intestinal oxidative stress were evaluated through measurements of malondialdehyde (MDA), superoxide dismutase (SOD) and glutathione peroxidase (GPx). OA and MA treatment had no effects on plasma insulin concentration in STZ-induced diabetic rats.
Body weight changes, food and water intake 75
Limitations and directions for future studies 110
Image B represents a disrupted longitudinal layer (, an intact mucosa, goblet cells in the circular layer and villi with reduced length in untreated STZ diabetic control animals. Images C, D, E and F represent an intact longitudinal layer, an intact mucosal membrane, goblet cells in the circular layer and normal length villi in OA-, MA-, metformin-, and insulin-treated STZ diabetic animals, respectively.
List of tables
List of appendices
Page no
Conference proceedings
Background
Previous studies conducted in our laboratory have shown that OA and MA reduce blood glucose concentrations in streptozotocin (STZ)-induced diabetic rats. The current study therefore aimed to investigate whether the antihyperglycemic properties of OA and MA could arise in part through effects on intestinal carbohydrate hydrolysis, intestinal glucose absorption and on gastrointestinal expression of ghrelin in STZ-induced diabetic patients. rats.
- Postprandial state
- Ghrelin
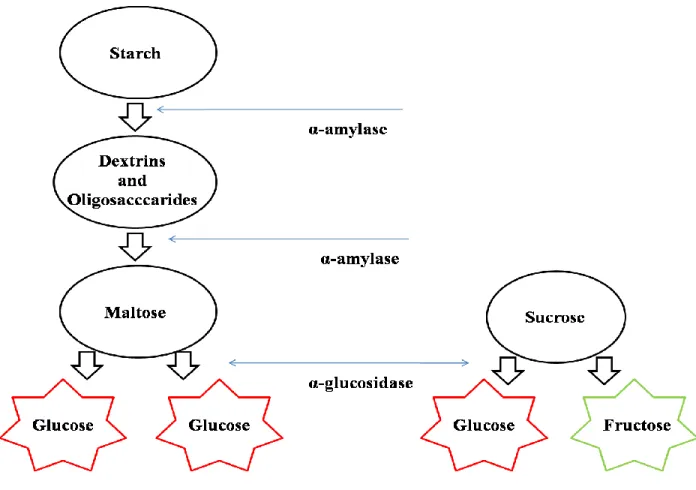
- Amylases
Low plasma ghrelin levels are associated with high fasting insulin levels and insulin resistance in humans (Poykko et al., 2003). In animals, these exist in two major isoforms, namely salivary and pancreatic amylase (Smith et al., 2005).
Glucose transport
- Aetiology of diabetic complications .1 Polyol pathway
- Advanced glycation end products (AGEs)
- Protein kinase C (PKC)
- The hexosamine pathway
The extract of the plant Panaxquin quefolium (Linnaeus) [Araliaceae] has been shown to inhibit the formation of AGEs or RAGE (Beckman et al., 2002; . Kudzuma, 2002). There are also other plant extracts that have been shown to reduce glucose transport across the small intestine (Mahomooodally et al., 2004).
Macrovascular complications of diabetes
- Atherosclerosis
- Microvascular complications of diabetes .1 Diabetic retinopathy
- Diabetic nephropathy
- Diabetic neuropathy
The presence of microvascular disease is also a predictor of coronary heart events (Avogaro et al., 2000). This study was designed to investigate the antioxidant effects of OA and MA in the small intestine.
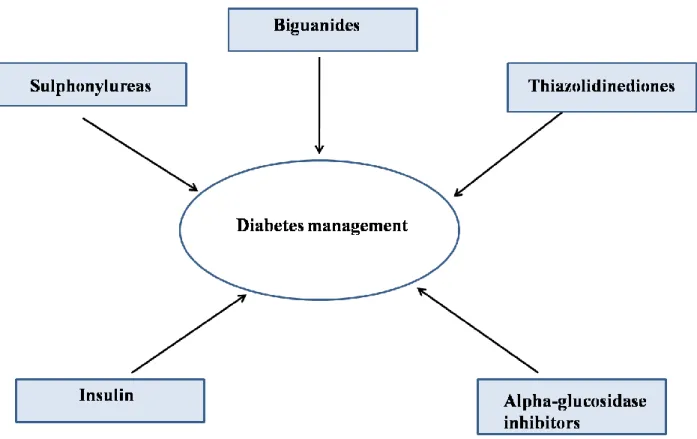
Conventional management of diabetes mellitus
- Insulin
- Sulphonylureas
- Biguanides
- Intestinal enzyme inhibitors
- Intestinal glucose transport inhibitors
Metformin has also been reported to increase muscle hexokinase (HK) activity in STZ-induced diabetic rats ( Dyer et al., 2002 ). Furthermore, MA has been reported to possess hypoglycemic properties in adrenaline-induced diabetic mice (Al-Qattan et al., 2008).
Experimental techniques used to study intestinal glucose handling
In addition, this triterpene has previously been shown to exert hypoglycemic effects through antagonism of hepatic glucose production (Liu, 2008; Tarling et al., 2008). MA has previously been reported to represent a new class of glycogen phosphorylase (GP) inhibitors (Aiston et al., 2003; Juhász et al., 2007). The advantage of this system is that we can monitor glucose transport through the small intestine by quantifying glucose (Mahomoodally et al., 2004).
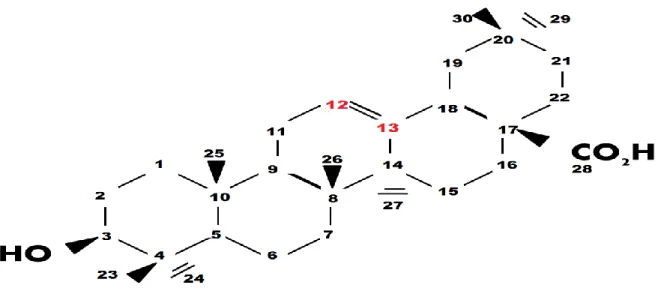
Isolation of OA and MA
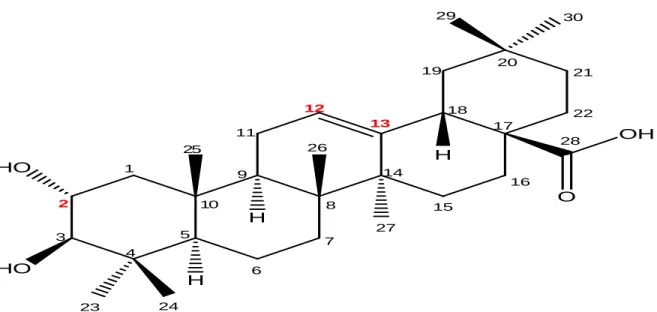
Crude EAS was subjected to further purification as previous studies indicated that it contains mixtures of OA/UA and methyl maslinate/methyl corosolate (Somova et al., 2003; Musabayane et al., 2005). The EAS-containing mixtures of oleanolic/ursolic acid and methyl maslinate/methyl corosolate were purified by silica gel 60 column chromatography with hexane:ethyl acetate solvent systems, 7:3 for OA and 6:4 for MA. This yielded OA and MA, respectively, which were further purified by recrystallization from chloroform-methanol (1:1 v/v).
Ethical consideration
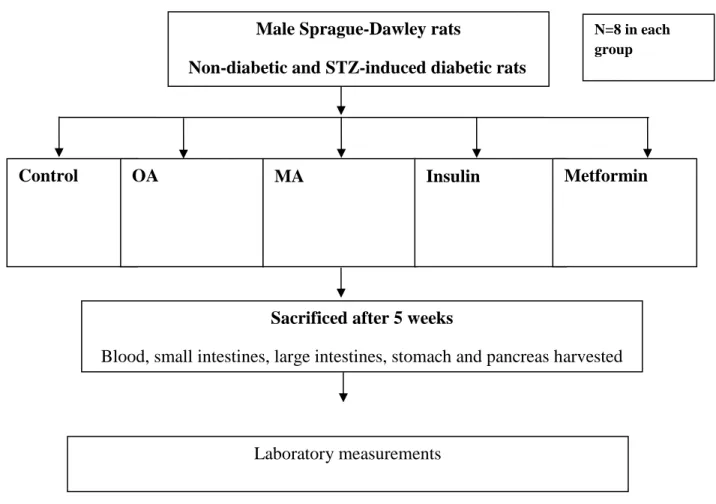
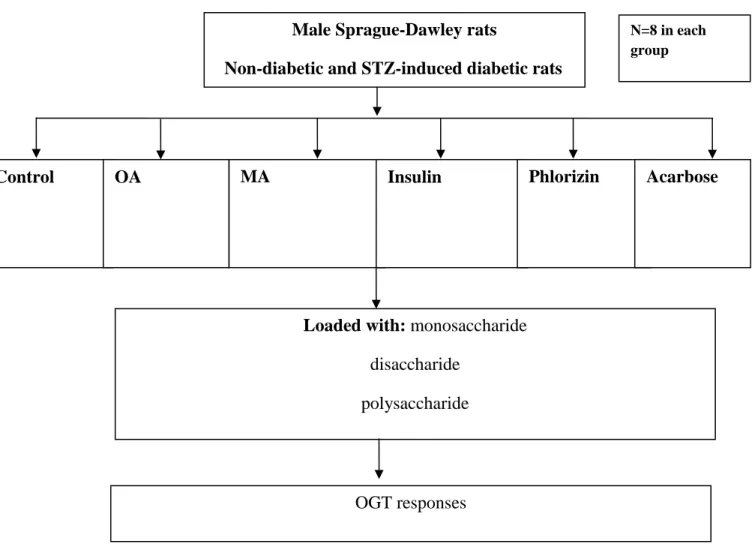
Male Sprague-Dawley rats weighing 250-300 g bred and housed in the Biomedical Research Unit (BRU) of the University of KwaZulu-Natal were used in this study. Procedures involving animals and their care were carried out in accordance with institutional guidelines of the University of KwaZulu-Natal. Experimental type 1 diabetes mellitus was induced in male Sprague-Dawley rats with the administration of a single intraperitoneal injection of 60 mg/kg streptozotocin (STZ) in freshly prepared 0.1 M citrate buffer (pH 6.3).
Experimental design
- Inhibitory enzyme assay studies
- α-amylase
- α-glucosidase
- Sucrase
This was in an attempt to investigate the effects of the triterpenes on the intestinal carbohydrate hydrolyzing enzymes and the resulting postprandial blood glucose concentrations. These studies were performed to investigate the effects of the triterpenes on carbohydrate hydrolyzing enzymes and intestinal glucose transport in vitro. The assessment of the inhibitory effects of OA and MA against α-glucosidase in vitro used a similar method described above for α-amylase, except that the 0.1 M potassium phosphate buffer.
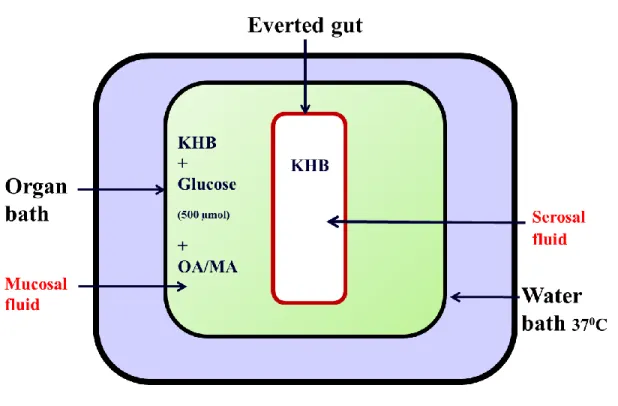
Glucose transport in the small intestine
A standard curve was obtained after measuring the absorbance of standards of glucose which were prepared in the range of 5.5-22.2 mmol/L. Using absorbances obtained from the spectrophotometer, the glucose concentration was then extrapolated from this standard curve and the results obtained were standardized by converting them to µmol. This technique measures the influence of drugs on intestinal glucose uptake by measuring glucose concentrations in the mucosa and serosal fluid before and after the 30-minute incubation period.
Oral glucose tolerance (OGT) responses
These studies were conducted to investigate the effects of the triterpenes on intestinal carbohydrate handling in vivo in non-diabetic and STZ-diabetic animals. In the animals in which the effects of OA/MA were studied, rats were administered OA/MA (80 mg/kg, p.o.) twice daily at 09:00 and 15:00 using an oral gavage needle (18-gauge, 38 mm) long curved, with a 21/4 mm ball tip (Able Scientific, Canning Vale, Australia). At the end of the 5-week experimental period, the animals were killed by exposure to halothane (100 mg/kg, for 3 min) (Isofor, Safeline Pharmaceuticals (Pty) Ltd, Roodeport, South Africa) via a gas anesthesia chamber (Biomedical Resource Unit, UKZN, Durban, South Africa).
Tissue sample harvesting
Rats treated with DMSO/saline (3 mL/kg, p.o.) served as untreated controls while those treated with standard anti-diabetic drugs metformin (500 mg/kg, p.o.) and insulin (175 µg/kg sc) is, if treated served as positive controls (see Figure 4). Body weight changes as well as food and water intake were assessed every third day at 09h00 for the duration of the experimental period. Other midsections of the small intestine were placed in formalin and stored at room temperature (220C) for histological analysis.
Laboratory analyses
- Intestinal glycogen concentration
- Insulin
- Ghrelin
50 µl of the plasma samples were then added to the remaining wells, followed by 50 µl of enzyme conjugate to all wells containing standards and plasma samples. The respective insulin concentrations of the unknown samples were then extrapolated from the standard curve. This is due to the competitive binding of the biotinylated ghrelin and the ghrelin in standard solutions or in the samples to the ghrelin antibody.
Oxidative stress
The antioxidant effects of OA and MA were determined in small intestine samples collected after a 5-week study by evaluating superoxide dismutase (SOD) activity. SOD activity was measured with the Biovision SOD Assay Kit according to the manufacturer's instructions (BioVision Research Products, Mountain View, CA). GPx activity was measured in rat small intestinal tissues using the Biovision GPx Assay Kit according to the manufacturer's instructions (BioVision Research Products, Mountain View, CA).
Analysis of data
During this process, the water in the tissue is replaced with alcohols of varying strength to facilitate dehydration. The tissue was then placed in xylene, which clears the alcohol and leaves the tissue translucent. The tissue sections were mounted on clean glass slides and placed on a Ransom hotplate to allow drying.
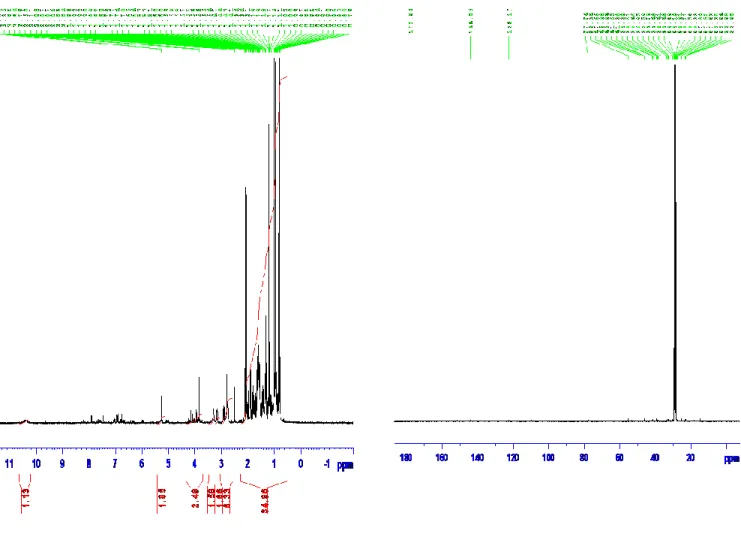
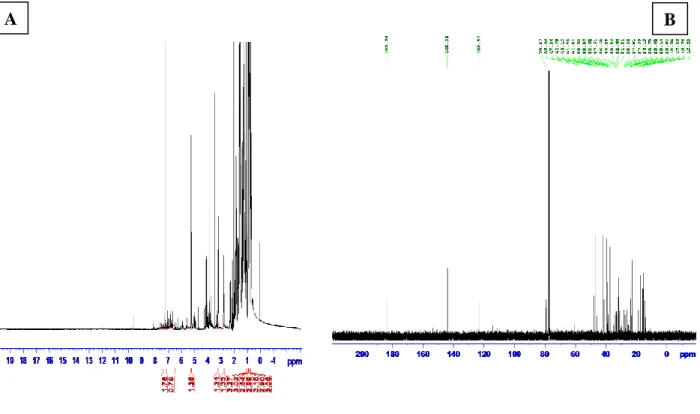
Structure elucidation
Carbohydrate hydrolyzing enzyme activity
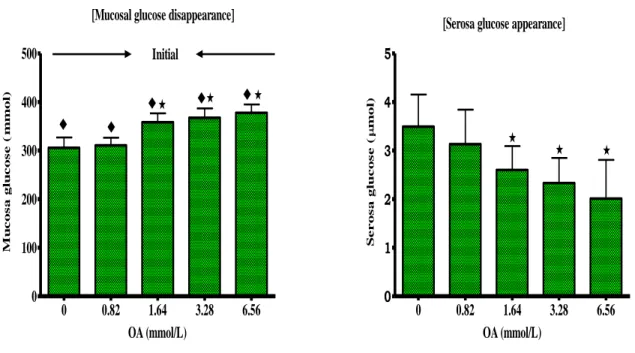
Effects of graded concentrations of OA mmol/l) on mucosal glucose disappearance and serosa glucose appearance in rat inverted pouches. Effects of graded concentrations of MA mmol/l) on mucosal glucose disappearance and serosa glucose appearance in rat inverted intestinal pouches. Effects of graded concentrations of phlorizin on mucosal glucose disappearance and serosa glucose appearance in rat inverted pouches.
Acute effects .1 OGT responses
- Physicochemical changes
- Body weight changes, food and water intake
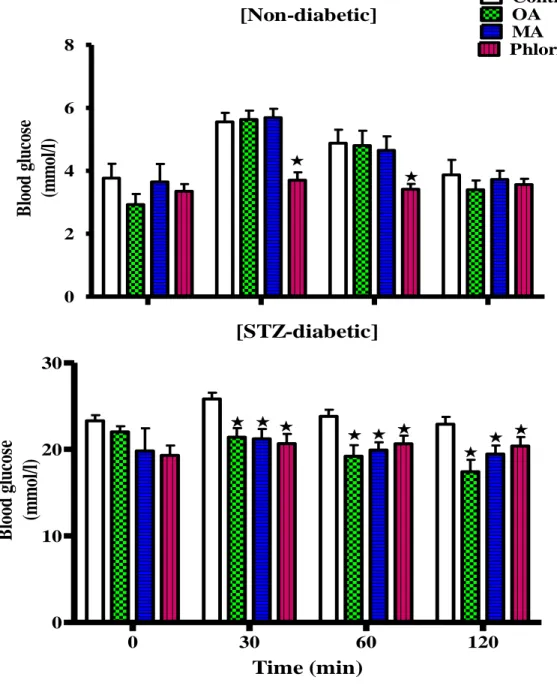
Comparison of OGT responses to OA and MA in non-diabetic and STZ-diabetic rats with control non-diabetic, untreated STZ diabetic and those treated with the standard drug phlorizin after a glucose load. Comparison of OGT responses to OA and MA in non-diabetic and STZ-diabetic rats with control non-diabetic, untreated STZ diabetic and those treated with the standard drug phlorizin after a sucrose load. STZ-diabetic rats treated with insulin (175 µg/kg, sc) or metformin (500 mg/kg) showed a similar response pattern of results (see Figure 20).
Control OA
MA Met
Time (weeks)Blood glucose(mmol/l)
Small intestinal glycogen concentrations of STZ-induced diabetic rats were significantly (p<0.05) reduced compared to those of the non-diabetic rats after the 5-week experimental period. On the other hand, treatment of STZ-induced diabetic rats with OA and MA significantly increased intestinal glycogen concentrations (p<0.05). Similarly, rats treated with the standard antidiabetic drugs, metformin and insulin, showed similarly significant (p<0.05) increases in intestinal glycogen concentrations after the 5 week period (see Figure 21).
Intestinal glycogen (mmol/g tissue)
The plasma insulin concentrations of STZ-induced diabetic rats, which were significantly (p<0.05) low compared to those of the non-diabetic rats, were not altered by any of the treatments (see Figure 22). On the other hand, plasma ghrelin concentrations of STZ-induced diabetic rats were significantly (p<0.05) increased compared with that of the non-diabetic rats after the 5-week experimental period. However, treatment of STZ-induced diabetic rats with OA and MA significantly (p<0.05) reduced plasma ghrelin concentrations.
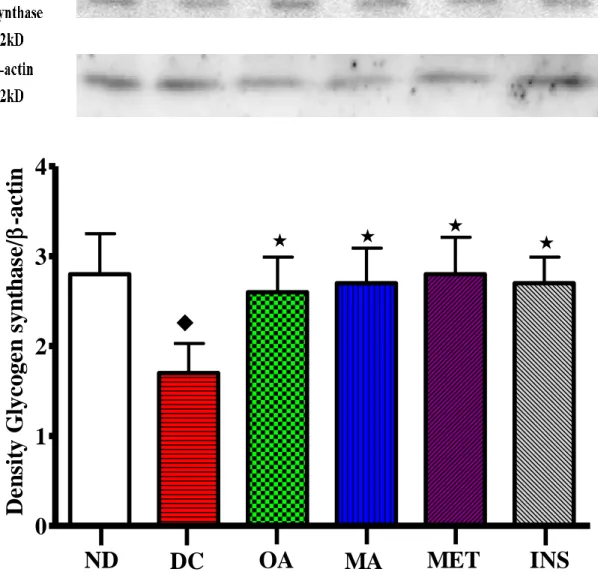
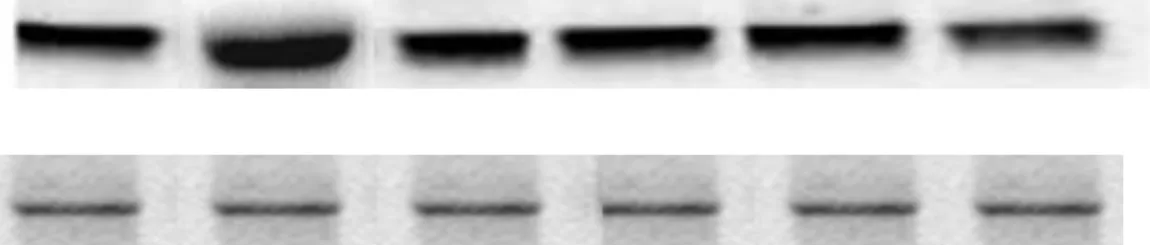
Glycogen synthase
STZ diabetic rats treated with standard drugs metformin and insulin showed a similar response pattern of results (see Figure 25 and Figure 26). Comparison of the effects of OA and MA administered in STZ-diabetic rats twice every three days for 5 weeks on small intestinal α-glucosidase expression with untreated STZ-diabetic rats and those treated with the standard drugs metformin and insulin. STZ diabetic rats treated with the standard drugs metformin and insulin showed a similar response pattern of results (see Figure 27 and Figure 28).
Ghrelin 45kD
Comparison of the effects of OA and MA administered to STZ-diabetic rats twice every third day for 5 weeks on small intestinal ghrelin expression in untreated STZ-diabetic rats and those treated with standard drugs metformin and insulin. Comparison of the effects of OA and MA administered to STZ-diabetic rats twice every third day for 5 weeks on colonic ghrelin expression in untreated STZ-diabetic rats and those treated with standard drugs metformin and insulin. Comparison of the effects of OA and MA administered to STZ-diabetic rats twice every third day for 5 weeks on MDA concentration with untreated STZ-diabetic rats and those treated with the standard drugs metformin and insulin.
SOD activity nmol/min/g protein
GPx activity nmol/min g protein
Limitations and directions for future studies
Effects of oleanolic acid derived from Syzygium aromaticum on glycogenic enzymes in streptozotocin-induced diabetic rats. Effects of Syzygium aromaticum-derived maslinic acid on blood glucose of streptozotocin-induced diabetic rats. Effects of Syzygium aromaticum-derived oleanolic acid on glucose transport across intestinal blebs in vitro.
The hypoglycemic effects of the triterpene, oleanolic acid (OA), derived from Syzygium aromaticum in streptozotocin (STZ)-induced diabetic rats are partially mediated by increased hepatic glycogen synthesis [1]. In separate preparations, graded concentrations of OA (mM) or the standard drug, phlorizin M) were incubated for 30 min in mucosal bath fluid containing glucose (10 mM) to investigate effects on glucose transport across the gut wall. The external incubation medium will be constantly blown with a gas mixture of 95% oxygen) and 5% carbon dioxide during the entire incubation period.