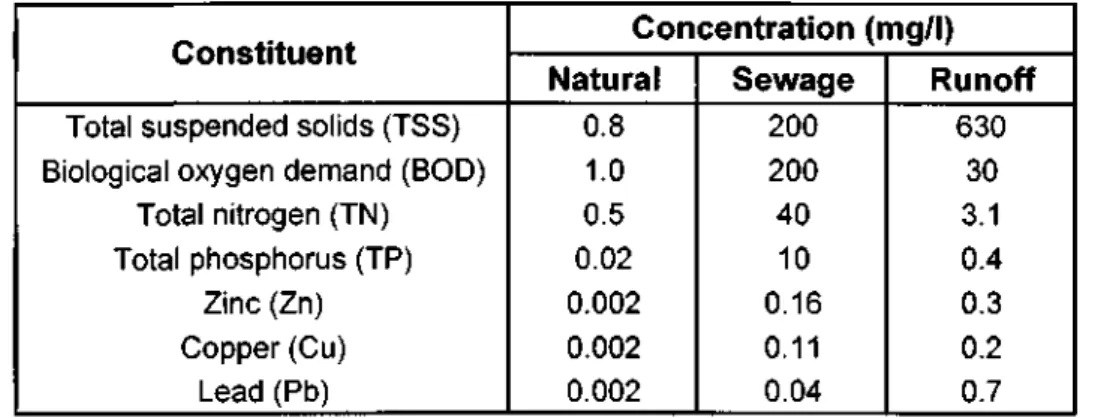
Stormwater runoff is a leading cause of water quality degradation in receiving watersheds. Twenty stormwater runoff event mean concentration (EMC) and atmospheric deposition samples were collected over a period of eighteen months.
LIST OF TABLES
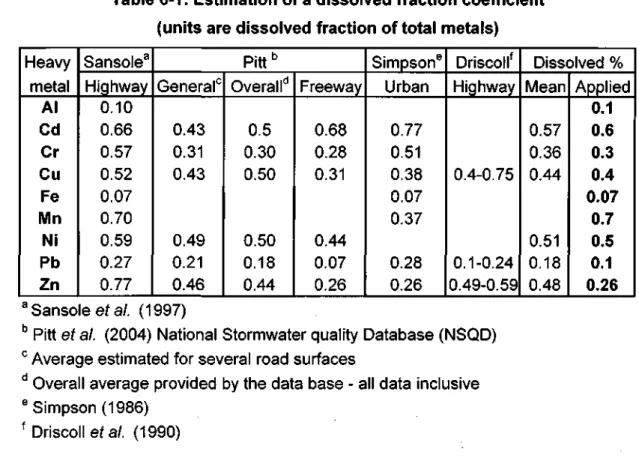
-1: Estimation of the dissolved fraction coefficient. units dissolved % total metals) 91 Table 6-2: Mean event concentrations for individual SWR events at Booth East.
LIST OF PLATES
INTRODUCTION
- Introduction
- Objectives
- Motivation for the Investigation
- Outline of the Dissertation
The focus of this investigation is to characterize the quality of stormwater runoff from various road surfaces in and around the city of Durban. Although road surfaces are not a significant part of most catchments, their effects require management when considering the water quality of the stormwater runoff.
LITERATURE REVIEW
Introduction to Stormwater Runoff
- Stormwater runoff from road surfaces
One form of NPS pollution that has been identified as the primary source of pollutants responsible for the degradation of receiving water bodies is runoff from road surfaces. Rainwater runoff from road surfaces in urban areas has been shown to contain significant amounts of various pollutants (Hoffman et al.
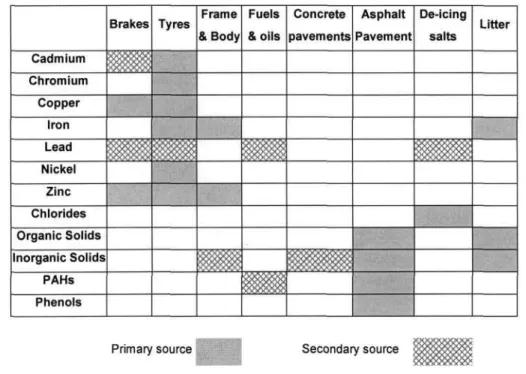
Sources of Contaminants
- Vehicular motion
- Atmospheric deposition
- Erodeable materials
- Principle pollutant types
Atmospheric deposition is categorized into two types by the method by which it is transported to the road surface. These air pollutants are carried by the wind and either settle on the road surface or remain suspended until washed away by rainfall.
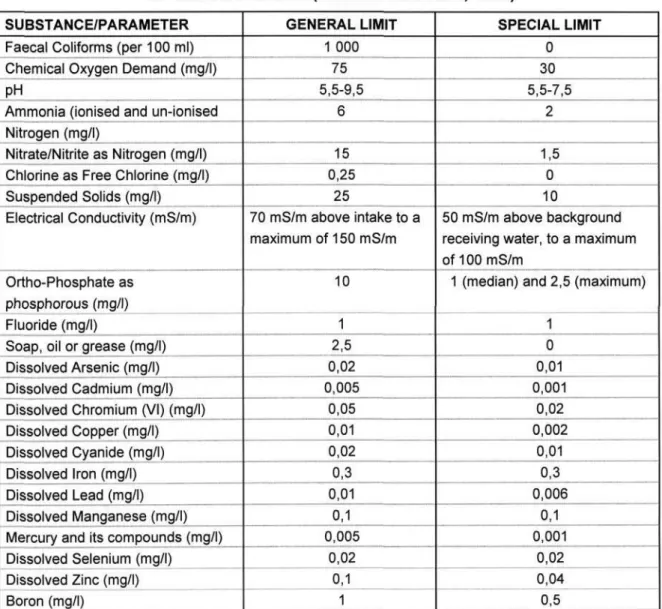
Water Quality
- Water quality guidelines
- Target water quality range
- Water quality indicators
- Analysis method for heavy metals
The following is a brief description of selected water quality indicators and their associated standards (presented in Table 2-4, unless otherwise noted). For water quality criteria, USEPA and NWA (1998) specify the measurement of the dissolved fraction for most metals.
Monitoring Stormwater Runoff
- Stormwater runoff events
- Sampling stormwater runoff
- Discrete sampling
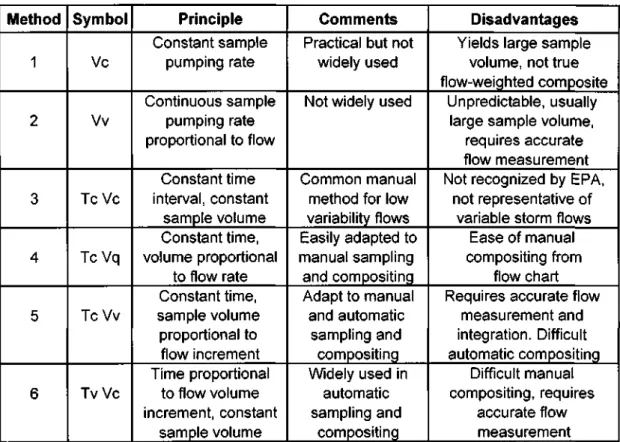
- Composite sampling
- Summary
- Event mean concentration
- Temporal variation of SWR
A composite sample is a single sample consisting of individual samples representing the average constituent characteristics of the entire stormwater runoff. Methods 4 to 5 are considered current-weighted samples that better approximate the average characteristics of the SWR.
Managing Stormwater Runoff
- Pollutant loading of stormwater runoff
Contaminant reduction is attributed primarily to the sorption properties and infiltration of runoff, which promote particle settling (Wu et al., 1998). Driscoll et al. also reported that mean event concentrations were log-normally distributed.
Relevant Research done in South Africa
- Urbanisation rate in SA
- Pollution assessments of surface waters
- Urban catchment runoff pollution
Since many of these developments are located near highways, the flow of stormwater runoff from these road surfaces into the nearest water system is therefore of particular concern. Little or no mention of stormwater runoff is made in these reports, indicating that insufficient data and research is available in South Africa.
Literature Review Conclusion
Simpson (1986) investigated stormwater runoff from a mixed residential, commercial and industrial catchment in KwaZulu-Natal, South Africa. Stormwater runoff monitoring programs are generally study and site specific and require careful planning to satisfy the objectives of an investigation.
DEVELOPMENT OF A SAMPLER
A Review of Sampling Methods
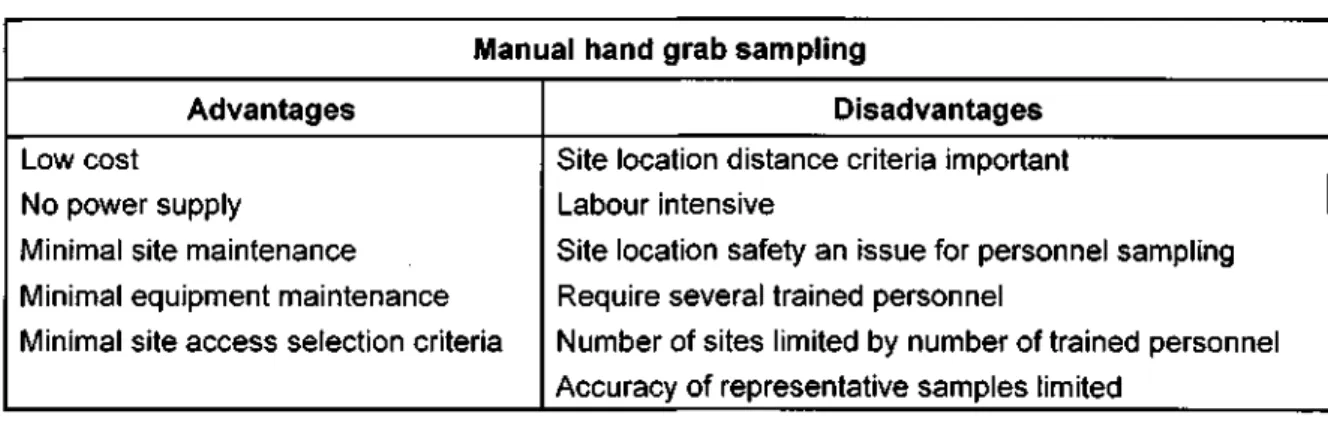
- Manual hand grab sampling
Trained personnel responsible for collecting catch samples must be ready to respond to rainfall events twenty-four hours a day and are often required to take samples for long durations. Even if sampling personnel begin collection from the onset of runoff, a single composite sample produced from several discrete grab samples may not truly represent the concentration characteristics of a storm.
An example of a manual grab sample obtained with an extension pole
- Automatic sampling
Additional capital resources for sampler installation are often required because security measures require changes to be made to selected site locations to prevent theft. The location of the site may also require adjustments to be made to the sampler or site for installation purposes in order for the sampler to function successfully.
ISCO samplers are one of the most common automatic samplers used to collect water samples (Dowling, 1995)
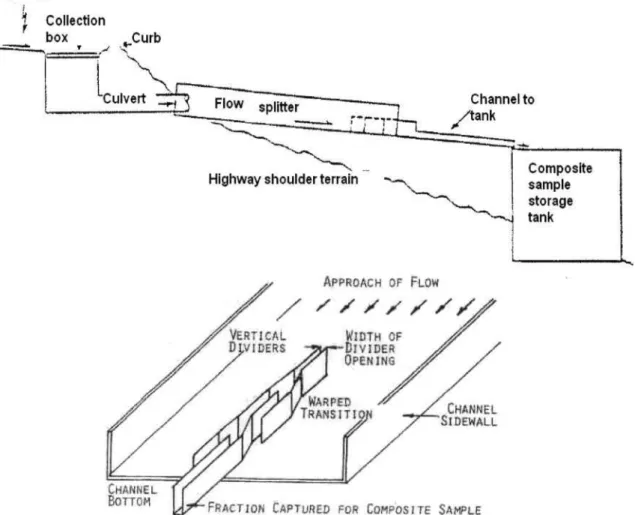
- Flow splitter composite sampler
- Culvert composite sampler
- Summary of sampling methods
- Initial Attempts at Sampling Stormwater Runoff for this Investigation
- Manual hand grab sampling
- ISCO Automatic samplers
- Culvert composite sampler
The third option investigated was that of the diver composite sampler developed by Dowling and Mar (1996). A replica of the culvert composite sampler was constructed and installed in the concrete stormwater pipe (see Plate 3-2).
Culvert composite sampler installed in a 750mm diameter concrete stormwater pipe
- Modifications to the Culvert composite sampler
These objects would wrap around the PVC tubing, blocking the opening and causing injury to the hypodermic needle. The composite culvert sampler developed by Dowling and Mar (1996) would only work in an environment relatively free of debris in the runoff.
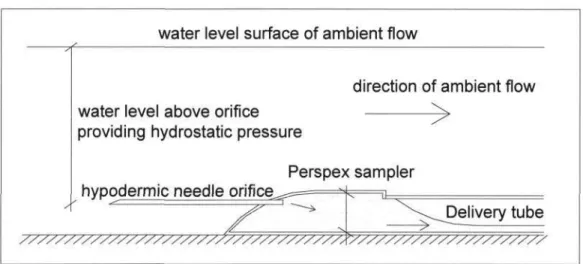
Modified culvert composite sampler with a Perspex housing and hypodermic needle
- New Development: Design of a Stormwater Sampler
- Outline of design criteria
- Modification of prototypes
An example of such criteria is that the sampler may be left unattended in remote locations for several days. The underlying problem associated with the modified Perspex housing sampler was that of the injection needle.
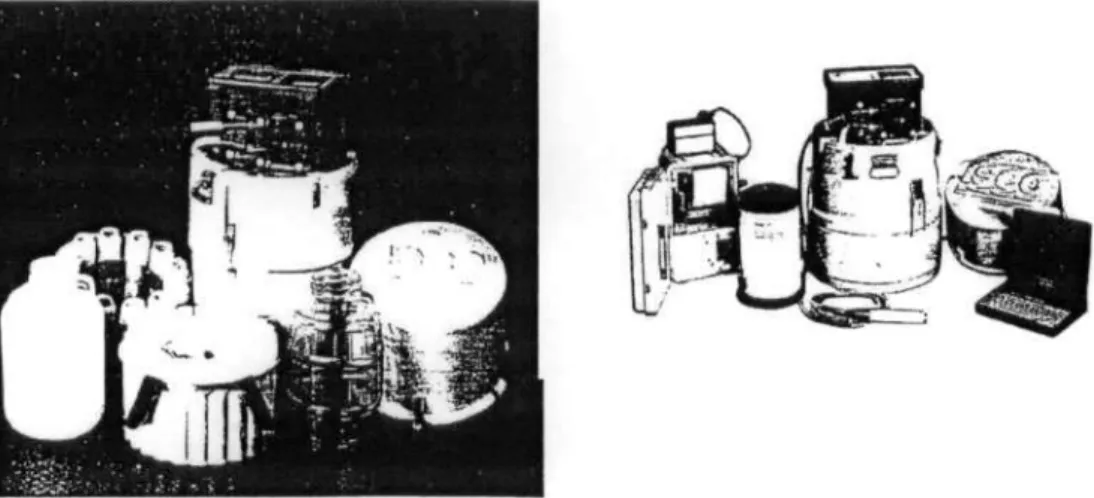
Prototype (Pro.1) made from a polyethylene bottle
- Selection of suitable material and fabrication method
- Selection of the orifice diameter
The use of perspex improved the accuracy of the orifice alignment and the overall control of the sampler shape. One for the top bowl of the sampler and one for the back of the sampler that connects to the supply tube.
Prototype (Pro.4) made from casting resin in silicon moulds
- Collection Properties of the Sampler
- Sampling rate related to water level and velocity
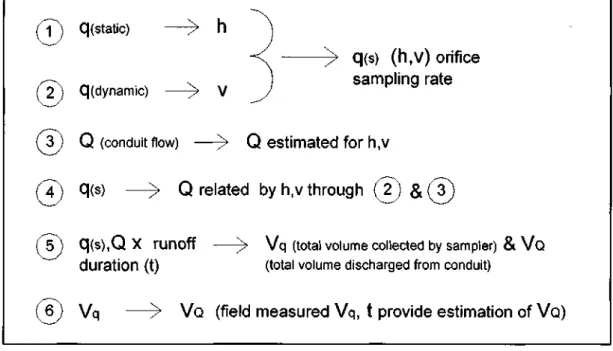
- Stormwater Conduit Flow Estimation
- Estimation of the total volume discharged
- Sensitivity analysis and calibration of the total discharge estimation
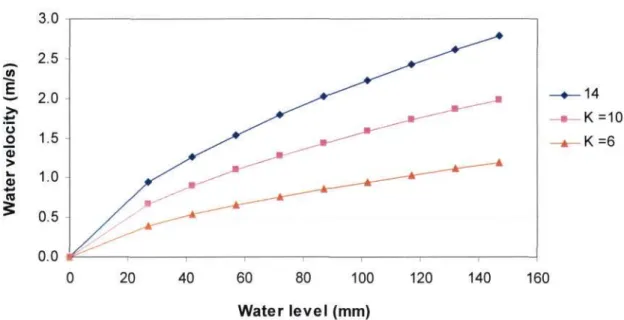
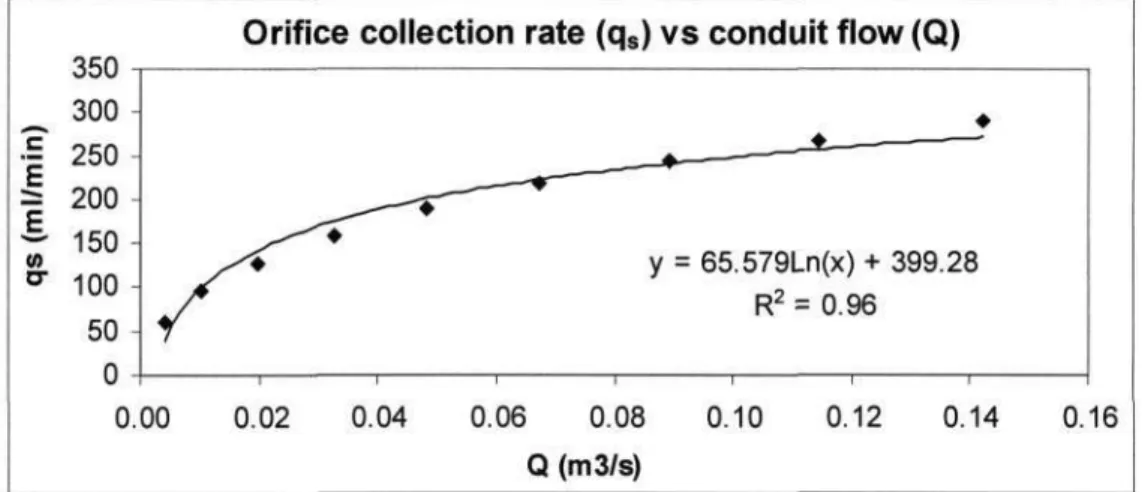
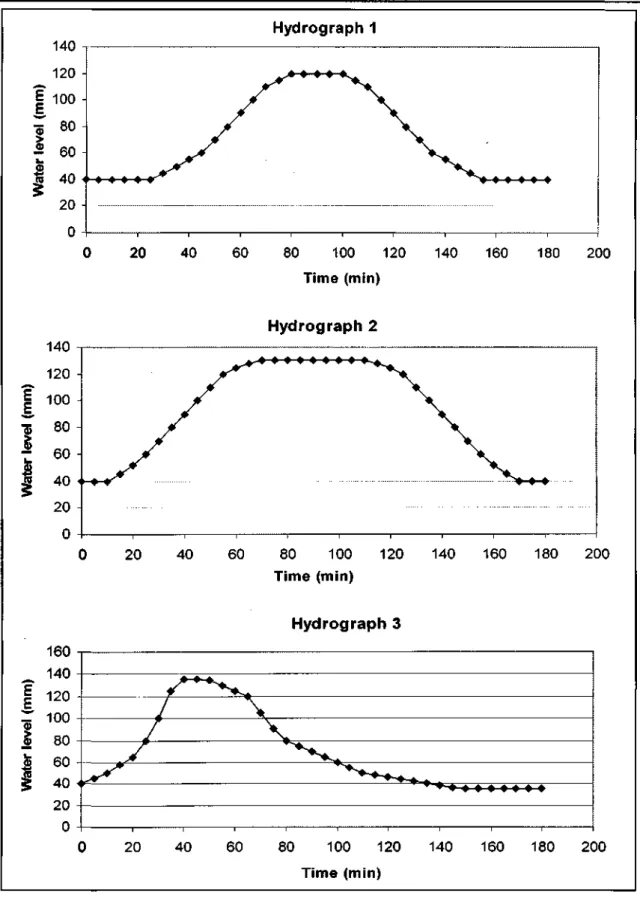
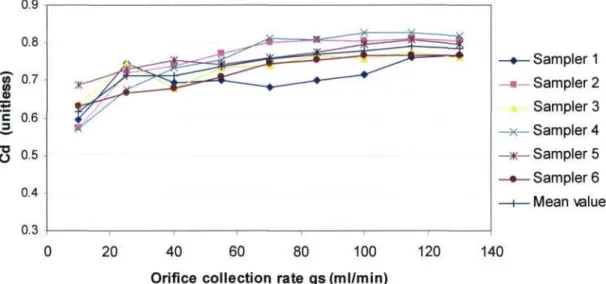
The samplers' orifice collection rates for dynamic flow conditions were measured for several water elevations and flow rates. A series of curves relating velocity and water level were produced by adjusting the k-value (see Figure 3-10).
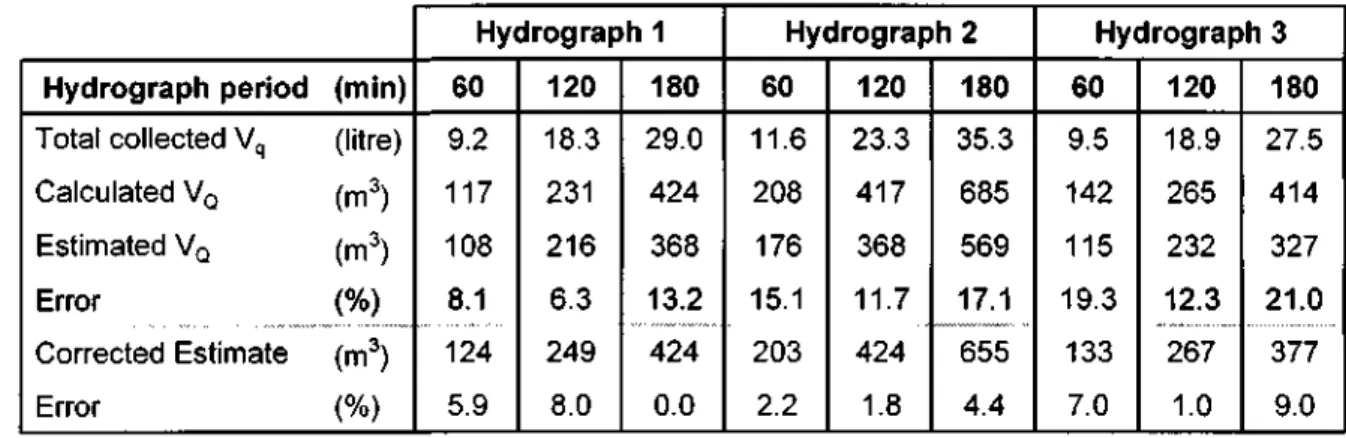
Hydrograph 2
- Field Concentration Tests for Sampler
- Study Area Selection
- Study area characteristics
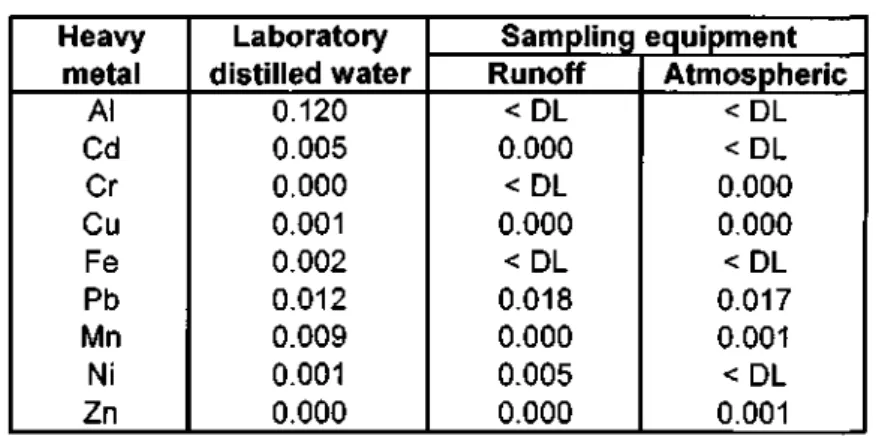
The chemical results in Table 3-11 show that the Pro.4 sampler concentrations are very similar to those of the culvert discharge. The chemical results also demonstrate the ability of the Pro.4 sampler to collect an uncontaminated sample.
Photograph of Booth West looking west
Photograph of Booth East looking east
- Pavilion shopping centre
Aerial photograph of the Pavilion shopping centre
- Monitoring Equipment
- Runoff sampling equipment
Installation of the sampler required a method of attaching the sampler and delivery tube to the central lower position of a stormwater pipe leading to the outside. The saddle held the delivery pipe in the correct position, thereby orienting the sampler and orifice entrance directly upstream (see Plate 4-7a).
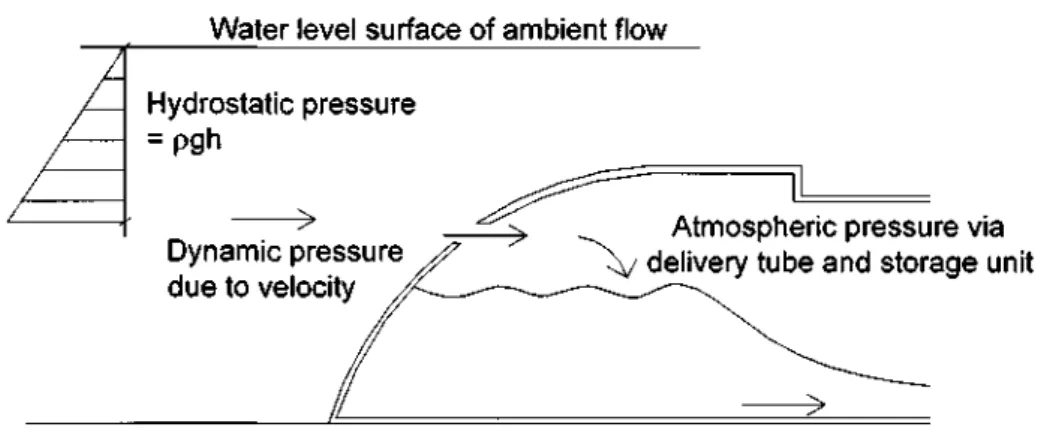
The supply pipe coming from the rainwater pipe was carefully guided at a constant downward slope to a storage drum. This modified lid was then used to replicate several more resin lids using cast silicone and casting resin (see Plate 4-7b). Plate 4-7: a) Saddles used to secure the sampler in the stormwater pipe. b) Adjusted lid to ensure atmospheric pressure was maintained.
Installation set up for the N3 Highway and manhole entrance
Bayhead road installation setup and steep open culvert
Pavilion shopping centre installation setup
- Atmospheric sampling stations
Fine non-metallic mesh placed inside the funnel neck and nylon cord supported around the perimeter of the funnel top prevented possible contamination from birds and entrapment of insects. The support arm was removed from the hopper entrance to avoid any possible interference with each other.
Atmospheric sampling station
- Flow measurement
The Vegason 61 has a variable milliamp output range that is proportional to the distance to the water surface. Changes in the water level were determined by relating the voltage change to predetermined distance ranges selected on the Vegason 61.
Pavilion shopping centre Vegason 61 installation setup
- Discharge duration measurement
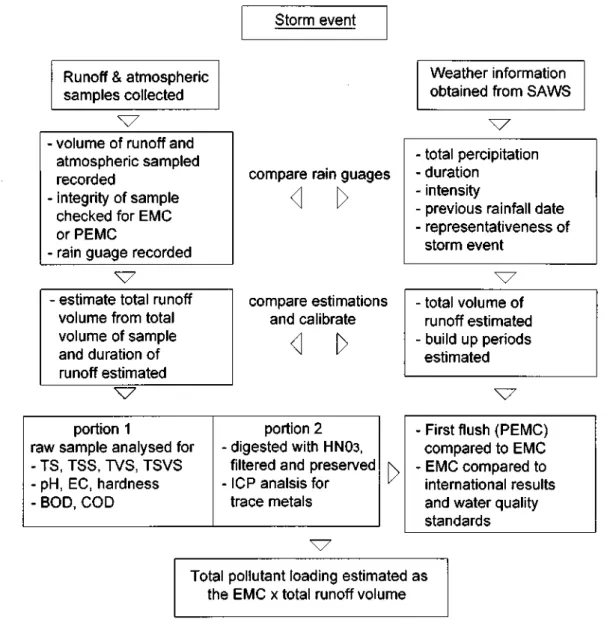
- Procedure for Runoff and Atmospheric Collection
- Rainfall and Runoff Quantity Monitoring
- Laboratory Techniques and Analysis
- Preparation for field sampling
- Collected sample material
- Analytical procedures
- Quality control
- Data Management
- Summary
A device was developed that would automatically start/stop timing when the current circuit was closed/opened due to stormwater conductivity. The device would start when the stormwater conductivity closed the circuit between two wires attached to the delivery pipe after the sampler.
DISCUSSION OF STORM EVENTS AND FIELD WORK
Storm Events
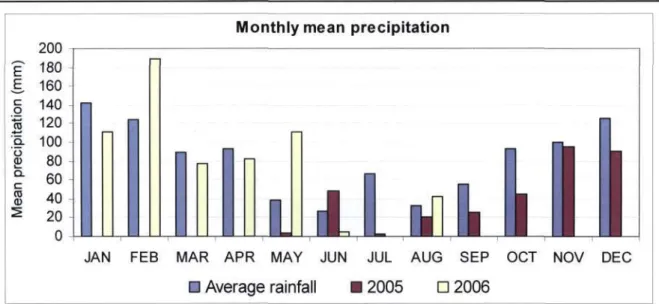
- Precipitation
- Representativeness of storm events
A description of the decisions made to examine the storms in detail is provided below, and the definition of storms that was used to evaluate the representativeness of the samples is also discussed. One large summer storm was sampled at observation site N3 on 21 February 2006.
Field Work
- Pavillion shopping centre
- Classification of runoff samples
However, the dry runoff consistently left some form of residue at the bottom of the stormwater pipe and sampling equipment that would accumulate over time. Routine maintenance was required to prevent clogging of the sampler nozzle, which would affect the collection of the effluent.
Booth B E
Samples were classified as 'EMC if (1) the orifice entrance did not show any form of blockage and an adequate amount was collected (2) the amount of sample collected indicated that although the orifice entrance may have shown some form of blockage, the sampler was operating appropriate for a significant part of the event. A sample was classified as 'PEMC' if the volume collected indicated that a blockage may have occurred during the initial stages of emptying.
EMC EMC
Factors that may have compromised the EMC of a sample were approached in conjunction with storm event characteristics and sample volume.
EMC PEMC
N3 EMC
PEMC PEMC
Bayhead Bh
PEMC
- Discharge duration timing device
- Quality control
- Weekly and Long Atmospheric Samples
- Total Culvert Flow Estimation
The procedure for estimating the total culvert discharge flow from the sample volume is described in Chapter 3. The duration for each storm was adjusted to estimate the duration of the culvert discharge.
RESULTS AND DISCUSSION
Presentation of Results
Event Mean Concentrations
- SWR EMCs Exceedance levels
- EMC comparisons between study areas
This therefore indicates that the SA effluent limits are significantly exceeded during the initial discharge of runoff events. Special General • Booth Air/East a Booth West a N3 a Bayhead • PEMC Figure 6-6: Comparison of mean atmospheric and EMCs for Chromium.
Comparison of site median EMCs with global reported values
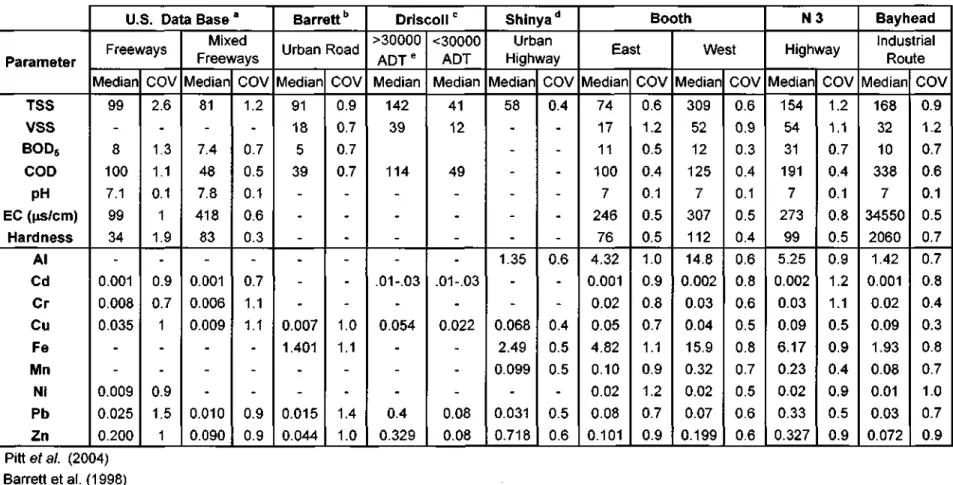
Medians for Cu indicate that Booth is within East and West. achieved while the N3 and Bayhead exceed reported values. The majority site medians for the N3, Booth West and Bayhead were similar to values reported by Driscoll et al. 1990) for urban highways (ADT > 30,000 vehicles/day) with the exception that (1) Al and Fe medians for the N3 and Booth West were significantly higher; (2) Zn site medians for Bayhead were much lower; and (3) COD medians for the N3 and Bayhead were higher.
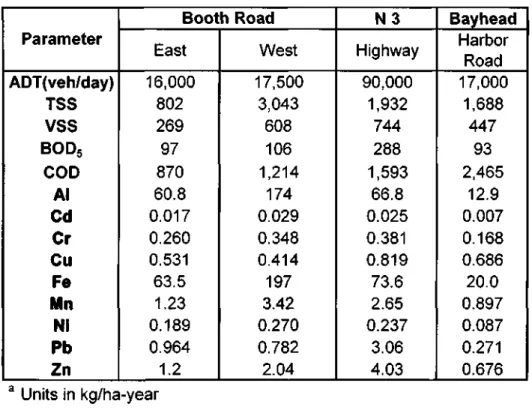
Pollutant Loadings
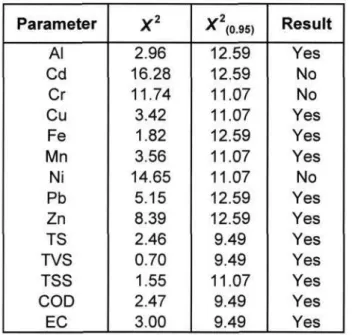
- Lognormal distribution test of SWR concentrations
BE = East Stand B B W = West Stand B N 3 = National 3 aBh = Bayhead Figure 6-14: Site comparisons of annual SWR heavy metal pollutant loads. units in kg/hectare-year). BE = East Stand « B W = West Stand « N3 = National 3 HBh = Bayhead Figure 6-15: Site comparisons of annual SWR solid pollutant loads.
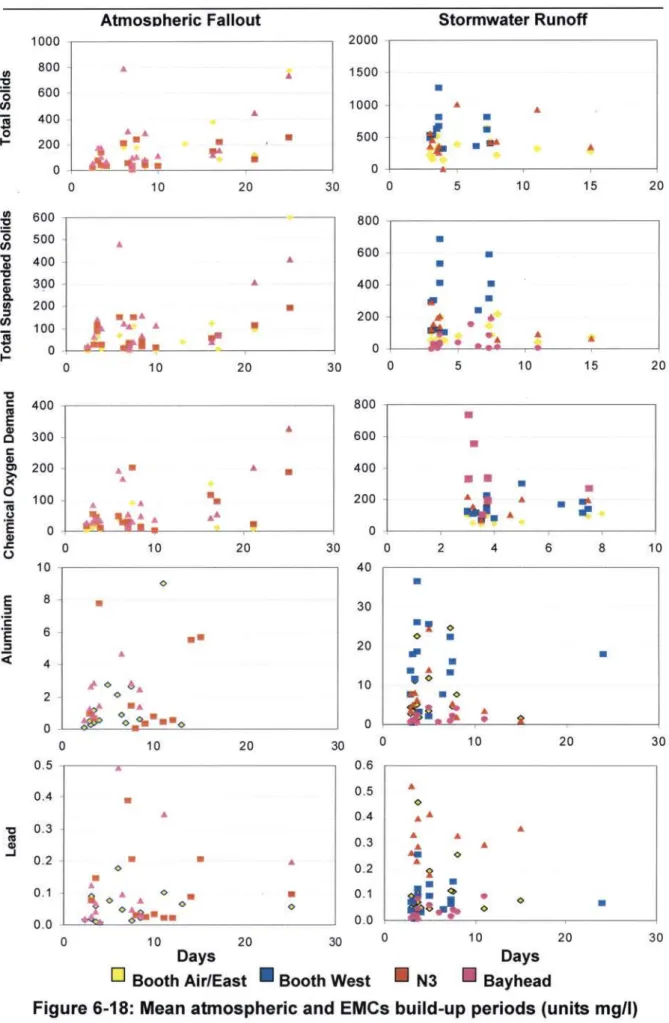
Atmospheric Deposition Contribution
- Antecedent dry weather period
BE = West Cabin BE = East Cabin N3 = National Highway Bh = Bayhead Figure 6-16: Comparison of average SWR and atmosphere. The high number of negative correlations at Booth East indicates that higher runoff concentrations are associated with smaller events.
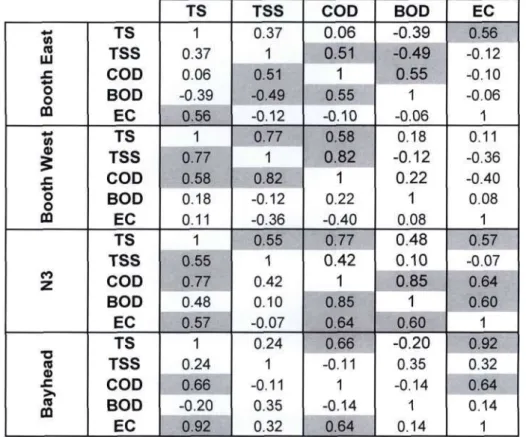
Constituent Relationships for Stormwater Runoff
On January 1, 2006, petrol stations introduced 'unleaded replacement fuel' for vehicles that could not run on 'unleaded' fuel. TS TSS COD BOD EC TS TSS COD BOD EC TS TSS COD BOD EC TS TSS COD BOD EC.
Environmental Impact Assessment
A basic water quality index (WQI) can be defined to assess the impact of stormwater runoff from a road surface to receiving water bodies. The annual load is a function of the annual export coefficient based on the type of road, annual total rainfall, runoff coefficient and road surface.

SUMMARY AND CONCLUSIONS
- Pro.4 Sampler Developed
- Local Concentrations Characterized and Compared To Global Values
- Harmful Affects
- Atmospheric Contribution
- Summation
- Suggestions for Further Research
The original objectives of the study were achieved by a sixteen-month stormwater runoff and atmospheric deposition monitoring program, using a sampling tool developed for this purpose. A long-term nationwide continuous stormwater monitoring program should be investigated in order to establish a database of stormwater runoff in South Africa.
Techniques of Water-Resources Investigations of the United States Geological Survey, Book 4, Chapter A3, USGS, USA. NDPES Stormwater Monitoring: An Evaluation of Composite Sampling Methods and the University of Washington Campus Case Study.
APPENDICES
APPENDIX A
60min
60min
APPENDIX B
Time to travel
APPENDIX C