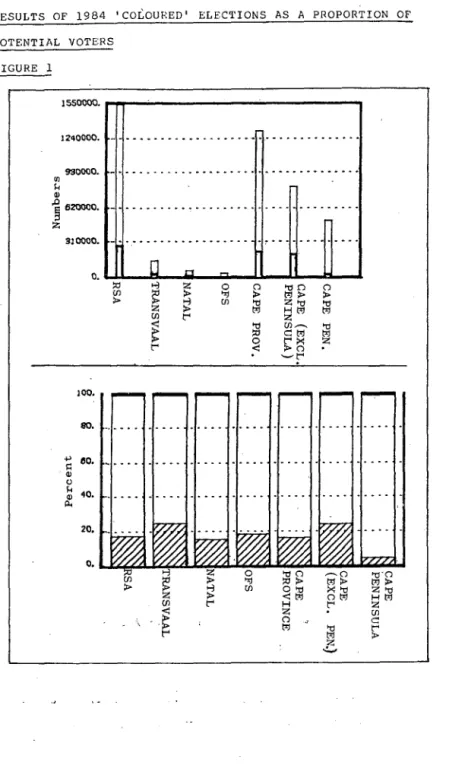
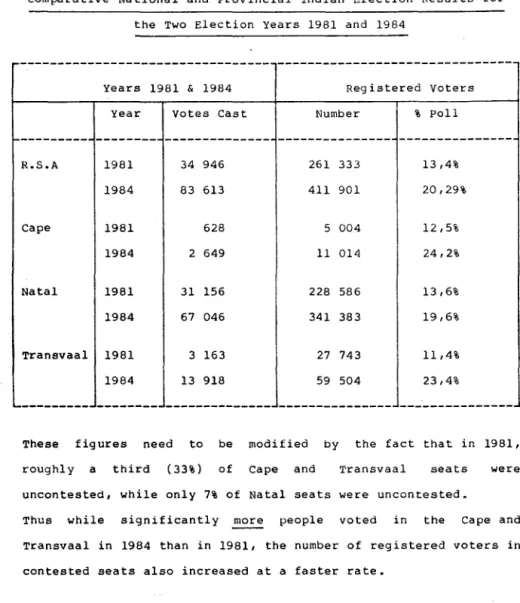
But at the same time it represents a greater centralization of power in the hands of the executive. This category gives one a count of the number of people who are eligible to vote, given existing legislation. The results of the 1984 registration battle are reflected to some extent in the following overview.
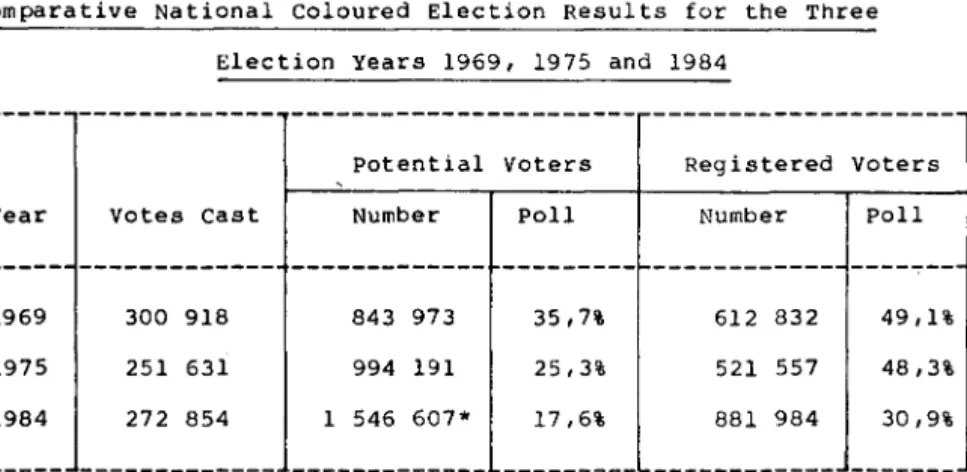
A sharp drop can be seen in the proportion of potential voters who were registered for the 1969 eRe elections and for the 1984 elections for the colored chamber of the tricameral parliament. The registered opinion poll used in the election results chapter is based on the number of registered voters. The state and parties in the Colored and Indian Houses have based their calculations of the percentage poll on the number of registered voters in contested constituencies.
The comparison of the election polls of eRe and the tricameral parliament is shown graphically in the following figures. In the following, the extent of the reduction in electoral votes by electoral units according to the intensity of electoral categories is examined. percentage of constituencies with a registered poll above 50%*. Overall, the intensity of participation of registered voters in tricameral elections was far below that of CRC general elections.
CRC ELECTION 1969
OVERVIEW OF PERCENTAGE POLLS
CONSTITUENCIES (APPROXIMATED)
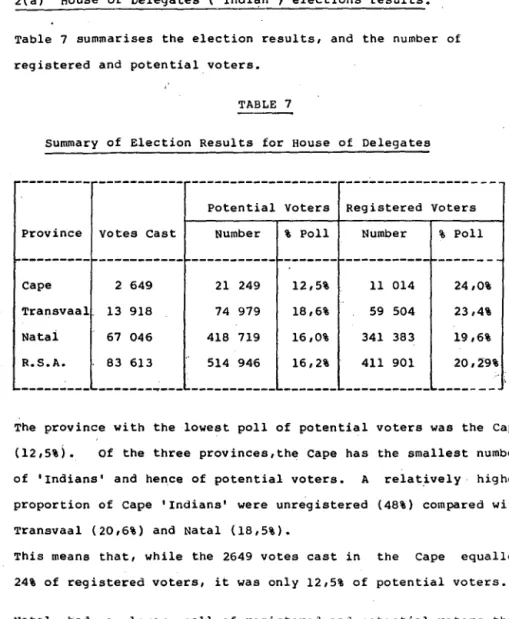
HOUSE OF REPRESENTATIVES ('COLOURED') ELECTIONS 1984
OVERVIEW OF PERCENTAGE POLLS OF REGISTEREtli'VOTERS IN CAPE
AREAS WHERE FARMWORKERS CONSTITUTED MORE THAN 40
Red second instance was the decision.to get television coverage of the colored and just anchored to the syatem in 10 different- all the reporters at House 01 Dele- Indian election did a lot to help it into roads and Lawrence was unusually porte election to speak English. A shame, so the whole operation by providing the entertainment, and it was ensured that no one ensured that the traditional symbols of journalists: an authoritative cue from Freek Swart and his four selected, could express themselves with equal results team, a constituency's score · swear-at-random voters. Swart looked like he was in a constituency that the winner was.
It is nice to know that even the very first result I House of drew at all times. The seat was and growled as were the envelopes. I wanted to describe the coverage as Bishop lavis, the percentage poll one opened by the panel; everyone squirmed awkwardly, but eventually remembered the embarrassment. Farce Is presalon; already the script was a U it was a play it would have closed funny and entertaining.
The gave the election coverage last used was at a 4th division rugby enormity of the disaster penetrated a dignity It earned nol. The panel, under the fumble even the recesses of the propaganda Suflice to say tbat when I struck direction from Sakkie Burger, tormented on the motor room, and the merciful Sleed al midoight, I felt embarrassed and about a Labor party landslide , and· murmured that the Indian competition sad. My last thought was about a dis-studyless avoid to get stuck, was canceled because of a “lack turblng trend clear 00 every election the reasons for the low percentage pU.
The problem is that they were convinced by the SABC, it seemed much more dignified, lucid, and it is. 34;imminent." The SABC appeared to be '! his map shows the number of student boycotts reported.
APPENDIX 2
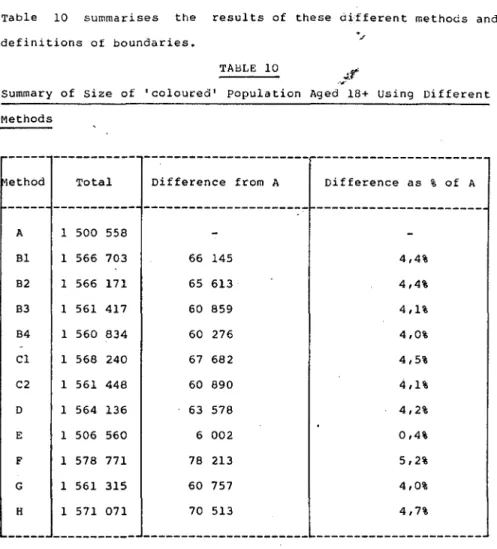
Another way the 1980 Census results could be used is to take the share of the population aged +18 in 1980 and apply this share to the estimated colored population in 1984. It ignores the form the population pyramid, which shows a proportionally larger population. by age group in the under 20 age category, compared to the over 20 age category.*l Interestingly, the result of this method is very close to the result used by the state. D Average of the six totals obtained using methods Band C E The total derived from 1980 data, using the share of the.
At the conceptual level, opponents of the state and the tricameral parliament may question the legitimacy of these disqualifiers in a broader political sense. If apartheid society fosters crime, and crimes of a particular form or intensity, for example, "criminals" disqualified by the law should be considered outside the scope of the definition of the "colored" political electorate. More importantly, whether those complicit in 'crimes against state security' will be excluded from the calculation of the potential political electorate.
On a practical level, given the absence of a sophisticated registration system, and the various criticisms of the more up-to-date white voter list, it is unlikely that the number of registered voters would have been deflated (in practice) by disqualified persons. In fact, our research into selected voter lists has revealed numerous discrepancies from duplicate registrations to registration of dead individuals.*l It is therefore possible that a portion of current registered voters may be legally disqualified from being registered and from voting. We therefore arrive at a figure for the number of potential voters under the Electoral Act of 1979 that may vary as follows (note that only results obtained from the reliable techniques used are reflected).
It leads to problems when we compare, for example, the results of the KDF elections of 1969 - before the independence of the homeland - with the elections of 1984, since that part of the 'coloureds' living within the 'independent' homelands apparently lost their citizenship their South African. Potential voters, based on the provisions of the Electoral Act 1979, must be nationals of "South Africa" as defined by the state. We recognize that in a different context and for different purposes, the results of the 1984 election could be calculated based on the original boundaries of this country.
The use of the category 'Asian' (which refers to Indians and Chinese) by both the Census authorities and the UFFR makes accurate, independent calculations difficult. The published census data on age x population size classifies 'Indians' as part of the 'Asian population group'.
APPENDIX 4 Registration of Voters
11 any of them registered as early as 1969 and 1974 and may no longer consider themselves registered at this time.*2 A number of people who registered in the most recent campaign were subsequently found to have already registered - and yet none sound mechanism to detect such duplications have been developed by the state. vi). The total projected population for 1984 (to maintain . . . consistency with current population survey data) can be obtained by multiplying the 1983 population by the growth shown in the previous year (ie the growth between 1982-1983 was equal to 1.84%);. h) Total deaths in the 15+ category for the period 1980-84 can be obtained by projecting deaths in the 15+ category either as a percentage of all deaths or as a percentage of the population. From this should be deducted those of this category who have died in the four-year period since registration.
There are no exact statistics for those who died during the entire four-year period, nor for those who died in the 14+ category. The projected total population for 1984 (to maintain ..campability with current population survey data) could be obtained by multiplying the 1983 population by the growth shown in the previous year (ie the growth between 1982-1983 was the same 1 .84%);. h) The total number of deaths in the 15+ category for the period 1980-84 can be obtained by projecting deaths in the 15+ category as a percentage of all deaths or as a percentage of the population. Note that the number of people who die at the age of 14. negligible and can be ignored for our purposes;. i) Deaths in the 15+ category as a percentage of the population are calculated for the period 1972-1979.
This is an unlikely figure, but it can be used to show the underestimation in state statistics. j) Deaths in the 15+ category as a percentage of total deaths are calculated for the period see Table 13.1) Four variations are possible in the forecasts. Since the proportions show an increase in the period we can assume that this increase will continue (in part it is due to the decrease in the infant mortality rate for the same period). This rate cannot continue indefinitely, as it may result in an imminent date, in all deaths death in the 15+ category - a.
This range of 60,000 to 78,000 more than equals the sum of all 'coloured' voters in the 10 constituencies of Natal and the orange Free State, as determined by the quotas in respect of the number of voters per constituency (assigned by the Delimitation) Commission). Statistical Survey of Black Development (BENSO), 1982, Table 6. If the whole of South Africa is accepted,*l there would be approximately 7,700 'coloureds' aged 18+ in the TBVC. No person shall be entitled to be registered or to the 50 continuation of his registration or to follow in any section. a) if he has been convicted in the Republic or in the territory of South West Africa or in an independent SIlJte. ti) of treason. iii) of an offense under the Homeland Security Act.
JO of 1950), or the Identity Documents Act in Soulh· West Africa. a) has been convicted in the Republic or in the territory of South West Africa or in an independent state of a foreign country (other than an offense referred to in subsection (I) (a)) in respect of which he has been sentenced to a period of imprisonment without the option of a fine or order to be detained under the Abuse of Dependency- 20 Producing Substances and Rehabilitation Centers Act, 1971 (Act No. Assuming that the position has not changed dramatically during the period, we our 18 + population according to this figure.
APPENDIX 7
Areas where more than 40% of the 'colored' workforce was employed in the agricultural sector were considered predominantly agricultural areas. As far as possible, a cluster of votes around a certain percentage point (e.g., had to be assigned to the same category, otherwise the assignment would have been too arbitrary and ultimately meaningless. A range of 10\ was applied to the base, and to each successive category, creating a total of six categories.
Grobbelaar, J.A., South African population projections and analysis for the period 1980-2015, Futures Research Unit, University of Stellenbosch, 1983. Solomons, K., Development of Mental Health Facilities in South Africa Paper No 34 , Conference on Health Care Economics in South Africa, University of Cape Town, 1978.