I Kaseeram, co-promoter who assisted in the related articles for the research project The gas station retailers of the City of Tshwane Metropolitan Municipality for. In recent years, gasoline price increases have been a huge challenge for gas station retailers to run sustainable, profitable and viable businesses as the price increases negatively impacted sales volumes.
Introduction
South African Economy
Gauteng Province is located in the northeastern part of South Africa (see Appendix C). Gauteng generates 10% of the African continent's gross domestic product (GDP) and a third of South Africa's GDP.
Nature of the economy
The rate of economic growth in South Africa as well as fluctuations in economic activity have a significant impact on the rest of the region due to both forward and backward trade links. Gauteng generates 10% of the GDP of the African continent and is responsible for approximately 38% of the total output of the South African economy (GEDA, 2005).
CITY OF TSHWANE METROPOLITAN MUNICIPALITY (CTMM)
There is little published literature on the petroleum industry in South Africa or on issues relating to the retail and operational parts of the business. However, reasonable conclusions can be drawn from national figures that can be extrapolated for use in the CTMM based on the amount of economic activity taking place in the area.
Literature Review
- Background
- Petroleum Studies
- Exhaustible Resources
Mlonzi's (1996) study showed the importance of emphasizing on improving service delivery to satisfy customers at service stations in black areas. Odendaal (1998), Meiring (1991) and Gritzman (1999) focus on the deregulation of the liquid fuels industry and the prospects for the industry, as the price of gasoline is still regulated by the government.
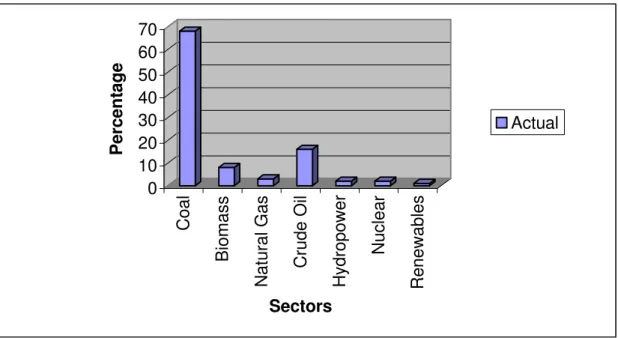
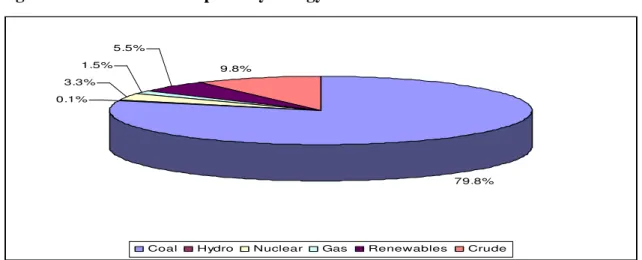
South African Energy Sources
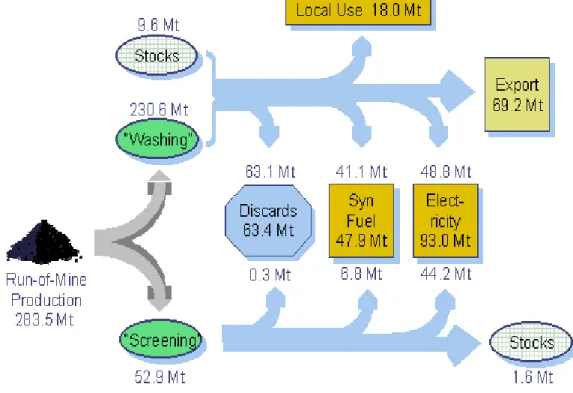
- Coal as fuel energy
Given that South Africa is a major producer, user and exporter of coal in the world, and therefore largely dependent on coal for its medium to long-term economic development, it is crucial that the potential of the rest of the country's coal resources and reserves are evaluated (DME, 2005). It is difficult to calculate the exact size of the welfare effects of the current price system.
Introduction
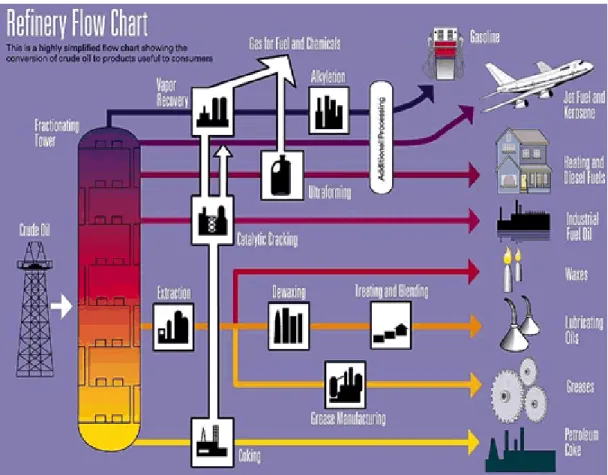
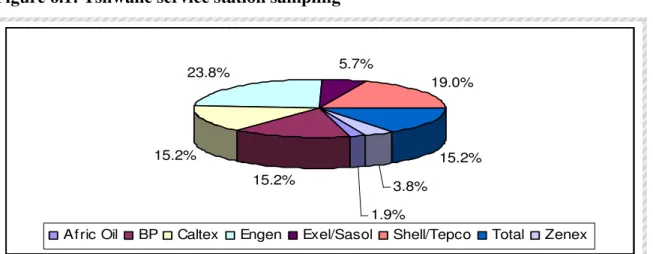
Prior to 1954, all fuel used in South Africa was imported in refined form and distributed and marketed primarily by the Royal Dutch Company - Shell, Standard Vacuum Oil of South Africa (which later became Esso and then split into Exxon and Mobil), British Petroleum (BP) and another American company (Caltex). During the millennium, South Africa saw new market entrants such as Afric Oil, Exel, Zenex and Tepco (part of the TEBA Group).
Organisations
- International Organisations
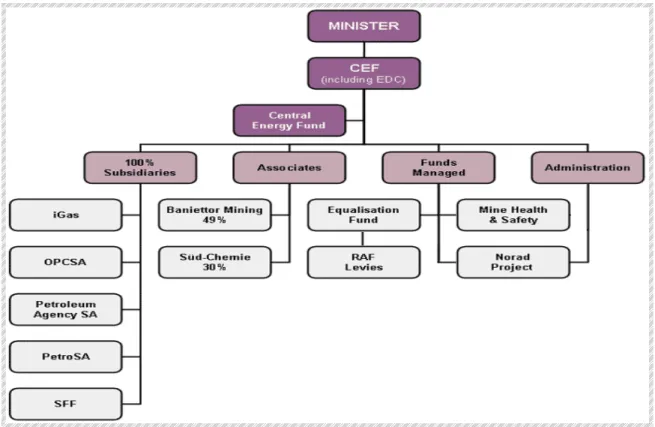
- Domestic Organisations
CEF also manages the operation and development of the oil and gas assets and the energy activities of the South African government. PetroSA contributes to South Africa's development by creating value from the country's indigenous crude oil and natural gas resources.
Petroleum companies
Caltex Oil South Africa, a leader in the oil industry, has been recognized for introducing many "firsts"; the most notable of these was the establishment of the first petrol station in Sea Point, Cape Town. Caltex Gasoline, CX3 and Vortex are officially allowed to display "The AA Approved Leader in Gasoline Technology" on their advertisements. The original synthetic fuels plant at Sasolburg, about 50 miles south of Johannesburg, was based on a combination of technologies – Germany's Fischer-Tropsch fixed bed, American Kellogg fluidized bed and Germany's Lurgi coal gasification technologies – for the synthetic production of gasoline, diesel, other liquid fuels and chemical raw materials from coal.
Legislation affecting the industry in South Africa
According to The Regulatory Mechanisms of the South African Oil Industry (1992), “the regulatory framework of the South African oil industry has had a significant impact on the economy of South Africa. The strategic crude oil storage program led to the construction of the Natref crude oil refinery, in which Sasol (52.5%, Total (30%) and National Iranian Oil Company (17.5%) had shares. b) Sasol Two. Following the above discussion, Sasol entered into a supply agreement with the rest of the oil industry.
LEGISLATIVE FRAMEWORK
The government also stresses that the review of its involvement in the liquid fuels sector must be carefully managed to minimize the impact on employment. The Afrikaanse Handelsintituut (AHI) argues that, in the longer term, there should be less government involvement in South Africa's liquid fuels sector. Labor believes that one form or another of government involvement and regulation will always be necessary given the strategic nature and cartelisation of the liquid fuels sector.
SURVEY RESULTS
Retail service station volumes ranged from under 100,000 to over 350,000 liters of gasoline per month for station sales. The survival of an individual oil company depends on its market share in terms of gasoline and diesel volumes. Exel and Tepco experienced good market share growth in both products over the years leading up to their merger with Sasol and Shell respectively.
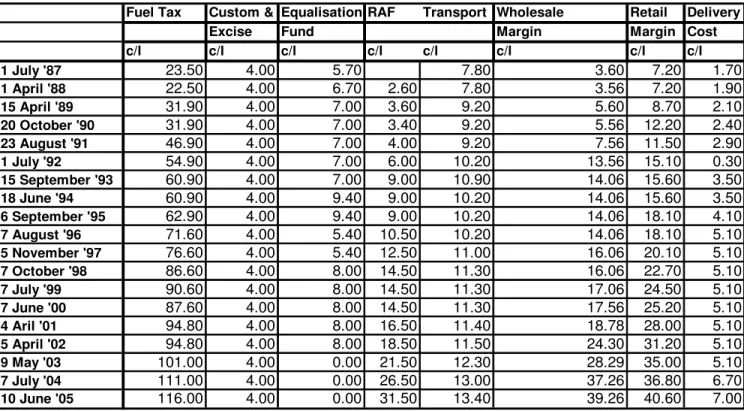
PRICE ANALYSIS
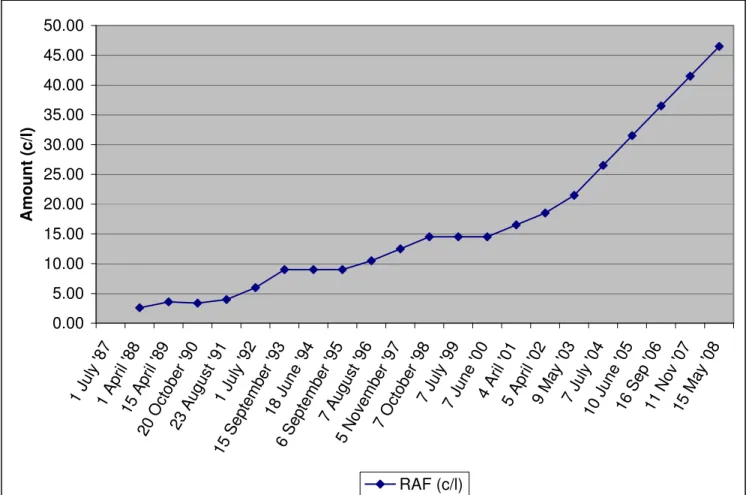
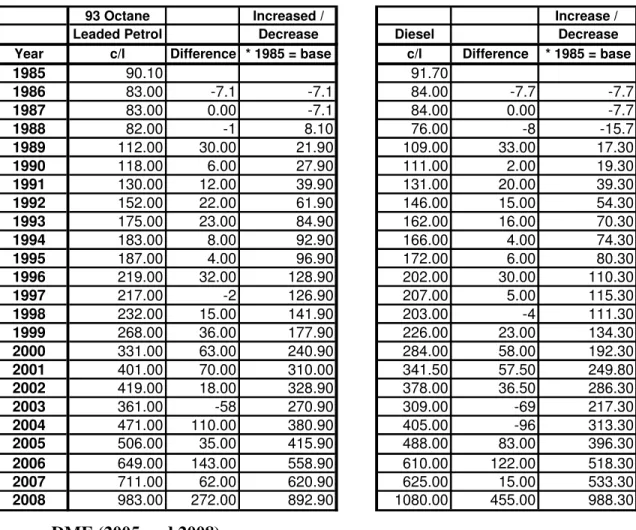
Exel and Tepco have enjoyed good growth over the years, while Afric Oil's shares have fluctuated widely over the same period for both petrol and diesel. Over the same period, an analysis of gasoline and diesel prices in Gauteng Province is presented in Figure 6.3 below. The following can be deduced from the table above: Fuel excise duty has increased over the years.
RETAILER / DEALER MARGIN ANALYSIS
See Appendix K for an example of a gasoline price announcement from the Department of Minerals and Energy. When the price of gasoline increases on a monthly basis, the retailer pays in advance (ie when buying gasoline) the price difference before the driver buys the gasoline. Retailers are funding the cost increase, for every Rand equivalent per liter each month reduces the amount of liters that can be bought the following month for the same amount of money.
PROFIT ANALYSIS
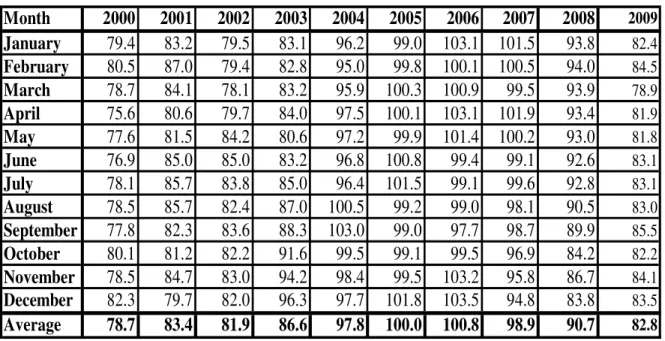
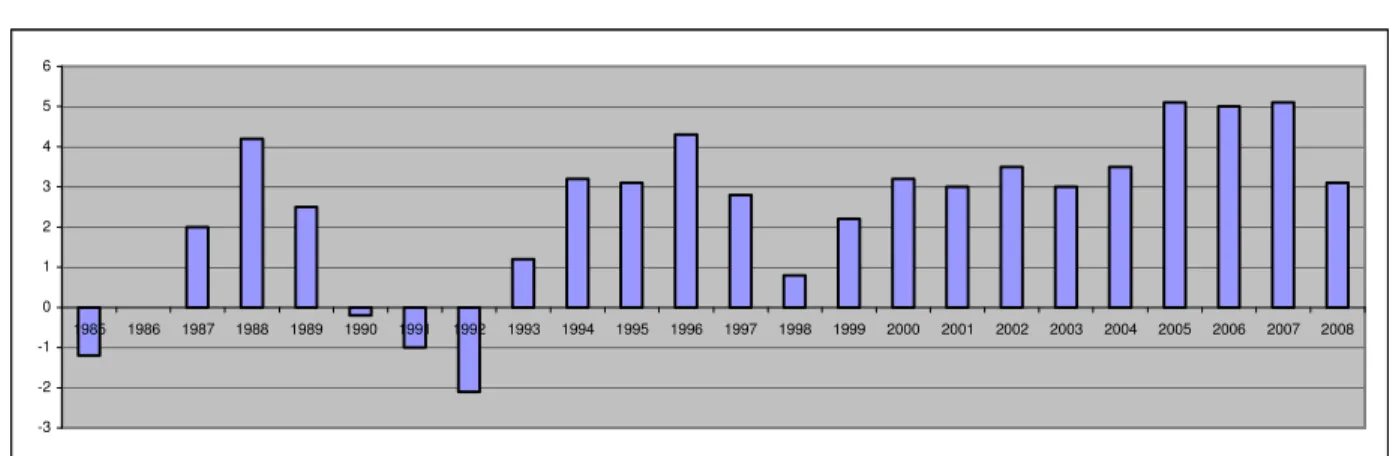
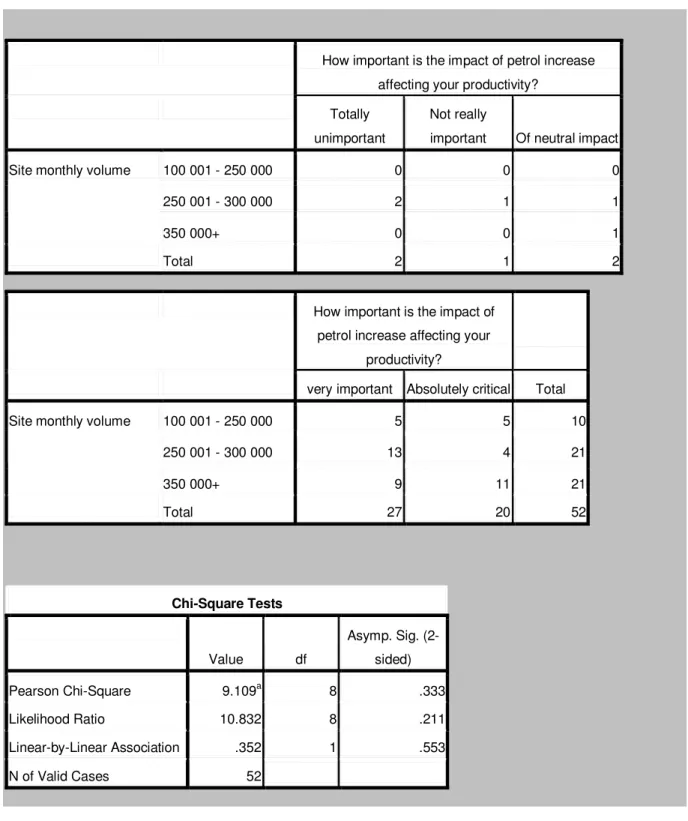
Most dealers agree that the increase in gasoline prices affects the profitability of service stations, especially those with a volume between 250,001 and 300,000 liters per month. The retailer's margin does not increase as fast as the price of gasoline (ie, cents per liter) increases. As shown in Figure 6.8, year-on-year growth in consumer prices fell below the lower end of the inflation target range in the first six months of 2005; annual CPIX inflation slowed from around 8 per cent in 2003 to around 5.9 per cent in July 2005 (SARB, 2005).
FACTORS AFFECTING PROFITABILITY
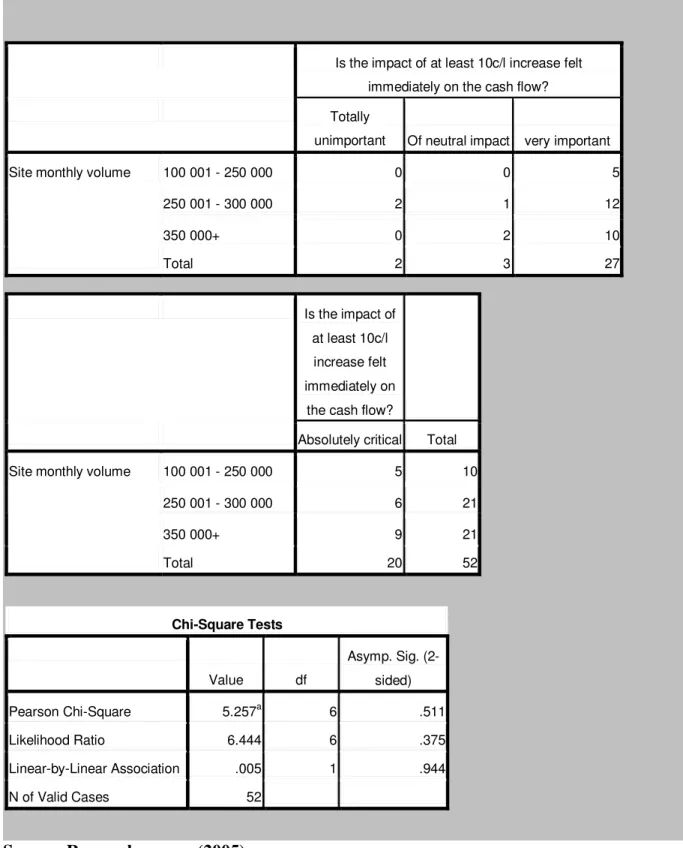
Most retailers feel that a 10c/l petrol price hike has an immediate impact on business cash flow and is very important and critical to their survival. Most retailers with sales volume above 250,000 liters per month indicate that the impact of the monthly petrol increase has a significant impact on their cash flow imbalances. High volume countries indicate that gasoline price changes affect the level of stock orders during a given month.
SITE VOLUME COMPARISON
Volume performance is almost constant during the week, but sales decline on weekends as most industries are not operating at their maximum capacity (i.e. few deliveries to customers). Township site volume increases especially on Fridays as most passengers visit their families on weekends. The volume remains constant throughout the week, but decreases on Sundays as most people don't visit the town as most shops close/close early.
RESEARCH FINDINGS
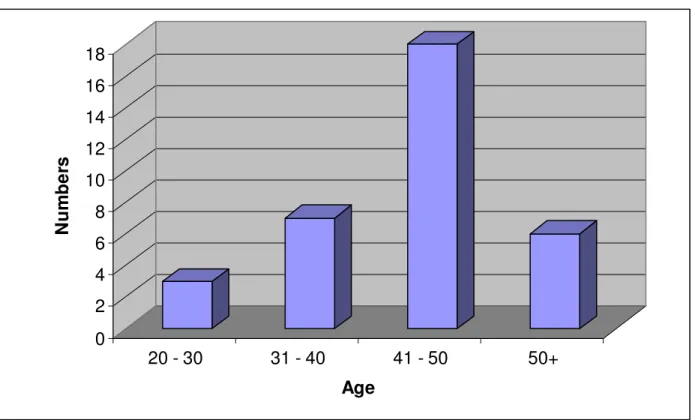
There is a good chance of sustaining the same retailers in the next decade as the 41 – 50 year old group moves beyond 50 years. The majority of the researched gas stations had an average sales volume of 250,001 liters to 300,000 liters per month, accounting for 53 percent of respondents. The location of the site and the access to the forecourt (i.e. driveway) has a major effect on the volume which ultimately results in a profitability impact.
PRICE ELASTICITY
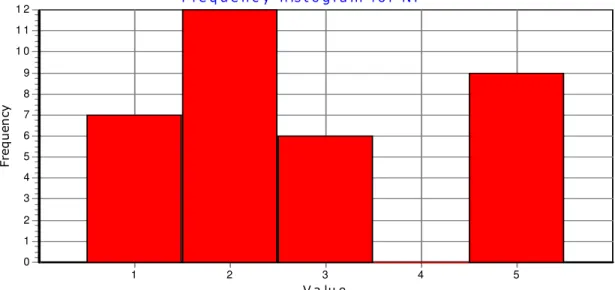
The formula in equation (1) gives the average price elasticity at the arc of the demand curve instead of at a point on the demand curve. This indicates that there is no statistically significant difference between the means of the two groups. Retail service stations are affected by high price increases, which ultimately affects the city's profitability.
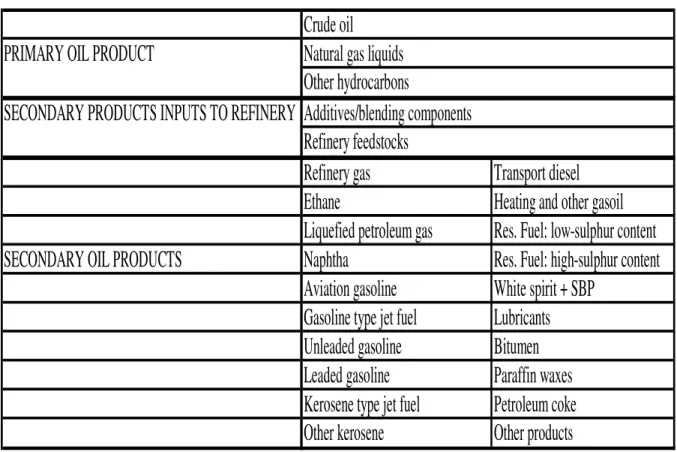
PETROL PRICE COMPOSITION
RAF and wholesale margin have increased tremendously, while increases in trade margins are much smaller than RAF and wholesale margin. You can shop around for better prices in some of the countries listed above, which can affect the price you pay by as much as R1.50 per litre. In Nigeria, you might get 50% off the price you pay for a liter if you buy on the black market.
BARRIERS TO ENTRY
Comparison with national demand growth for the same products shows that oil growth in Gauteng is extremely high. This increase, while welcomed as an indicator of robust economic growth, should be of particular concern to politicians, planners and other stakeholders.
INTRODUCTION
CONCLUSION
SUMMARY
The business confidence index was highlighted in light of the impact related to the liquid fuel industry. The chapter is concluded with a discussion on the City of Tshwane Metropolitan Municipality as the area of the research study. The survival of the gas station is the key to the economy as logistics network relies on the services of the industry.
RESEARCH FINDINGS
RESEARCH LIMITATIONS
Recommendations
RECOMMENDATIONS
The South African government should investigate the possibility of introducing deregulation of the petrol price. This is because Sasol's prices are based on R/$ for the crude oil price, while Sasol uses coal and gas to produce petrol. The government should explore the possibility of using this tax revenue to subsidize the price of petrol or add to retailer's margins as an incentive for retailers to stay in business.
FUTURE RESEARCH
Available from: http://www.geda.co.za/about/gauteng.doc Accessed on 15 September 2005. Available from: http://www.geda.co.za/about/gauteng.doc Accessed on 20 .December 2005. Available from: http://www.geda.co.za/about/gauteng.doc Accessed on 16 September 2006.
ANNEXURE A
ANNEXURE B
- PERSONAL DATA OF BUSINESS OWNER
- BUSINESS OPERATION
- COMPETITION
- STAFF COMPLEMENT
- PRICE EFFECT
Will the high price affect the survival of the site in the next five years.
ANNEXURE C
ANNEXURE D
BP South Africa (BPSA) has its head office in Cape Town and is the third largest oil company operating in South Africa. Engen is a wholly owned subsidiary of Petronas Limited and is the operating company in South Africa. 1993 - The first Shell Select Store in South Africa opened its doors at the Midrand Ultra City.