This thesis does not contain other person's data, pictures, graphs or other information, unless it is specifically acknowledged that it comes from other persons;. This thesis does not contain other people's writing, unless it is specifically acknowledged that it comes from other researchers.
Introduction
- Introduction
- Motivation and Problem Statement
- Research Aims and Objectives
- Technical Contributions
- Thesis Organisation
This is an effort to achieve a global decline in TB incidence to around 5% annually compared to the current 2% annually as part of the World Health Organization's strategy to end TB [ 37 ]. The study highlights state-of-the-art DL (CNN-based) architectures, indicating their strengths and weaknesses, evaluation metrics, and performance of current TB classifiers. ii) The study designed a robust image processing algorithm that handles the CXR pre-processing such as data enhancement, contrast enhancement, edge functions and denoising before feeding it to the CNN design model. iii) Developed new CNN architectures and fine-tuned pre-trained CNN to detect abnormalities related to TB from CXR and effectively classify it as healthy or infected. iv).
Covers the background and related work. It presents a comprehensive review of the existing methods for developing computer-aided detection systems
Presents the publications of the proposed models for detecting and classifying TB. It shows the implementation of the models
Contains the comprehensive analysis and discussion of the experi- mental results, including a comparison with results in the literature
Concludes this thesis with a summary of the presented method and recommendations for further research to improve the diagnostic accuracy of TB
Tuberculosis Detection: A Comprehensive Re- view of State-of-the-Art
- Introduction
- Conclusion
Brady, "Image filtering techniques for medical image post-processing: an overview," The British Journal of Radiology, vol. Lin, "Two-stage classification of tuberculosis culture diagnosis using convolutional neural network with transfer learning," The Journal of Supercomputing, p.
![Fig. 1. The AlexNet Architecture. [34]](https://thumb-ap.123doks.com/thumbv2/pubpdfnet/10328917.0/20.918.471.809.85.253/fig-the-alexnet-architecture.webp)
A Systematic Review of Deep Learning Tech- niques for Tuberculosis Detection from Chestniques for Tuberculosis Detection from Chest
- Introduction
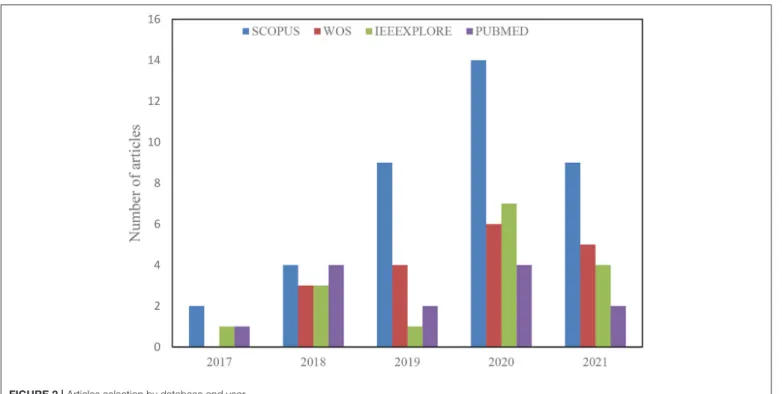
Oloko-Oba M and Viriri S (2022) A systematic review of deep learning techniques for tuberculosis detection on chest radiographs. This paper presents the results of a systematic review based on PRISMA procedures exploring state-of-the-art Deep Learning techniques for screening lung abnormalities related to TB.
INTRODUCTION
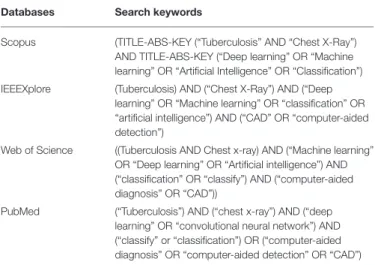
Web of Science ((Tuberculosis AND Chest X-ray) AND (“Machine Learning”. OR “Deep Learning” OR “Artificial Intelligence”) AND (“Classification” OR “Classify”) AND (“Computer Aided Diagnosis” OR “CAD” PubMed (“Tuberculosis”) AND (“chest x-ray”) AND (“deep learning” OR “convolutional neural network”) AND (“classify” or “classify”) OR (“computer-aided diagnosis” OR “computer-aided detection” OR “CAD”).
RESULTS
Scopus (TITLE-ABS-KEY (“Tuberculosis” AND “Chest X-ray”) AND TITLE-ABS-KEY (“Deep Learning” OR “Machine Learning” OR “Artificial Intelligence” OR “Classification”) IEEEXplore (Tuberculosis) AND ( "chest x-ray") AND ("deep . learning" OR "machine learning" OR "classification" OR . "artificial intelligence") AND ("CAD" OR "computer-aided detection"). Sensitivity is the proportion of true positive samples, which are correctly identified as positive (78).
DISCUSSION
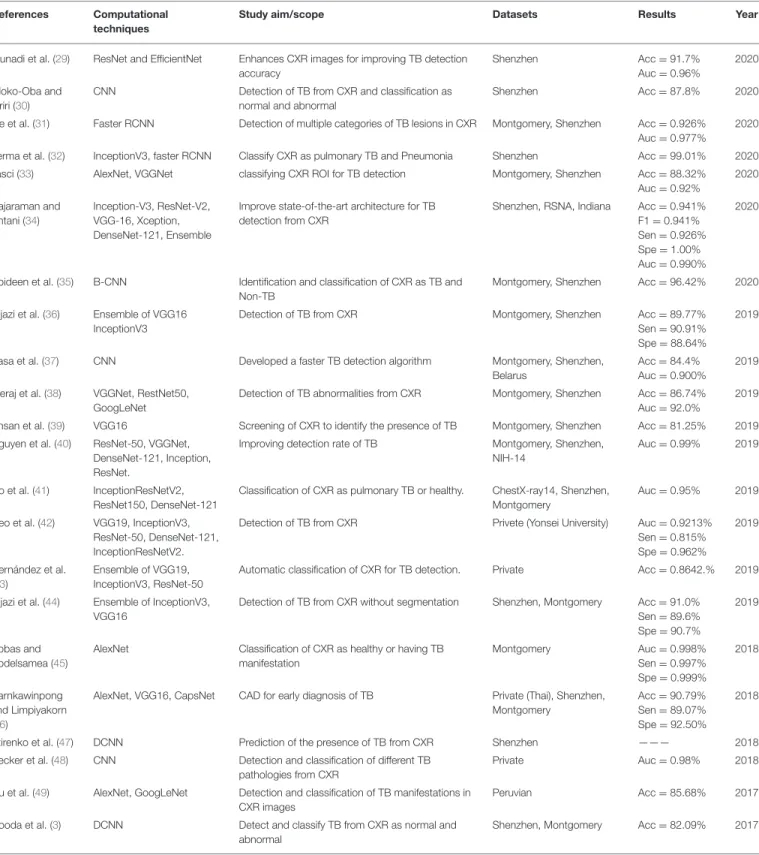
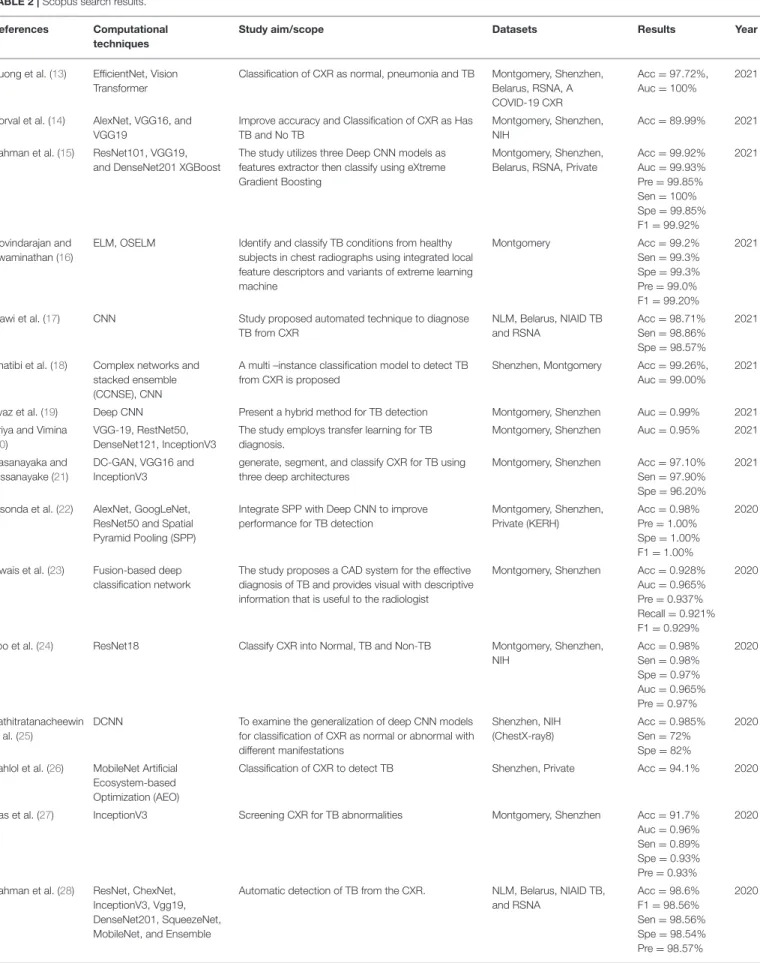
The study proposes a CAD system for the effective diagnosis of TB and provides visual descriptive information that is useful to the radiologist. Enhance the state-of-the-art architecture for TB detection by CXR. 35) B-CNN Identification and classification of CXR as TB and non-TB.
CONCLUSION AND RECOMMENDATIONS
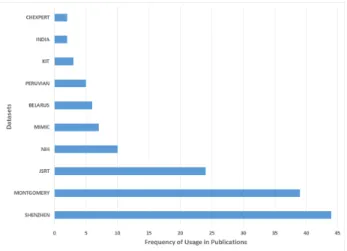
AlexNet Classification of CXR as healthy and unhealthy with manifestation of TB. the same CXR images for training and testing or not reported for it. As can be seen from the literature, these pre-trained models (VggNet, ResNet, AlexNet, DenseNet and Inception) are the most popular and have been widely explored for TB classification, as shown in Figure 4. It is highly recommended that the models are trained with a set of images and evaluated on a different set of images.
DATA AVAILABILITY STATEMENT
One of the likely weaknesses of this review is that it is limited to only the studies written in English, as there may be other high-quality studies written in other languages. However, it is recommended to conduct studies using standardized public datasets that contain additional masks of the images that can be used as ground truth to detect the infected aspect of the lung images. It is also recommended that future CAD systems focus more on clinical evaluation and be able to identify foreign objects, such as knots and rings that look like a nodule on the CXR images, which can lead to misclassification.
AUTHOR CONTRIBUTIONS
This review showed that most existing works focus on developmental studies rather than clinical studies. For example, training the model on the Shenzhen dataset and evaluating it on the Montgomery dataset will confirm better generalization.
Conclusion
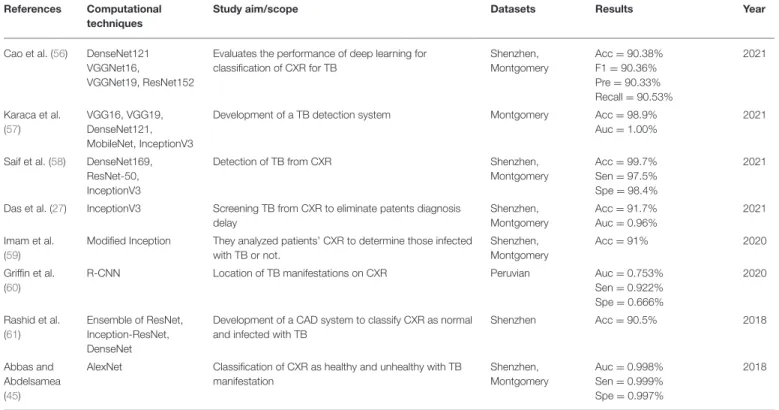
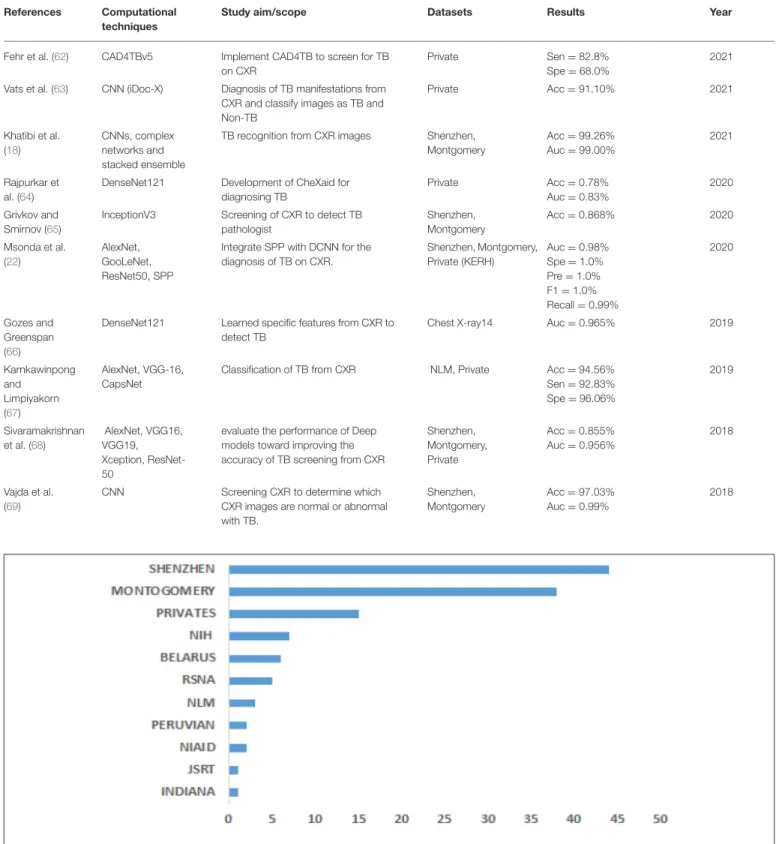
We found that pre-trained models such as ResNet, VggNet, DenseNet, Inception and AlexNet had been thoroughly investigated for TB classification. The previous chapter discussed a comprehensive review of the methods used in the diagnosis of TB. This chapter presents published work with our contribution to the development of CAD for TB diagnosis.
Diagnosing Tuberculosis Using Deep Convolu- tional Neural Network
- Introduction
One of the world's biggest causes of death is tuberculosis (TB), which is caused by the Mycobacterium bacillus. The proposed model will eliminate the problems of patients queuing for several days for examination, provide better diagnosis, operational accuracy and ultimately reduce screening costs compared to the manual CXR examination process, which is expensive, time-consuming and error-prone due to the lack of expert radiologist and the huge number of CXRs that are collected for diagnosis. One of the first research papers that used deep learning techniques on medical images is shown in [12].
Datasets
Preprocessing
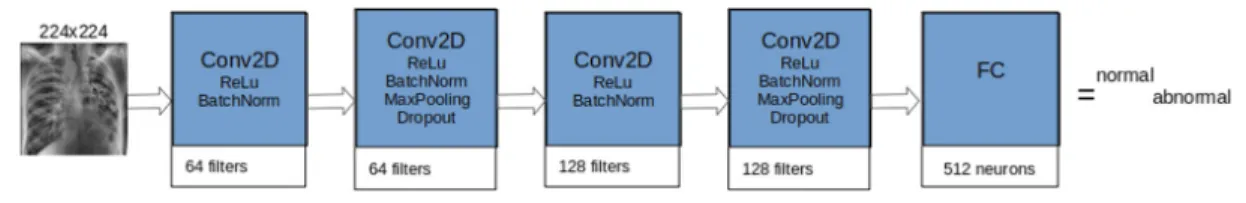
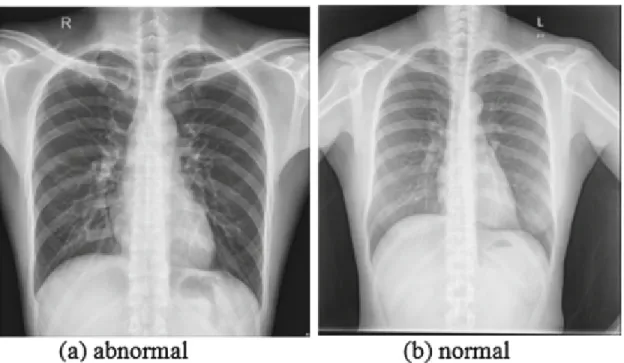
CNN models have many layers, but convolutional layer, MaxPooling and fully connected layer are considered as main layers [15]. During model training, various parameters are optimized in convolutional layers to extract meaning features before being transferred to a fully connected layer, where the extracted features are then classified into target classes, which in this case are “normal and abnormal classes. The feature extraction stage consists of convolution layers, batch normalization, relu activation function, dropout and max pooling, while the classification stage contains fully connected layer, smoothing, dense and softmax activation function.
Convolution Layer
A model based on Deep Convolutional Neural Network (CNN) structure was proposed in this work for the detection and classification of tuberculosis. There are 4 convolutional layers in the network for extracting distinct features from the input image with shape transferred to the first convolutional layer which learns 64.3 × 3 filters, the same as the second convolutional layer. The fifth layer which is the fully connected low-output 512 feature densely mapped to 2 neurons required by the softmax classifier to classify our images into normal and abnormal classes.
FULLY CONN 512
BATCHNORM 512
- MaxPooling Layer
- Softmax Classifier
- Conclusion
- Tuberculosis Abnormality Detection in Chest X-Rays: A Deep Learning ApproachX-Rays: A Deep Learning Approach
- Introduction
- Convolutional Neural Networks
- Preprocessing
- Training
The research work presented in [13] is one of the first to apply deep learning techniques to medical images. However, we present in this work a model evaluated on the Shenzhen data sets to provide an improved performance accuracy and thereby show predictions of the model validated on the ground truth data. We measure the performance of our model using the accuracy metric, which determines the ratio of the correctly predicted samples from the entire set of predictions.
World Health Organization: Chest radiography in tuberculosis detection: summary of current WHO recommendations and guidance on programmatic approaches (No
Sakai, S., et al.: Computer-aided nodule detection on digital chest radiography
Tajbakhsh, N., et al.: Convolutional neural networks for medical image analysis
- Conclusion
- Pre-trained Convolutional Neural Network for the Diagnosis of Tuberculosisthe Diagnosis of Tuberculosis
- Introduction
- Chest Radiographs Preprocessing
- Pre-trained Deep CNN Model for Feature Extraction
- Conclusion
- Ensemble of Convolution Neural Networks for Automatic Tuberculosis ClassificationAutomatic Tuberculosis Classification
- Introduction
The research paper was presented on 7 and published on 8. The ImageNet dataset can be downloaded on 9. The 'C' parameters of the system range between "0.0001 to 1000", the optimal parameter for the classifier is then chosen by applying a grid search. Sharif Razavian, A., Azizpour, H., Sullivan, J., Carlsson, S.: CNN features on the shelf: an astonishing baseline for recognition.
Pre-processing
Image Pre-processing
The pre-processing techniques applied to the CXR images in this study included Contrast Limited Adaptive Histogram Equalization [16], to improve the quality of the images in terms of brightness, and then Data Augmentation [3] was applied to enhance the diversity of training examples through flipping and stuffing. Finally, because we train multiple models, the CXR images are resized to fit the original input size of the individual model.
Building Ensemble of CNN
The proposed model was trained on the Shenzhen dataset and validated on the Montgomery dataset [13]. The performance of individual models is combined/averaged to create an ensemble classifier for Tb detection. The proposed model is trained on one dataset and tested on an alternative dataset, resulting in good generalization.
Cicero, M., et al.: Training and validating a deep convolutional neural network for computer-aided detection and classification of abnormalities on frontal chest
- Conclusion
- Introduction
Parsons, L.M., et al.: Laboratory diagnosis of tuberculosis in resource-poor countries: challenges and opportunities. The proposed Ensemble technique takes advantage of the strength of different pre-trained CNN models so that a misclassified image from model "A" can be correctly classified by model "B" or "C". This paper is an extension and improvement of the performance of the work in Section 3.4.
Ensemble of EfficientNets for the Diagnosis of Tuberculosis
Mustapha Oloko-Oba and Serestina Viriri
- Introduction
- Data and Methods
- Results and Discussion
- Conclusion
Figure 5: Accuracy and loss for the Shenzhen dataset: (a–e) performance accuracy of each EfficientNet and (f–j) the corresponding loss. Figure 6: Accuracy and loss for the Montgomery data set: (a–e) performance accuracy of each EfficientNet and (f–j) the corresponding loss. Figure 7: Accuracy and loss of the Ensemble model: (a, b) performance on the Shenzhen dataset and (c, d) performance on the Montgomery dataset.
Data Availability
One of the challenges during the experiments was to determine the best combinations of hyperparameters suitable for these models and overfiltering due to limited data samples. The result of the proposed method compared to the related Ensemble study is presented in Table 5. Efficient meshes that achieved state-of-the-art performance over other architectures to maximize accuracy and efficiency were investigated and fine-tuned on CXR images.
Conflicts of Interest
Among the five versions of EfficientNet investigated in this study, EfficientNet-B4 outperformed the others, as shown in Table 3 and shown in Figure 8. However, one of the main limitations of the proposed approach is training the model on small datasets and training in low resolution images. For a future study, we will consider combining all variants of EfficientNets and compare with other state-of-the-art models to detect foreign objects in CXR images that could affect performance or be misclassified as TB.
Conclusion
Experimental results showed the effectiveness of EfficientNets in extracting and learning distinctive features from CXR images and then classifying them into a healthy or infected class. The three best results obtained from the five-variant experiment were combined through the ensemble ensemble to improve accuracy and high sensitivity. This chapter presents a comprehensive analysis and discussion of the experimental results of the proposed CNN models presented in chapter 3 for TB detection.
Classification with proposed CNN models
The results of our CNN model published in [29] used preprocessing techniques through data augmentation [5] to significantly increase the diversity of the dataset and adjust the size of the images. The CXR images were then propagated through the convolutional layers of the proposed CNN architecture for feature extraction. The experimental results of the proposed model were evaluated to determine the classification performance using the accuracy metric.
- Classification with Modified Pre-trained CNN
- Classification with Bagging Ensemble Model
- Summary
- Conclusion
- Future Work
- A robust CAD system to simultaneously detect different pulmonary diseases
- Some diseases usually exhibit similar manifestations on the CXR, leading to misdiagnosis. Several studies are encouraged to differentiate these diseases
This section presents the experimental analysis and results of the new modified CNN model for the classification of TB. This is essential to control overfitting and obtain better generalization of the model to new datasets. A lightweight EfficientNets model that obtained state-of-the-art results on ImageNet was refined and implemented on the CXR images for the classification of TB.
![Figure 4.4: Model confusion matrix [29]](https://thumb-ap.123doks.com/thumbv2/pubpdfnet/10328917.0/118.918.184.731.116.538/figure-model-confusion-matrix.webp)
IEEE, 2010. 2
In Proceedings of the 5th International Conference on Emerging Trends in Engineering, Technology, Science and Management (ICETETSM-17), pp. A novel method for detecting tuberculosis in chest radiographs using artificial ecosystem-based deep neural network feature optimization. Deep learning for automated classification of tuberculosis-related chest radiographs: dataset specificity limits the generalizability of diagnostic performance.