FACULTY OF ENGINEERING AND THE BUILT ENVIRONMENT DEPARTMENT OF CIVIL ENGINEERING
Evaluating Different Multi-Criteria Decision Methods for the Comparison and Investigation of Public Transport
Projects
Thesis presented for the degree of
Master of Science in Engineering in the Department of the Engineering and Built Environment at The University of Cape Town
Student Name: Shameez Patel Papathanasiou Student Number: PTLSHA015
Date Submitted: 29 September 2022
Supervisor: Prof. Marianne Vanderschuren
University of Cape Town
The copyright of this thesis vests in the author. No quotation from it or information derived from it is to be published without full acknowledgement of the source.
The thesis is to be used for private study or non- commercial research purposes only.
Published by the University of Cape Town (UCT) in terms of the non-exclusive license granted to UCT by the author.
University of Cape Town
2
Plagiarism Declaration
1. I know that plagiarism is wrong. Plagiarism is to use another’s work and to pretend that it is one’s own.
2. I have used the Harvard Convention for citation and referencing. Each significant contribution to and quotation in this report from the work or works of other people has been attributed and has been cited and referenced.
3. This report is my own work.
4. I have not allowed and will not allow anyone to copy my work with the intension of passing it as his or her own work.
5. This thesis/dissertation has been submitted to the Turnitin module and I confirm that my supervisor has seen my report and any concerns revealed by such have been resolved with my supervisor.
Student no: PTLSHA015 Name and
Surname:
SHAMEEZ
PATEL PAPATHANASIOU
Date: 29 September 2022 Signature:
3
4
ACKNOWLEDGEMENTS
I would like to thank the University of Cape Town and specifically Professor Marianne Vanderschuren for her encouragement, guidance and the wealth of knowledge she provided. I would not have completed this dissertation without their support, especially approving a leave of absence which allowed me to focus on being a new parent.
I am grateful for the financial assistance that UDS Africa has provided, as well as the support and understanding from Mr. Piet van Blerk while I worked full-time and studied part-time to complete this research.
In addition to this, Mr. Pieter Onderwater provided me with industry knowledge relating directly to my research and I am forever grateful for that. I would also like to thank every person who participated in my survey, of which there are too many to mention.
Finally, and most importantly, I would like to thank my parents, husband and friends for encouraging me to complete it and by the grace of the Almighty Allah, I succeeded.
5
EXECUTIVE SUMMARY
There is a need for affordable, reliable, and safe public transport in South Africa. In Cape Town, the most popular modes of public transport are rail, bus, Bus Rapid Transit (BRT) and minibus taxis. At this stage, the various modes are not integrated and, in some instances, are running in parallel.
Many research papers have focused on comparing the capital costs and benefits of public transport investments and the results often exclude the effects of criteria that are not easily monetised. In South Africa, the Cost-Benefit Analysis (CBA) is often used to evaluate public transport projects, whereas, in this research, Multi-Criteria Decision Analysis (MCDA) methods were investigated and used. The objective of this research was to evaluate the MCDA methods available and establish it as an alternative or supplementary method, or tool, that public transport planners could use when evaluating public transport projects.
In order to test the MCDA methods, Cape Town’s existing public transport was used as a case study with each mode assumed to be operating exclusively. Therefore, the five scenarios analysed are: Rail (MetroRail); Bus (Golden Arrow); BRT (MyCiTi) Minibus Taxis, and Integrated Public Transport System (theoretical).
These modes were evaluated against a number of criteria including economic, social, and environmental impacts.
Qualitative methods were focused on, incorporating quantitative methods, in order to gain in- depth insight into public transport management and operations, as well as the costs and benefits involved, both direct and indirect.
Research on public transport practices, locally, nationally, and internationally was performed.
From this, alternatives for the case study, as well as the assessment criteria, were established.
The research also included investigating multi-criteria analysis methods, ultimately leading to the methods chosen for the analysis. In order to perform the analyses using the alternatives and assessment criteria, the criteria needed to be weighted. The scenarios were analysed using an UNWEIGHTED viewpoint, where each criterion was equally weighted; WEIGHTEDs viewpoint, where each criterion was weighted by key players (specialists) in the public transport discipline; WEIGHTEDp viewpoint, where each criterion was weighted by the general public who have used public transport in Cape Town. As this may lead to differing results, aggregation methods were also included in the research.
As mentioned, the integration of this investigation involves optimising the method in which public transport projects are being evaluated by establishing a multi-criteria analyses method which is reliable, simple, and capable of including a variety of criteria, both monetary, qualitative, and quantitative. A variety of comparative evaluation methods exist. Within this, as mentioned, the popular methods for public transport appraisal are Cost-Benefit Analysis and a variety of Multi-Criteria Decision Analysis methods.
6
Cost-Benefit Analysis (CBA) is the most used evaluation method for assessing infrastructural investments. In the transport field, it is the basic tool in most countries (Beria et al., 2012). The CBA is based on the monetisation and inter-temporal discount. Money is the measure unit used as common numeracy to translate all costs and benefits associated to an investment or a policy.
Once all relevant effects of an investment are quantified, the concept of inter-temporal discount is used to translate future costs and benefits to present day by means of a social discount rate.
In this way, the future can be compared with the present (Beria et al., 2012).
CBA weighs the pros and cons of a project in a rational and systematic process. It inherently requires the creation and evaluation of at least two options, “do it or not”, plus it requires an evaluation at several different scales (nothing, minimum and all, as the least requirements) (OECD, 2006; EC, 2008; Ninan, 2008 as cited in Jones et al., 2014).
Costs generally associated with a cost-benefit analysis include those related to construction and future maintenance, such as capital, major rehabilitation and annual maintenance costs over the life-cycle of the project. Other considerations include discounting of future costs and benefits, dealing with opportunity costs, inflation, avoidance of double counting, avoidance of sunk costs, dealing with joint costs and dealing with the sensitivity analysis (Kentucky Transportation Center, 2016). The limitations often associated with CBA includes omitting costs or key benefits, as well as measuring factors like travel time savings and safety improvements, which are not easily monetised (Kentucky Transportation Center, 2016).
In an attempt to mitigate the weaknesses of the CBA, Multi-Criteria Decision Analysis (MCDA) methods were investigated. Generally speaking, a multiple criteria decision problem is a scenario in which having defined a set of actions/solutions (Do nothing / Upgrade Rail / Additional buses etc.) and a consistent family of criteria (Cost / Accessibility / Safety etc.), the Decision Maker (DM) tends to determine the best subset of actions and solutions according to the criteria (choice problem), divide the solutions into subsets representing specific classes of solutions according to the concrete classification rules (sorting problem) or rank the actions and solutions from best to worst, according to the criteria (ranking problem) (Zak, 2010).
As previously mentioned, there are many MCDA methods available, Macharis & Bernardini (2015) performed an investigation to establish the most commonly used methods used for transport project analysis. The top three most popular methods are AHP/ANP (Analytic Hierarchy/Network Process) – often used in combination with another method, such as the Evaluation of Mixed Data method (EVAMIX), TOPSIS (Technique for Order of Preference by Similarity to Ideal Solution) and Fuzzy Set – often used as a part another method, such as the Simple Additive Weighting Method (SAW, also known as Weighted Sum).
The SAW method appeals to the school of thought of unified scores across alternatives, applying weighting and sums the result per alternative. The EVAMIX method appeals to the second school of thought and takes it one step further. After the unification of scores, the alternatives are compared pairwise (Vanderschuren & Frieslaar, 2008).
7
In order to compare the outcomes of different methods without the use of specialised software, to make the method accessible, the SAW method and EVAMIX method was used in conjunction with the AHP method, therefore, appealing to both schools of thought.
The AHP method, as developed by Saaty (1980) is a helpful tool for managing qualitative and quantitative criteria involved in decision-making. As stated in the name, it is based on a hierarchical structure (Taherdoost, 2017). The AHP method also develops a linear additive model, but in its standard format, uses procedures for deriving weights and the scores achieved by alternatives which are based, respectively, on pair-wise comparisons between criteria and / or options (Department of Communities and Local Government, 2009). The fundamental input to the AHP method is the decision makers’ answers to a series of questions in the general form,
‘How important is criterion A relative to criterion B?’ These pair-wise comparisons can be used to establish the weights for criteria and the performance scores for the options on the different criteria (Department of Communities and Local Government, 2009).
The SAW method, also known as weighted linear combination, weighted summation or scoring methods is a simple and often used multi attribute decision technique. The method is based on the weighted average. An evaluation score is calculated for each alternative by multiplying the scaled value given to the alternative of that attribute with the weights of relative importance directly assigned by the decision maker, followed by summing of the products for all criteria.
The advantage of the method is that it is a proportional linear transformation of the raw data which means the relative order of magnitude of the standardised scores remains equal (Afshari et al., 2010)
The EVAMIX method was first introduced by Voogd (1982, 1983) and developed by Nijkamp et al. (1990), and Martel and Matarazzo (2005) as cited in Tuş Işık & Aytaç Adalı, (2016). A key component of the method is that it includes and combines both ordinal and cardinal, beneficial and non-beneficial data within the same evaluation matrix, hence the name. The EVAMIX method makes different computations to the data in the evaluation matrix depending on whether it is ordinal or cardinal (Hajkowicz & Higgins, 2008, as cited in Tuş Işık & Aytaç Adalı, 2016). The EVAMIX is a simple decision support tool, it requires pairwise comparison of alternatives, for each pair of alternatives, a dominance score for the ordinal and cardinal criteria are calculated. Then these dominance scores are combined into an overall dominance score of each alternative (Hinloopen et al., 2004, as cited in Tuş Işık & Aytaç Adalı, 2016).
Finally, the alternatives are ranked based on the appraisal scores (Chatterjee & Chakraborty, 2013, as cited in Tuş Işık & Aytaç Adalı, 2016).
The two chosen MCDA methods rank the alternatives, however the results of these rankings may not be the same, because of the different assumptions made in each method as well as the difference in criteria weights between the weighted and unweighted analyses. In this case, the aggregation of the methods may be needed. In this paper, it is proposed that the Borda and Copeland methods are used, as well as the Average Ranking Procedure. The Average Ranking Procedure ranks the alternatives by their mean values as opposed to the Borda and Copeland Method which rank alternatives by voting (Cheng & Saskatchewen, 2000).
8
As mentioned, there are many ways that public transport projects are evaluated and part of the reason that a structured methodology is not used, is due to the complex nature of public transport. The potential impacts are directly related to the range (e.g., economic, financial, environmental, social, direct/indirect) and affected groups (users, non-users, as well as government and private operators) (Ferreira & Lake, 2002). For the sake of this thesis, a multi- actor multi-criteria analysis was adopted and the three views were analysed (specialist, academic and transport users).
Using the existing public transport in Cape Town as a case study, the following scenarios were analysed: Existing rail (MetroRail); Existing bus service (Golden Arrow); Existing BRT service (MyCiTi); Existing minibus taxi service and Theoretical integrated public transport system.
It should be noted that for the theoretical integrated transport system, it was assumed that the existing rail, BRT and bus service continued operating and the minibus taxis would operate as feeders to the rest of the system. The services would not operate in parallel. In addition to this, it was also assumed that the BRT system would not expand and instead the funds available would be used to upgrade the existing public transportation along the proposed routes.
The above scenarios were evaluated against a set of criteria. To establish the criteria, the most important criteria were identified by evaluating official statements and government documents to establish what the focus is regarding public transport in South Africa. The criteria were as follows: Cost, Land-Use, Affordability for Users, Accessibility, Estimated Speed, Convenience
& Reliability, Environmental Effects, and Safety & Security.
Two methods of MCDA were used with three alternate weightings as previously described, specialist, general public and academic (unbiased).
The AHP method used to establish weightings was simple to use for both the planners/engineers and the general public, as the consistency ratio was under 10% it can, therefore, be concluded that the general public were consistent in their answers thereby understanding the questions and the survey method.
The general public rated ‘Accessibility’ as the top criteria, whereas the specialists in the private sector and public sector agreed that ‘Safety & Security’ is the top criteria, which is the second most important criteria to the general public. Tied with ‘Safety & Security’ for the second most important criteria, the general public also voted for ‘Affordability’, the private sector specialists agreed, whereas the public sector rated ‘Accessibility’ as the second most important criteria. In third place, the general public, as well as the specialists in the public sector agreed that ‘Cost’
is important, whereas the private sector rated ‘Accessibility’ as the third most important criteria.
While the three perspectives differed in ranking, it can be seen that the top four criteria across the board, in no particular order were ‘Accessibility’, ‘Affordability’, ‘Safety & Security’ and
‘Cost’.
On the other end of the scale, the lowest weighted criteria were seen to be ‘Speed’ for the general public and ‘Environmental’ for engineers in both the public and private sector. The engineers in both the public and private sector agree that ‘Speed’ is the second least important
9
criteria and conversely, the general public has ‘Environmental’ listed as the second least important criteria. All three perspectives agree that ‘Convenience & Reliability’ was the third least important criteria. Therefore, it can be seen that the bottom three criteria, in no particular order were ‘Speed’, ‘Environmental’ and ‘Convenience & Reliability’.
The SAW method using the specialist weighting (public and private combined) and the general public weighting, resulted in the same conclusion. The theoretical integrated transport system was the best choice, and the BRT system was considered the least favourable. The academic perspective resulted in minibus taxis being the best choice and the worst choice coincided with the specialist and general public perspective, i.e. BRT.
The EVAMIX method results differ slightly between the three perspectives, however, all three agreed that the theoretical integrated transport system was the best alternative. The specialist perspective resulted in the trains being the worst option and the general public and academic perspective resulted in the BRT being the least favourable option.
The results were aggregated using three aggregation methods. These methods resulted in the same three rankings with the theoretical integrated system being the best option for investment and the BRT being least desirable option.
It should be noted that this evaluation was based on a theoretical approach to the integrated transport system and once the system is designed, further evaluation using accurate data, should be performed. This may change the outcome.
In conclusion, both methods of MCDA were implemented with feasible results and, therefore, both methods of MCDA are easily applicable to the evaluation of public transport projects.
It is recommended that, as far as possible, primary data be collected when implementing public transport evaluations. It is also recommended to evaluate public transport projects over the lifecycle of the chosen project. Generally, public transport projects are evaluated by or by the order of the City of Cape Town or Western Cape Government and should this be the case, access to more accurate data should be achievable. It is further recommended that should an integrated transport system be considered, the analysis is re-evaluated with the detailed design of the integrated transport system which would provide more precise data and may change the results.
10
List of Abbreviations
AHP – Analytic Hierarchy Process AVP – Average Ranking Procedure BRT – Bus-Rapid Transport CBA – Cost-Benefit Analysis CoCT – City of Cape Town DM – Decision Makers
EVAMIX – Evaluation of Mixed Data
MAMCA – Multi-Actor Multi-Criteria Analysis MCDA – Multi-Criteria Decision Analysis POV – Point of View
SANTACO – South African National Taxi Council SATC – South African Transport Conference SAW – Simple Additive Weighting
TOPSIS – Technique for Order of Preference by Similarity to Ideal Solution UITP – International Association of Public Transport
VOC – Vehicle Operating Cost VOT – Value of Time
WCG – Western Cape Government
11
Contents
Plagiarism Declaration ... 2
ACKNOWLEDGEMENTS ... 4
EXECUTIVE SUMMARY ... 5
List of Abbreviations ... 10
List of Figures ... 14
List of Tables ... 14
1 INRODUCTION ... 16
1.1 Background to Study ... 16
1.2 Problems to be Investigated ... 16
1.3 Purposes of the Investigation ... 17
1.3.1 Research Questions ... 17
1.4 Major Assumptions Made ... 17
1.5 Structure of the Thesis... 18
2 METHODOLOGY ... 19
2.1 Research Procedure ... 19
2.1.1 Sources of information ... 20
2.2 Multi-Criteria Decision Analysis Methods ... 21
2.2.1 Analyses Methods ... 21
2.3 Scenarios Analysed ... 21
2.4 Criteria and Weighting Used ... 21
2.5 Case Study Evaluation, Results and Analyses ... 22
3 LITERATURE REVIEW ... 24
3.1 Evaluation Methods... 24
3.1.1 Cost-Benefit Analysis Method ... 24
3.1.2 Multi-Criteria Decision Analysis Methods ... 29
3.1.3 Aggregation Methods... 37
3.1.4 CBA versus MCDA methods... 38
3.1.5 Time Periods to Evaluate ... 40
3.1.6 Stakeholder Involvement ... 41
3.2 Criteria Included in the Investigation ... 42
3.2.1 Direct impacts of transportation infrastructure provision: ... 44
3.2.2 Socio-economic impacts (a. Land development impact): ... 44
12
3.2.3 Socio-economic impacts (b. Transportation-related impact): ... 45
3.2.4 Socio-economic impacts (c. Socio-economic development impact): ... 46
3.2.5 Socio-economic impacts (d. Impacts on government fiscal balances) ... 48
3.2.6 Transport network effects: ... 48
3.2.7 Energy and environmental impacts:... 48
3.3 External Factors Affecting Public Transport Evaluation ... 49
4 CASE STUDY: CAPE TOWN PUBLIC TRANSPORTATION MODES ... 51
4.1 Criteria Analysed... 51
4.1.1 Cost-effectiveness ... 52
4.1.2 Land-Use and Integration ... 52
4.1.3 Affordability for Users ... 54
4.1.4 Social Goals (Access) ... 54
4.1.5 Speed ... 54
4.1.6 Convenience & Reliability ... 54
4.1.7 Environmental Impacts ... 55
4.1.8 Safety ... 55
4.1.9 Economic Development ... 55
4.2 Criteria Selection ... 55
4.3 Scenarios Analysed ... 55
4.3.1 Existing Rail... 55
4.3.2 Existing Bus Service ... 58
4.3.3 Existing BRT Service ... 59
4.3.4 Existing Minibus Taxi Service... 61
4.3.5 Proposed Integrated Public Transport System ... 61
4.4 Evaluation of The Different Modes ... 64
4.4.1 Cost ... 64
4.4.2 Land-Use ... 66
4.4.3 Affordability ... 67
4.4.4 Accessibility ... 68
4.4.5 Speed ... 73
4.4.6 Convenience ... 74
4.4.7 Reliability ... 75
4.4.8 Environment ... 76
13
4.4.9 Safety ... 77
5. ANALYSIS AND RESULTS ... 80
5.1. Weighting of Criteria ... 80
5.2. Weighted and Unweighted MCDA using SAW Method ... 82
5.3. Weighted and Unweighted MCDA using EVAMIX Method ... 83
5.4. Aggregation of Results ... 85
6. DISCUSSION ... 87
7. CONCLUSIONS... 89
8. RECOMMENDATIONS ... 92
9. BIBLIOGRAPHY ... 93
10. APPENDICES ... 99
Appendix A: Example of the Use of CBA in Transportation Evaluation ... 100
Appendix B: Example of the Use of AHP in Transportation Evaluation ... 104
Appendix C: Example of the Use of SAW and EVAMIX in Transportation Evaluation ... 105
Appendix D: Example of Survey ... 106
14
List of Figures
Figure 1: Methodology Flow Chart ... 19
Figure 2: Cost-Benefit Analysis Method in Transportation ... 27
Figure 3: The universal scheme of the multi-criteria decision-making process ... 30
Figure 4: MCDA methods used for transport projects... 30
Figure 5: Simple Hierarchial Tree ... 32
Figure 6: Random Consistency Index ... 34
Figure 7: SAW Flowchart ... 35
Figure 8: Evolution of the numbers of transport projects publications ... 40
Figure 9: Pyramid of Customer Needs... 46
Figure 10: Locality plan showing the MetroRail stations in Cape Town being investigated .. 56
Figure 11: MetroRail Routes ... 57
Figure 12: Locality plan showing the bus stops in Cape Town being investigated ... 58
Figure 13: Locality plan showing the MyCiTi bus stops in Cape Town being investigated ... 60
Figure 14: Trunk, intermediate and feeder routes in Cape Town for minibus taxis ... 61
Figure 15: Locality Plan showing the MyCiTi, MetroRail, Golden Arrow and minibus taxi stops being analysed as part of an integrated transport system in Cape Town ... 63
Figure 16: Area of Cape Town covered by Metrorail Stations ... 638
Figure 17: Area of Cape Town covered by Golden Arrow Bus Stops ... 70
List of Tables
Table 1: Major Weaknesses of CBA ... 28Table 2: Responses of relative importance based on Saaty's nine-point scale ... 32
Table 3: Impacts by stakeholder of a transport project ... 41
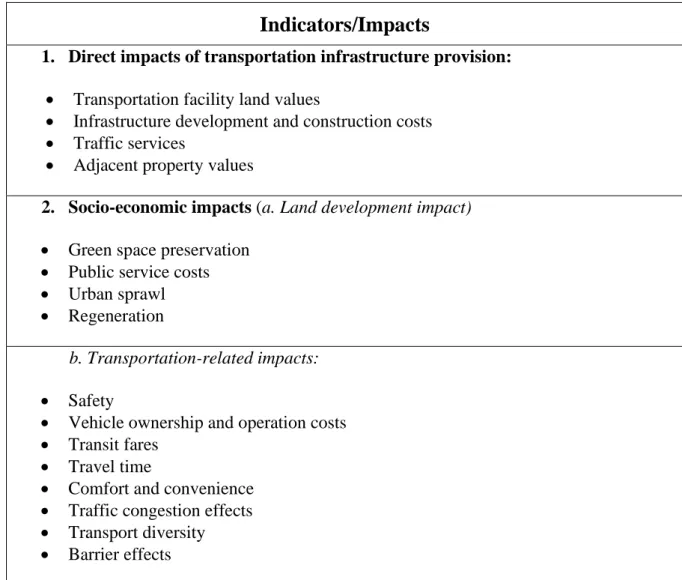
Table 4: List of Indicators/Impacts ... 42
Table 5: Land-Use Impacts ... 53
Table 6: Mean values assigned via survey results for specialists ... 81
Table 7: Mean values assigned via survey results for the general public ... 81
Table 8: Specialist, Academic (Unbiased) and General Public Criteria Weighting ... 82
Table 9: Decision Matrix showing alternatives and criteria ... 82
Table 10: Normalised Decision Matrix as per SAW Method ... 83
Table 11: SAW Method Results and Ranking ... 83
Table 12: Normalised Matrix for EVAMIX Method ... 84
Table 13: Standardized Dominance Scores for Each Pair of Alternatives (Specialist)………84
Table 14: Standard Dominance Scores for Each Pair of Alternatives (Public) ... 84
Table 15: Standardized Dominance Scores for Each Pair of Alternatives (Unweighted) ... 85
Table 16: Final Ranking of Alternatives using the EVAMIX method ... 85
Table 17: Aggregation Ranking Results ... 86
Table 18: Cost and Benefit Summary ... 102
Table 19: Monetised and non-monetised impacts of HS2 ... 102
15
16
1 INRODUCTION
1.1 Background to Study
There is a need for affordable, reliable, and safe public transport in South Africa. In Cape Town, the most popular modes of public transport are rail, bus, Bus Rapid Transit (BRT) and minibus taxis. At this stage, the various modes are not integrated and, in some instances, are running in parallel.
A significant portion of research papers have focused on comparing the capital costs and benefits of public transport investments and the results often exclude the effects of criteria that are not easily monetised. In South Africa, the Cost-Benefit Analysis (CBA) is often used to evaluate public transport projects, whereas, in this research, Multi-Criteria Decision Analysis (MCDA) methods are investigated and used. The main objective of this research was to investigate and evaluate the MCDA methods available and establish it as an alternative or supplementary method for the currently used methods in the City of Cape Town, that public transport planners could use when evaluating public transport projects.
The costs often associated with cost-benefit analyses include capital costs, construction time, operation, maintenance costs, as well as other costs and processes, up to and including decommission. The benefits are usually measured in travel time savings and safety (reduction of crashes).
While multi-criteria decision analyses often have ‘cost’ as a heavily weighted criteria, other non-monetised criteria are considered, such as accessibility, reliability, safety, travel time, environmental effects, etc. The lesser researched effects of public transport, such as the effect of property prices and job creation can be evaluated using a multi-criteria decision analysis should the project lend itself to that.
1.2 Problems to be Investigated
In order to test the MCDA methods, Cape Town’s existing public transport was used as a case study. In addition to the four existing modes running exclusively, a theoretical fifth mode was included, which considers the integration of the existing public transport modes.
Therefore, the five scenarios analysed are:
1. Rail (MetroRail), 2. Bus (Golden Arrow), 3. BRT (MyCiTi), 4. Minibus Taxis, and
5. Integrated Public Transport System (theoretical).
The criteria included in this investigation (in no particular order):
1. Cost,
2. Land-Use and Integration,
17 3. Affordability for Users,
4. Accessibility, 5. Estimated Speed,
6. Convenience & Reliability, 7. Environmental Effects, and 8. Safety & Security.
1.3 Purposes of the Investigation
“Good public transport systems are 'purchasing' urban economic efficiency, not just transport efficiency” (Marsay, 2017).
Currently, there is little research to be found which compares different methods of multi-criteria decision analyses for various modes of public transport. Especially, in Cape Town where the public transport landscape and the geographical layout of the city differs to other cities around the world. The purpose of this investigation was to provide an analysis tool to assist transport planners working on bettering the existing public transport, as well as assessing the efficiency of proposed public transport projects before introducing new modes/upgrading the existing modes available.
This research aimed to establish which method of analysis and mode (or combination of modes) of public transport provided the highest levels of service and positive effects for the lowest overall costs. The research also aimed to provide a simple guide to the use of multi-criteria decision methods in public transport planning including the strengths and weaknesses of the multi-criteria decision methods available.
1.3.1 Research Questions
1. What are the most common methods of MCDA currently being used for public transport evaluation?
2. How did the opinion of the general public differ from that of engineers and government employees regarding the importance of criteria?
3. How do the results differ between methods of MCDA?
4. How do the results differ for different levels of aggregation?
5. What time period should be evaluated in the implementation of public transport projects?
1.4 Major Assumptions Made
Various authorities were contacted in order to obtain the overall costs involved in public transport. However, certain assumptions regarding cost were made as detailed costs were not generally available across the existing public transport modes in Cape Town. As will be discussed, the existing public transport modes are operated and controlled by different authorities and each authority has a different approach to calculating and presenting their costs.
18
Scenario 5: Integrated Public Transport System was, as mentioned, theoretical and therefore, in order to evaluate it without entering into detailed design, a number of assumptions were made and are listed further below.
In order to evaluate each mode of public transport in Cape Town in each scenario evaluated; it was assumed that the subject mode of public transport was the main mode. This assisted in the evaluation of the efficiency of the mode, regardless of its competitors. Assumptions were also made in order to estimate the capture area around each mode’s station. This is discussed further in Section 2: Methodology.
1.5 Structure of the Thesis
The thesis begins with Chapter 2: Methodology, outlining the research process of both the evaluation methods used (Section 2.1 and 2.2), as well as other key literature surrounding the evaluation of public transport projects (Section 2.3). The methodology also outlines the scenarios which were evaluated (Section 2.4 to 2.6).
Chapter 3: Literature Review follows the methodology. The literature review covers the different evaluation methods (Cost-Benefit Analysis and Multi-Criteria Decision Methods) that could be applied to public transport decision making specifically, as well as which methods of multi-criteria analyses were used in this case study (Section 3.1). The literature review covers methods in which the criteria associated with public transport projects, could be quantified and evaluated. The literature review also outlines the criteria most frequently used in public transport project evaluation (Section 3.2). And finally, the review touches on the direct and indirect costs and benefits often associated with different forms of public transport (Section 3.3).
Thereafter, Cape Town as a case study was investigated in Chapter 4: Case Study. The analysis was performed using the different methods of multi-criteria analyses discussed (Section 4.1 to 4.4).
In Chapter 5: Analysis and Results, five scenarios were evaluated using the identified methods, both weighted using weights obtained through stakeholders and unweighted assuming each criterion were of equal priority. Thereafter, the results are discussed in Chapter 6: Discussion.
Finally, the conclusions are listed, and recommendations made for further research in Chapter 7: Conclusions & Recommendations.
19
2 METHODOLOGY
In this chapter, qualitative methods were focused on, incorporating quantitative methods, in order to gain in-depth insight into public transport management and operations, as well as the costs and benefits involved, both direct and indirect.
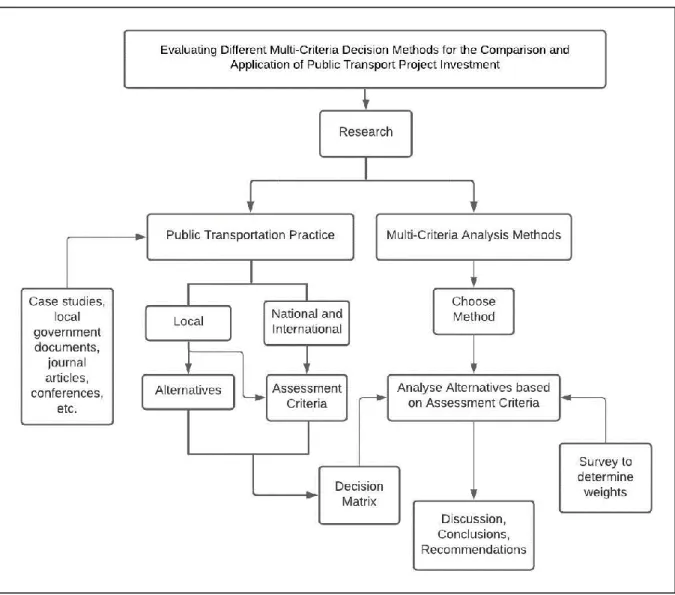
Figure 1 shows the method followed in this research. Each step is discussed further below.
Figure 1: Methodology Flow Chart
2.1 Research Procedure
As shown in Figure 1, research on public transport practice, locally, nationally, and internationally was performed. From this, the alternatives for the case study, as well as the assessment criteria, were established. The research also included multi-criteria analysis methods, ultimately leading to the method chosen for the analysis. Along with the alternatives and assessment criteria previously mentioned, the analysis was performed.
20 2.1.1 Sources of information
2.1.1.1 City of Cape Town and Western Cape Government
The City of Cape Town (CoCT) and Western Cape Government (WCG) were contacted for information regarding their funding and role in operations of public transport in Cape Town.
Official CoCT and WCG documents and statements were investigated to establish the priorities placed on the different criteria available for evaluating public transport. This was done by establishing patterns and trends within the statements to determine where emphasis was placed regarding public transport in Cape Town. The CoCT was also contacted for information regarding the CBA performed before implementing their BRT service, known as the MyCiTi.
2.1.1.2 Transport Conferences and Research Associations
The South African Transport Conferences (SATC) was used for information regarding transport and public transport in South Africa. Conference papers and other related documents are available from the year 2000 onwards which equates to more than 1 500 articles and presentations. The investigation focused on the documents related to public transport and network planning.
Similarly, other relevant international transport conferences were referred to, in order to gain insight into usage patterns in other cities with different demographics and different public transport systems. The International Association of Public Transport (UITP) was used in order to gain knowledge relating to the use of public transport internationally.
The World Resources Institute contains a wide range of information relating to public transport, as well as public transport operations, management and legislation involved. The knowledge gained from The World Resources Institute assisted with obtaining sources with research into the costs and politics associated with public transport.
2.1.1.3 Industry
Civil and transport engineering companies who have worked on public transport projects were contacted. HHO Consulting Engineers (Pty) Ltd and SMEC South Africa have both, been involved in the design and construction of the MyCiTi bus service. These companies would have access to design criteria, construction time, construction cost, design cost, and other traffic analyses. The individual modes of public transport were investigated by contacting each industry, such as Golden Arrow Buses, Metrorail, South African National Taxi Council (SANTACO) and MyCiTi.
2.1.1.4 Other sources
Other sources include publicly accessible data, such as the National Household Travel Survey, other research papers and dissertations accessible both online and through the University of Cape Town’s library.
21
2.2 Multi-Criteria Decision Analysis Methods
2.2.1 Analyses Methods
A multitude of analysis methods are available for comparative project evaluation, however, evaluation methods commonly used in public transport appraisal was focused on – both internationally and locally. The two common methods used in public transport appraisal are, cost-benefit analyses and multi-criteria decision analyses. However, within both methods there exists a variety of ways for them to be implemented, with the possibility of each of them yielding different outcomes.
Once an evaluation method has been established, the evaluation perspective needs to be established. In public transport project evaluation, projects are often evaluated from the perspective of the government, the operators, the users, or other investors who often have opposing viewpoints. This affects the weighting of the criteria, which is discussed further on.
Therefore, an emphasis was placed on the choice and justification of the analysis methods used, as well as the perspectives included.
2.3 Scenarios Analysed
Once the evaluation methods have been established. The following five scenarios in Cape Town were analysed.
1. Existing Rail (MetroRail) 2. Existing Bus (Golden Arrow), 3. Existing BRT (MyCiTi), 4. Existing Minibus Taxis, and
5. Theoretical Integrated Public Transport System.
Each scenario was evaluated with the assumption that the subject public transport mode being evaluated is the primary mode of public transport available as it currently stands, aside from Scenario 5, which was theoretical. The services would not run in parallel.
However, it has been acknowledged that other assumptions were made in order to build a realistic scenario. These assumptions include the catchment area, the mode used to reach the station, as well as any additional infrastructure that was necessary in order to cover the case study area, i.e., the City of Cape Town. Reasonable figures (walking time, parking locations, secondary modes, etc.) were researched as part of the literature review and study.
2.4 Criteria and Weighting Used
In each scenario, the public transport mode was evaluated based on the criteria deemed most important in South Africa. A general list of criteria often used in public transport appraisal is as follows (in no particular order):
Costs including:
• Capital Cost,
22
• Operational Cost,
• Maintenance Cost, and
• Decommission Cost.
Levels of service:
• Travel Time,
• Volume of passengers transported,
• Comfort and Convenience,
• Safety,
• Security,
• Reliability
• Cost to passenger, and
• Accessibility.
As well as other factors affected:
• Environmental effects,
• Employment created,
• Construction Time,
• Land-Use and non-motorised transport (NMT) integration and,
• Effect on property prices.
However, as will be discussed, research shows that not all criteria can be considered in a multi- criteria decision analysis as it leads to inconsistent results. In order to filter out the criteria with a higher priority; articles, documents, and statements from the CoCT and WCG were consulted.
Three alternative weighting viewpoints were analysed.
1. UNWEIGHTED: The academic (unbiased) viewpoint, where each criterion will be equally weighted to determine the effect of weighting on the results, and
2. WEIGHTEDs: The specialist viewpoint, where each criterion will be weighted by key players in the public transport discipline – this includes civil and transport engineers in industry, Western Cape Government and City of Cape Town employees working in their respective transport departments, academics working in traffic and transportation planning, as well as a number of experts outside of traffic engineering, such as environmental practitioners and network planners.
3. WEIGHTEDp: The general public viewpoint from people who have used public transport in Cape Town.
2.5 Case Study Evaluation, Results and Analyses
The following evaluations were performed: two different evaluation analyses methods performed on the five listed scenarios. While using the determined criteria, from both the academic (unbiased), specialist and public weighting viewpoints for Cape Town public
23
transport services. Thereafter, the results were aggregated in order to determine one result and to compare it to the individual results obtained.
24
3 LITERATURE REVIEW
This investigation involved optimising the method in which public transport projects are being evaluated by establishing a multi-criteria analyses method which is reliable, simple, and capable of including a variety of criteria, both monetary, qualitative, and quantitative.
Therefore, the literature review intended to document and summarise the existing literature that would contribute to the topic.
At this stage, the investigation is broad and, therefore, the literature review covers a wide area of topics surrounding evaluation methods, (i.e. Cost-Benefit Analysis and Multi-Criteria Decision Analysis methods), the costs and benefits of public transport, based on the factors previously mentioned, namely, Costs (capital, operational, maintenance, decommissioning and construction time), Levels of Service (travel time, volume of passengers transported, convenience, reliability, safety, security, cost to passenger and accessibility), as well as other factors affected, such as employment creation, environmental effects and the effect on property prices.
3.1 Evaluation Methods
A variety of comparative evaluation methods exist. Within this, the popular methods for public transport appraisal are Cost-Benefit Analysis and a variety of Multi-Criteria Decision Analysis methods. The following research will identify the different methods commonly used, as well as the strengths and weaknesses discovered.
3.1.1 Cost-Benefit Analysis Method
Cost-Benefit Analysis (CBA) also known as Benefit-Cost Analysis (BCA) is the most used evaluation method for assessing infrastructural investments. In the transport field, it is the basic tool in most countries (Beria et al., 2012). As an example, The Transportation Investments Generating Economic Recovery (TIGER) Discretionary Grants (United States) require that proposers submit a CBA along with a project proposal. (Kentucky Transportation Center, 2016) Key questions a CBA can help address are (Lawrence et al., 2014 as cited in Kentucky Transportation Center, 2016):
1. Should a project be undertaken?
2. When should a project be undertaken?
3. Which projects and/or project alternatives should be funded?
4. Evaluation of project performance
The CBA is based on the monetisation and inter-temporal discount. Money is the measure unit used as common numeracy to translate all costs and benefits associated to an investment or a policy. Once all relevant effects of an investment are quantified, the concept of inter-temporal discount is used to translate future costs and benefits to present day by means of a social discount rate. In this way, the future can be compared with the present (Beria et al., 2012).
25
CBA weighs the pros and cons of a project or policy in a rational and systematic process. It inherently requires the creation and evaluation of at least two options, “do it or not”, plus it requires an evaluation at several different scales (nothing, minimum and all, as the least requirements) (OECD, 2006; EC, 2008; Ninan, 2008 as cited in Jones et al., 2014).
CBA monetises both inputs and outputs and explicitly states economic assumptions so that they are not overlooked or remain implicit (World Bank, 2004 as cited in Jones, Moura, &
Domingos, 2014), including externalities, thus integrating economic and environmental considerations into decision making (Beder, 2000 as cited in Jones, Moura, & Domingos, 2014). It also includes the accounting of time through the use of discount rate (Ninan, 2008;
Munger, 2000 as cited in Jones, Moura, & Domingos, 2014). Essentially it seeks to enumerate all direct costs and benefits to society of a particular project, assign monetary values, discount them to a net present value and add them to a single number to evaluate the project (Nicke, et al., 2009 as cited in Jones et al., 2014).
Costs generally associated with a cost-benefit analysis include those related to construction and future maintenance, such as capital, major rehabilitation and annual maintenance costs over the life-cycle of the project. Other considerations include discounting of future costs and benefits, dealing with opportunity costs, inflation, avoidance of double counting, avoidance of sunk costs, dealing with joint costs and dealing with the sensitivity analysis (Kentucky Transportation Center, 2016).
The general approach to conducting a CBA is shown below (Guo et al., 2008 as cited in (Kentucky Transportation Center, 2016):
1. Define the base case and the options, 2. Identify the scope of the CBA,
3. Identify investment impacts within the scope,
4. Measure the impacts and convert them into monetary values, 5. Calculate the net present value for the options proposed, 6. Conduct sensitivity and/or risk analyses, and
7. Make funding decisions based on the information gathered.
The net present value is calculated using the following equations (Kentucky Transportation Center, 2016):
𝑃𝑉 = 𝐵𝑛
(1+𝑑)(𝑛−𝑜) (1)
Where: PV = present value B = benefit (cost)
N = year benefit (cost) is incurred
o = year to which discounting is occurring d = discount rate
26 Thereafter,
𝑁𝑃𝑉 = ∑ 𝑃𝑉𝑏− 𝑃𝑉𝑐 (2)
Where: 𝑃𝑉𝑏 = present value of benefits 𝑃𝑉𝑐 = present value of costs
If the benefits are greater than costs, the NPV is positive. This would suggest a project may be worth investigating further. When project alternatives are being compared, the project with the highest NPV is generally further investigated. However, it should be mentioned that the NPV favours large projects (Bruun & Vanderschuren, 2017), which is not necessarely in the best interest of society at large.
In some cases, the benefit-cost ratio (BCR) is also used. It is applicable if there are funding issues that need to be considered. To calculate BCR, the benefits are discounted in the numerator and the agency investment cost discounted in the denominator. See the equation below:
𝐵𝐶𝑅 = ∑ 𝑃𝑉∑ 𝑃𝑉𝑏
𝑐 (3)
If multiple alternatives are being considered, the Incremental Benefit-Cost Ratio (IBCR) can be used. The IBCR compares the change in present value between two alternatives. Alternatives are arranged from least to most expensive and the first round it only compares the first options which are termed the defender and challenger with the challenger being the more expensive alternative. The equation contrasting the projects is shown below:
𝐼𝐵𝐶𝑅 = ∑ 𝑃𝑉∑ 𝑃𝑉𝑏,𝑑− ∑ 𝑃𝑉𝑏,𝑓
𝑐,𝑑− ∑ 𝑃𝑉𝑐,𝑓 (4)
Where: IBCR = Incremental Benefit-Cost Ratio 𝑃𝑉𝑏,𝑑 = present value of defender benefits 𝑃𝑉𝑏,𝑓 = present value of challenger benefits 𝑃𝑉𝑐,𝑑 = present value of defender costs 𝑃𝑉𝑐,𝑓 = present value of challenger costs
If the IBCR is greater than or equal to 1.0, it means the benefits of the challenger are equal to or greater than its increase in costs. If this is the case, the current challenger becomes the defender to be compared to the next project. If the IBCR is less than 1.0, the current defender is retained and the new challenger is the next alternative on the project list. This continues until all alternatives have been evaluated and the last defender is considered the most economically efficient.
In certain cases, the Internal Rate of Return (IRR) is included in the analysis. IRR is the discount rate that results in the net present value of project cash flow equal to zero, and projects with a high IRR are considered to have greater value. Other factors which are sometimes included are
27
Payback Period, the amount of time required for the cumulative benefits to equal the cumulative costs (both discounted to present value) and lastly, Cost Effectiveness which compares discounted benefits of alternative projects with the assumption of budgetary constraints (Kentucky Transportation Center, 2016) .
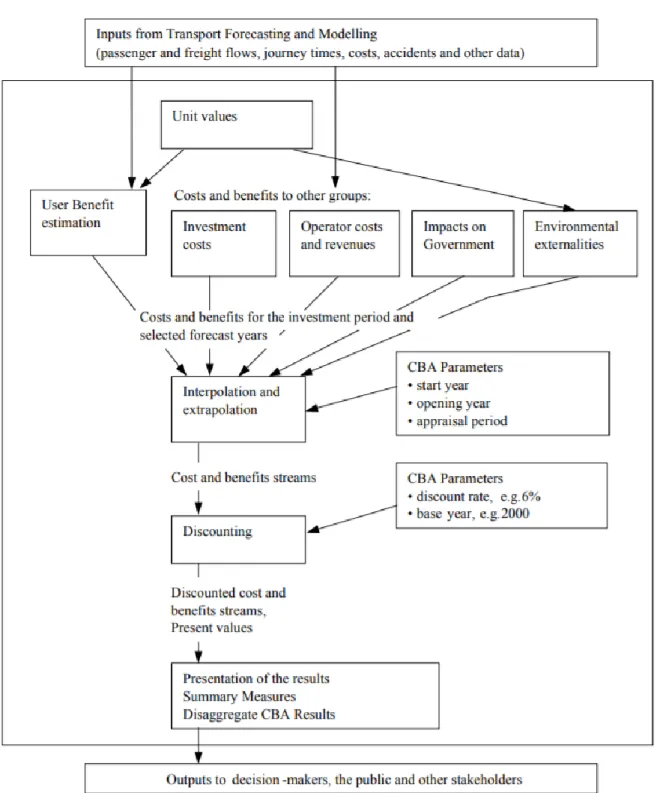
The general method is shown graphically, in Figure 2.
The limitations often associated with CBA includes omitting costs or key benefits, as well as measuring factors like travel time savings and safety imporvements, which are not easily
Figure 2: Cost-Benefit Analysis Method in Transportation Source: Mackie, 2010
28
monetised (Kentucky Transportation Center, 2016). Traditional CBA also ignores the distribution effects of such decisions, such as how they affect different regions and/or social groups. (Lucas, et al., 2015)
The other weaknesses of CBA are shown in Table 1 below.
Table 1: Major Weaknesses of CBA (Source: (Jones et al., 2013)
Factor Weakness Sources
Traffic Forecast Commonly off by 20%- 60% (usually
overestimated).
Skamris & Flyvbjerg, 1997; Flyvbjerg, Bruzelius, & Rothengatter, 2003;
Flyvbjerg, 2005; World Bank, 2005a; Mayer
& McGoey-Smith, 2006; van Wee,
2007; Salling & Banister, 2009; Rasouli &
Timmermans, 2012 Cost Estimation Overruns of 50%-100%
are not uncommon (usually
underestimated).
Skamris & Flyvbjerg, 1997; Flyvbjerg, Bruzelius, & Rothengatter, 2003, Flyvbjerg, Skamris Holm, & Buhl, 2004; Flyvbjerg, 2005; Mayer & McGoey-Smith, 2006;
van Wee, 2007; Salling & Banister, 2009;
Rasouli & Timmermans, 2012 Discount Rate Impossible to forecast
long-term. Higher rates favor smaller
investment or short term benefits.
Farber & Hemmersbaugh, 1993; Weitzman, 1994; Weitzman, 1998; Weitzman, 2001;
Florio & Vignetti, 2003; RAILPAG, 2005;
Florio, 2006a; Florio, 2006b; EC, 2006 Value of Life Hard to Determine, no
agreement on method or value.
Farber & Hemmersbaugh, 1993; Hanley &
Spash, 1993; Gerrod & Willis, 1999;
Miller, 2000; Dubgaard, Kallesoe, Petersen, and Ladenburg, 2002; Mrozek &
Taylor, 2002; Quinet & Vickerman, 2004; de Blaeij, Florax, Rietveld, & Verhoef,
2007; Bellavance, Dionne, & Lebeau, 2007;
Trottenberg & Rivkin, 2011 Value of Time Complex procedure, no
consensus on which variables are relebant and relationships among values.
Bristow & Nellthorp, 2000; Grant-Muller, Mackie, Nellthorp, & Pearman, 2001;
World Bank, 2005 Regional
Impacts
Does not account for network or crowding out effects.
Rietveld, 1989; EC, 1997; Banister &
Berechman, 2000; Sieber, 2001; Vickerman, 2007; Flyvbjerg, Bruzelius, & Rothengatter, 2003, Mairate & Angelini, 2006; Banister, 2007; Coto-Millan, Inglada, & Rey, 2007;
van Wee, 2007; ITF, 2011 Local Impacts Does not account for
agglomeration and land use interaction.
Chintz, 1961; van Wee, 2007; Banister, 2007;
Martinez, 2010
29 Equity Not included in CBA.
Monetization not universally accepted.
Mera, 1967; Hewings, 1978; Richardson, 1979; Bateman, Turner, & Bateman,
1993; Masser, Sviden, & Wegener, 1993; de Silva & Tatam, 1996; Banister &
Berechman, 2000; Beder, 2000; Bristow &
Nellthorp, 2000; Feitelson, 2002;
Persky, 2001; Heinzerling & Ackerman, 2002; Annema Koopmans, & van Wee, 2007; Ninan, 2008; Thomopoulos, Grant- Muller, & Tight, 2009; Shi & Wu 2010, Martens, 2011
Environmental Impacts
Difficult to monetize with large uncertainty ranges. LCA is not performed, thus not accounting for impacts from the cosntruction and maintenance of infrastructure.
Culhane, 1987; Buckley, 1991; Button, 1994;
EC, 1995; Wood, Dipper, & Jones,
2000; Banister & Berechman 2000; Niemeyer
& Spash, 2001; Heinzerling &
Ackerman, 2002; Gijsen & van der Brink, 2002; Flyvbjerg, Bruzelius, & Rothengatter, 2003, van Wee, van der Brink, & Nijland, 2003; Laird, Nellthorp, & Mackie, 2005;
Chester & Horvath, 2007; van Wee, 2007 Residual Value Often overlooked. No
agreement on methodology.
Lee Jr., 2002; Florio & Vignetti, 2003;
RAILPAG, 2005; EC, 2006; IASB, 2006;
Edgerton, 2009; Matria, 2012
Examples of the use of CBA in transportation evaluation can be found in Section 9:
Appendices.
3.1.2 Multi-Criteria Decision Analysis Methods
Generally speaking, a multiple criteria decision problem is a scenario in which having defined a set of actions/solutions (Do nothing / Upgrade Rail / Additional buses etc.) and a consistent family of criteria (Cost / Accessibility / Safety etc.), the Decision Maker (DM) tends to determine the best subset of actions and solutions according to the criteria (choice problem), divide the solutions into subsets representing specific classes of solutions according to the concrete classification rules (sorting problem) or rank the actions and solutions from best to worst, according to the criteria (ranking problem) (Zak, 2010).
The generally followed process consists of:
1. Recognition of major stakeholders, 2. Analysis of stakeholders’ expectations, 3. Definition of criteria,
4. Generating actions / solution scenarios,
5. Evaluation of the scenarios (construction of the evaluation matrix), 6. Definition of stakeholders’ preference models,
7. Computational experiments – generation of two final rankings, and
8. Recommendation and final selection of the most satisfactory compromise solution.
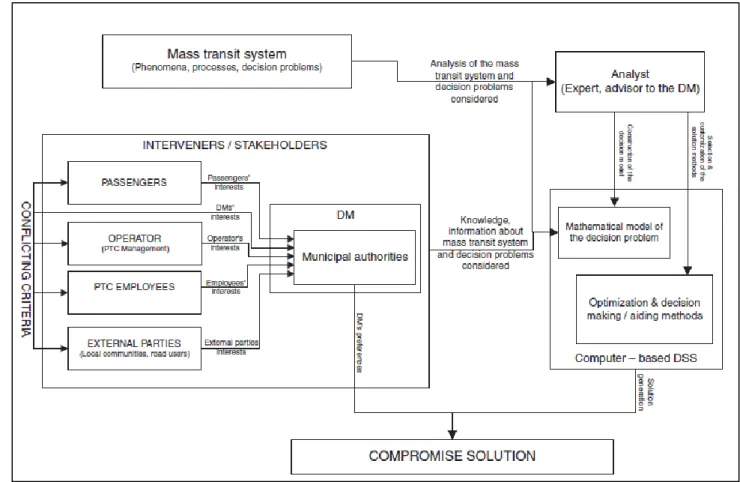
30 The above is shown graphically in Figure 3.
Figure 3: The universal scheme of the multi-criteria decision-making process in mass transit systems Source: Zak, 2010
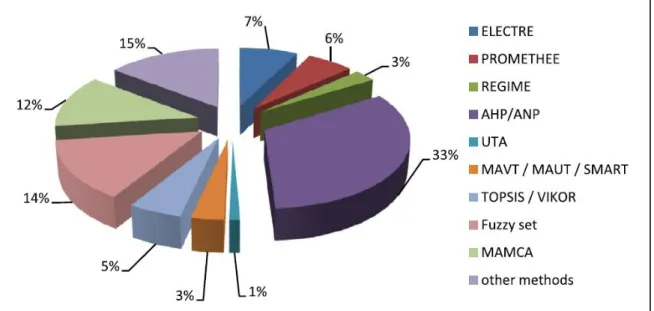
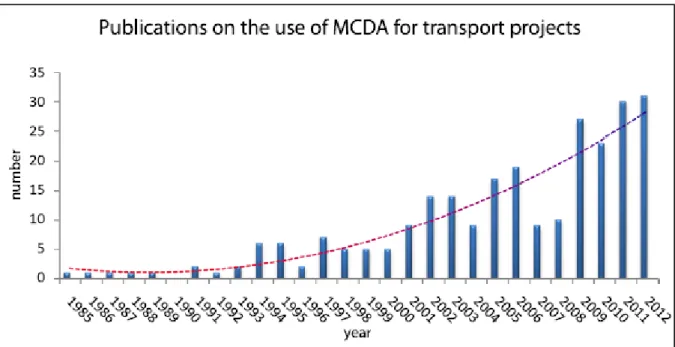
As previously mentioned, there are many MCDA methods available, Macharis & Bernardini (2015) performed an investigation to establish the most commonly used methods used for transport project analysis. The results are shown below.
Figure 4: MCDA methods used for transport projects (period: 1985-2012) Source: Macharis & Bernardini, 2015
31
As can be seen, the three most popular methods are AHP/ANP (Analytic Hierarchy/Network Process) – often used in combination with another method, such as the Evaluation of Mixed Data method (EVAMIX) – TOPSIS (Technique for Order of Preference by Similarity to Ideal Solution) and Fuzzy Set; often used as a part another method, such as the Simple Additive Weighting Method (SAW, also known as Weighted Sum).
The SAW method appeals to the school of thought of unified scores across alternatives, applying weighting and summing the result per alternative. The EVAMIX method appeals to the second school of thought, taking it one step further where after the unification of scores, the alternatives are compared pairwise (Vanderschuren & Frieslaar, 2008).
In order to compare the outcomes of different methods without the use of specialised software to increase method accessibility, SAW and EVAMIX methods were used in conjunction with the AHP method, therefore, appealing to both schools of thought.
3.1.2.1 The Analytical Hierarchy Process (AHP Method)
The AHP method, as developed by Saaty (1980) is a helpful tool for managing qualitative and quantitative criteria involved in decision-making. As stated in the name, it is based on a hierarchical structure (Taherdoost, 2017).
The AHP method also develops a linear additive model, but in its standard format, uses procedures for deriving weights and the scores achieved by alternatives which are based, respectively, on pair-wise comparisons between criteria and / or options (Department of Communities and Local Government, 2009). The fundamental input to the AHP method is the decision makers’ answers to a series of questions in the general form, ‘How important is criterion A relative to criterion B?’ These pair-wise comparisons can be used to establish the weights for criteria and the performance scores for the options on the different criteria (Department of Communities and Local Government, 2009).
A study by Wang and Yang (1998) on the theoretical validity, predictive and perceived performance of three multi-attribute weight measurement methods using: Saaty's AHP and Edward's Simple Multi-Attribute Rating Technique (SMART) compared to Anderson's Functional Measurement (FM) as a theoretical validity standard. The study found that AHP was perceived as an equally valid method to SMART and FM, but in terms of perceived performance, AHP is significantly preferred and perceived as easier to use (Macharis, et al., 2012).
The recommended steps in the AHP process are (Zietsman & Vanderschuren, 2014):
Step 1: Define the decision problem and goal.
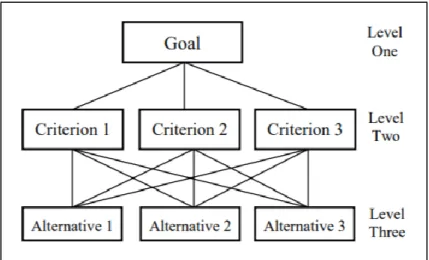
Step 2: Structure the hierarchy of the problem and potential solutions from goal to alternatives as shown in the figure below.
32
Figure 5: Simple Hierarchial Tree Source: Taherdoost, 2017
Step 3: Construct n x n matrices of pairwise comparison for each element by using the relative scale of importance.
The relative scale of importance is based on Saaty’s scale to compare the relative importance of two alternatives. These judgements are then converted into a numerical weight, allowing a local priority in the interval (0,1) to be associated with each criterion (Zietsman &
Vanderschuren, 2014). The table below indicates Saaty’s nine-point subjective judgement scale.
Table 2: Responses of relative importance based on Saaty's nine-point scale (Source: Berritella et al., 2009)
Preference Index Assigned
How important is A relative to B Explanation
1 Equally Important Two criteria contribute equally to the objective.
3 Moderately more important Experience and judgement slightly favour one criterion over the other.
5 Strongly more important Experience and judgement strongly favour one criterion over the other.
7 Very strongly more important
A criterion is strongly favoured over the other (its dominance may even be demonstrated in practice).
9 Overwhelmingly more important
The evidence favouring one criterion over the other is the highest possible order of affirmation.
2, 4, 6 and 8 are intermediate values that can be used to represent shades of judgement between the five basic assessments.
If B is judged to be more important than A, the reciprocal relevant index is assigned. That is to say, if B is judged to be x more important than A, the value of 1/x would be assigned to A relative to B.
33
Step 4: Compute the eigenvalue and henceforth, the relative weights of the criteria. Berrittella et al. (2009) explained the step as follows:
• A judgement matrix is used for prioritising the elements:
𝐴 = 𝑎𝑖𝑗[
𝑎11 𝑎12 … 𝑎1𝑛 𝑎21 𝑎22 … 𝑎2𝑛
⋮ ⋮ ⋱ ⋮ 𝑎𝑛1 , … 𝑎𝑛𝑛
] (1)
Where 𝑎𝑖𝑗 represents the pairwise comparison rating between element i and element j with respect to a higher hierarchical level.
• The priorities of the elements can be estimated by finding the principal eigenvector w of the matrix A.
𝐴 𝑥 𝑤 = 𝜆𝑚𝑎𝑥𝑤 (2)
Where 𝜆𝑚𝑎𝑥 is the largest eigenvalue of the matrix A.
• Once the local priorities are determined, the final priorities of the alternatives are determined using:
𝑆𝑖 = 𝑤𝑖𝑠𝑖1+ 𝑤𝑖2𝑠𝑖2+ ⋯ + 𝑤𝑖𝑠𝑖𝑛 = ∑ 𝑤𝑖𝑠𝑖𝑗
𝑛 𝑖=1
(3)
Where 𝑤𝑖 is the local priority of element i and sij is the priority with respect to the objective.
Step 5: Conduct the consistency analysis
• The AHP method allows inconsistency in judgment and, consequently provides a method to measure the inconsistency in each set of judgments. This is determined by the Consistency Ratio (CR), defined as (Berrittella, et al., 2009):
𝐶𝑅 = 𝐶𝐼
𝑅𝐼 (4)
Where,
Consistency Index = CI = 𝐶𝐼 = 𝜆𝑚𝑎𝑥−𝑛
𝑛−1 (5)
34
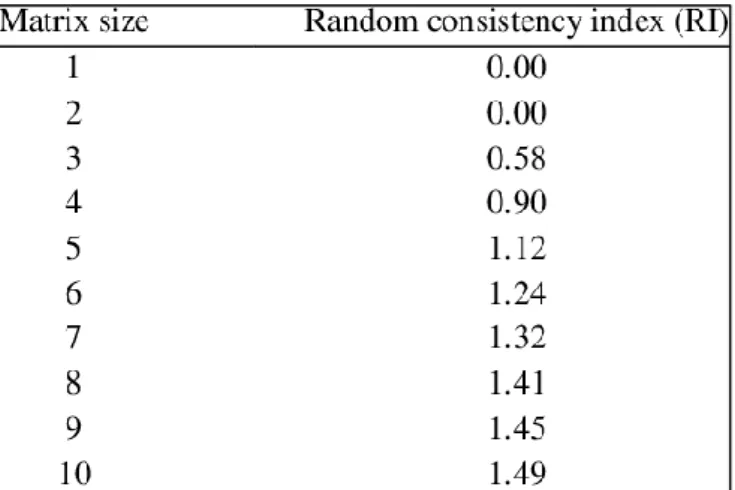
And RI = Random Consistency Index as shown below:
Generally, CR of less than 10% is considered acceptable. Values higher than this warrant judgements (Chu & Kuang-Han Liu, 2001). However, it should be noted that studies have mentioned that the ruling is too absolute, and results should be
considered case-by-case (Alonso & Lamata, 2005).
An example of the AHP method being used in transportation evaluation can be found in Section 9: Appendices.
3.1.2.2 Simple Additive Weighting (SAW) Method
The SAW method, also known as weighted linear combination, weighted summation or scoring methods is a simple and is an often used multi attribute decision technique.
The SAW method is widely used, due to its simplicity (Zanakis, 1998 as cited in Keyvan &
Cats, 2015). To make all the ratings comparable, the normalisation of the decision matrix is required.
The method is based on the weighted average. An evaluation score is calculated for each alternative by multiplying the scaled value given to the alternative of that attribute with the weights of relative importance directly assigned by the decision maker, followed by summing of the products for all criteria. The advantage of the method is that it is a proportional linear transformation of the raw data which means the relative order of magnitude of the standardised scores remains equal (Afshari et al., 2010).
The method, as described by Afshari, Mojahed, & Yusuff (2010), is:
Step 1: Implement the AHP method as described above, in order to determine the criteria weights.
Step 2: Construct a decision matrix (m x n) that includes m alternatives and n criteria. Calculate the normalised decision matrix for positive criteria:
𝑛𝑖𝑗 = 𝑟𝑖𝑗
𝑟∗𝑗 𝑖 = 1, … 𝑚, 𝑗 = 1, … 𝑛 (6)
Figure 6: Random Consistency Index (Source: Saaty, 1980)
35 And for negative criteria:
𝑛𝑖𝑗 =𝑟𝑚𝑖𝑛𝑗
𝑟𝑖𝑗 𝑖 = 1, … 𝑚, 𝑗 = 1, … 𝑛 (7)
Where, 𝑟 ∗𝑗 is a maximum number of r in the column of j.
Step 3:
Evaluate each alternative, 𝐴𝑖, using the following formula:
𝐴𝑖 = ∑ 𝑤𝑗∙𝑥𝑖𝑗 (8)
Where 𝑥𝑖𝑗 is the score of the ith alternative with respect to the jth criteria and 𝑤𝑗 is the weight of the criteria.
The larger the 𝐴𝑖 value, the more preferable the alternative.
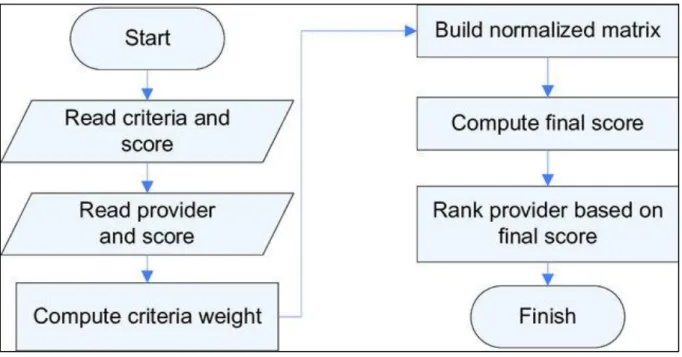
The method described above, is summarised in the Figure below.
Figure 7: SAW Flowchart
Source: Ciptayani, P & Dewi, K, 2017
3.1.2.3 The Evaluation of Mixed Data (EVAMIX) method
The EVAMIX method was first introduced by Voogd (1982, 1983) and developed by Nijkamp et al. (1990), Martel and Matarazzo (2005) cited in Tuş Işık & Aytaç Adalı, (2016).
A key component of the method is that it includes and combines both ordinal and cardinal, beneficial and non-beneficial data within the same evaluation matrix, hence the name. The