Peter Dovey and the entire staff of the SAES for the diversified help during field and laboratory work. In this study, evaluation of flux components in the understorey of the hood was carried out using plastic microlysimeters.
Fig.6.4(a) Variation in microlysimeter soil evaporation with wind speed and soil water content measured with a ML 1 Thetal'robe;b) Typical diurnal trends of R,et and R, on Day 175,2000. Soil evaporation measurements were. Fig.6.14 Variation of mean air temperature, canopy temperature and differential temperatures with wind speed trends for DOY 162 to 173, 2000.
LIST OF TABLES
LIST OF APPENDICES
1 Introduction
- Introduction 2
- Introduction 3
- Research objectives
- Introduction 4
- Radiation interception and Plant growth responses 8
- Radiation interception and Plant growth responses 12
- Seasonal root growth rates
- Irradiance levels and EH intervals
- Radiation Interception and Plant Growth Responses 19
- Crop water use
- Radiation Interception and Plant Growth Responses 20
- Energy and Water Balance Dynamics
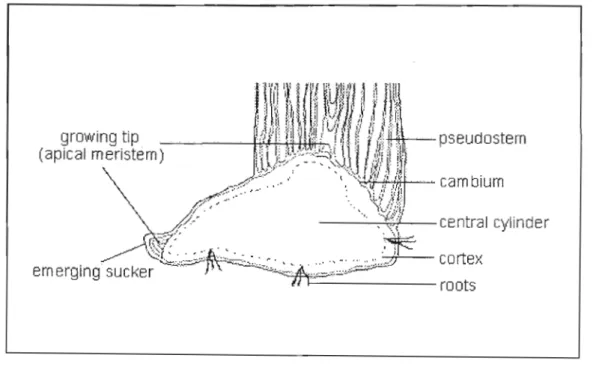
In practice, descriptions of the canopy structure are based on a few parameters. The leaf area per soil area (Leaf Area Index, LA!) is the most widely used parameter, as it has been shown to be associated with key ecosystem processes (Francisco et al. .,2000).In ratoon crops, the LA. Within the subtropical regions, the banana cultivar 'DwarfCavendish' has historically been considered the most adapted to extremes of climate. The biggest disadvantage of the short cultivar is "smuggle throat".
3 Energy and Water Balance Dynamics
- Energy and Water Balance Dynamics 26
- Materials and Methods 29
- Materials and Methods 30
- LAI-2000 plant canopy analyser
- Microclimatic measurements
- Materials and Methods 32
- Materials and Methods 33
- Net radiometer, IRT and Propeller anemometer .1 Net radiometer
- Materials and Methods 34
- Apogee infrared thermometer
- Three dimensional propeller anemometer
- Materials and Methods 37
- ThetaProbe
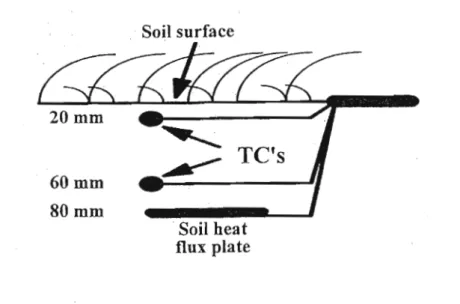
- Microlysimeter measurements
- Introduction
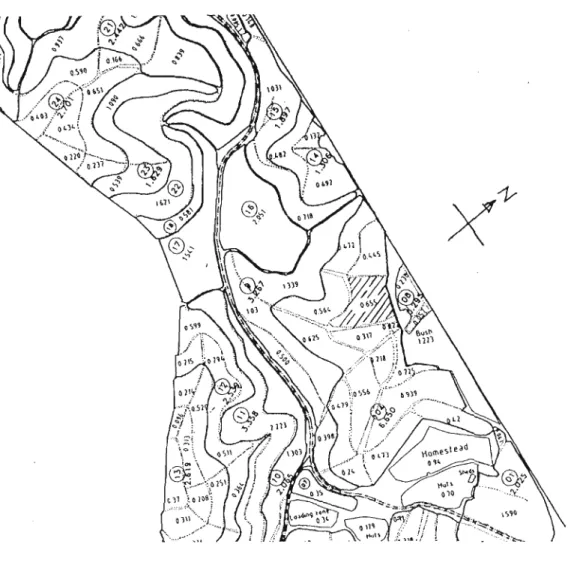
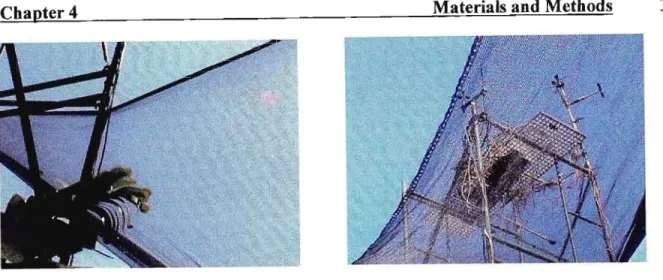
Fig.4.3 A top view of a partial part of the Inselele farm. The shaded part is the test location. The relative energy received by the IRT detector depends on the sensor's field of view (FOY). The FOY is 500 for a full angle with 90% of target. A wide FO V integrates a larger target area than a narrow FO V. The distance between the IRT and the object dramatically affects the size of the viewed area.
CHAPTERS
S Soil and Soil Water Characteristics
- Soil and Soil Water Characteristics 44
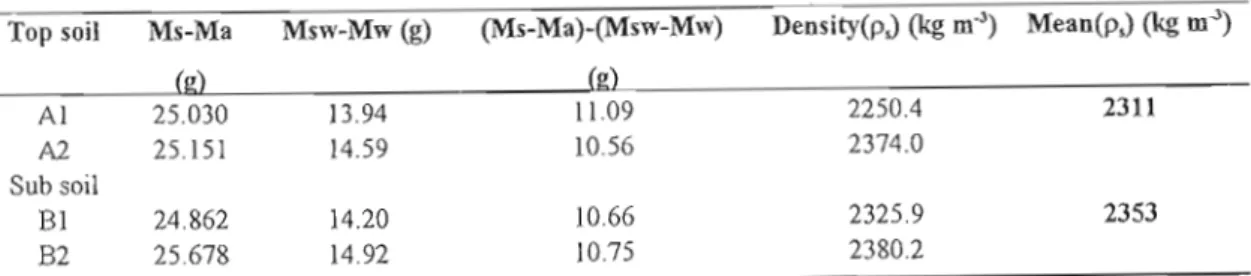
- Det ermination of soil bulk density
- Soil and Soil Water Characteristics 46
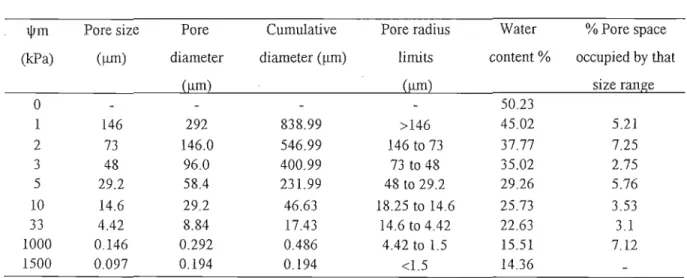
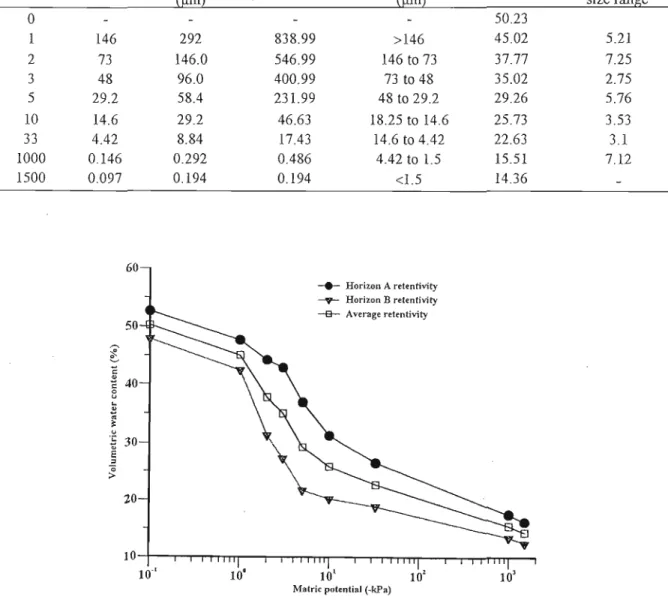
- Soil water retentivity characteristics
- Soil and Soil Water Characteristics 47
- Soil and Soil Water Characteristics 49
- Soil and Soil Water Characteristics 50
- Microclimatic Variations and Solar Radiation Dynamics
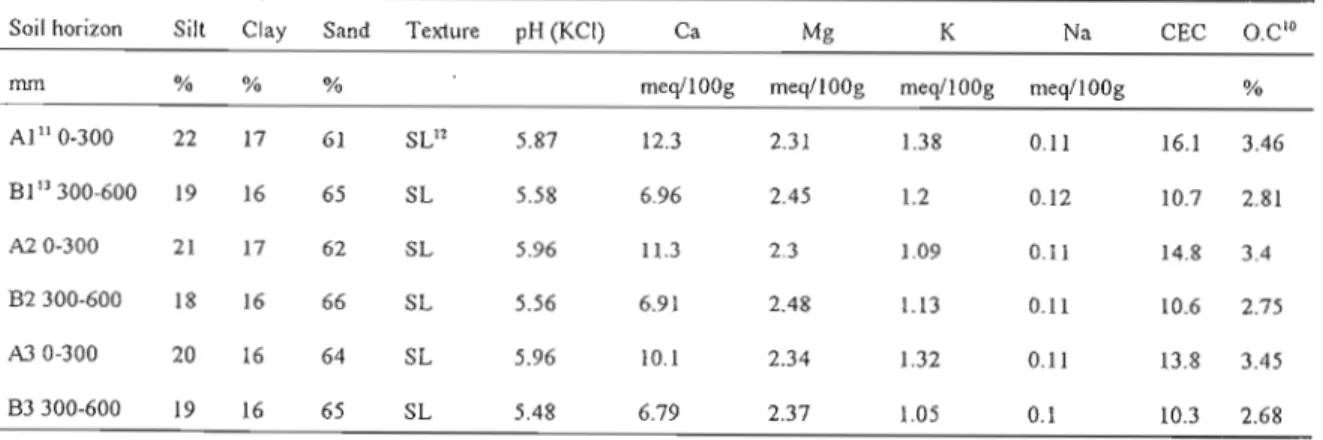
Perhaps a better method of characterizing soil texture is to show the continuous distribution of particle sizes. From the data obtained (Table 5.1) and according to the definition of the texture class (Fig. 5.1), horizon A is classified as a sandy clay. the soil consists mainly of sandy particles and can be considered a relatively light soil. This provides vital information for describing soil water relations. The characteristics of the curve are affected by texture, structure and degree of compaction as these factors affect the pore size distribution and surface area of the soil. The average value of Pb for cores 1 and 2 was found to be 1400 kg m". The bulk dry density of Pb was less than the density of p particles; Hillel (1998) reported that for a soil in which pores constitute half of the volume, half of p; In comparison with experimental findings, a bulk density of 1400 kg m" is close to half the determined particle density of 2311 kgm", in sandy soils, Pb can be up to 1600 kg m", while in accumulated soils and clay the soil can be up to 1100 kg m? (Hillel, 1998). Since soil (A) was classified as sandy soil, these findings are consistent with the experimental results.
CHAPTER SIX
6 Microclimatic Variations, Solar Radiation Dynamics and Soil Evaporation Measurements
Introduction
Microclimatic Variations and Solar Radiation Dynamics 53
Microclimatic Variations and Solar Radiation Dynamics 54
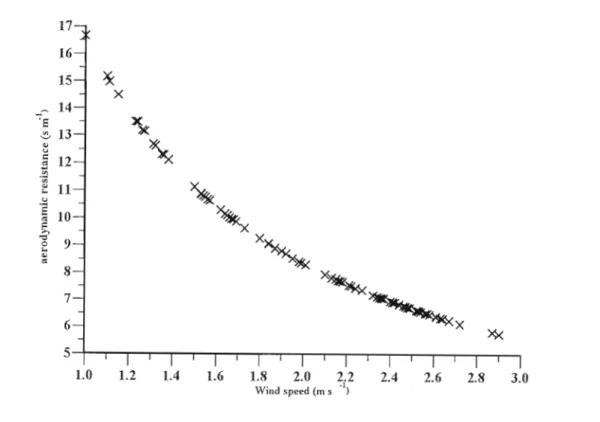
6.2, which is consistent with Savage, (1998b). In summary, it is relatively small if the crop is well watered and larger if the crop is stressed, relatively small if the atmosphere is saturated or nearly saturated with water, and large. if the atmosphere is relatively dry while in windy conditions, r is small while in calm conditions it becomes large (Savage, 1998b).
Microclimatic Variations and Solar Radiation Dynamics 56
- Field data measurement, data handling procedures and computations
Under evaporation reference conditions, above the water-free crop surface, the P equation is used with a fixed canopy resistance of 70 s m" (Campbell, undated), and other variables (solar radiation, wind speed, vapor pressure deficit, and air temperature) would are measured at 2 m above the ground Surface resistivity (r.) derived empirically using the PM equation (Eq. 6.5) and actual evaporation measurements provides a general estimate In addition, it is convenient to have a site-specific reflection coefficient for use in simulation net radiation and solar irradiance, air temperature and wind speed measured at 2 m above the canopy, all of which are used in calculating actual evaporation. The PM equation has been successfully applied to many crop areas such as agricultural crops and pastures (Russell, 1980) and forest canopy (Campbell, undated).Microclimatic measurements of incident solar irradiance, air temperature, vapor pressure deficit, and wind speed were made in an attempt to derive the energy balance expressions that dominate a.
Microclimatic Variations and Solar Radiation Dynamics 58
Microclimatic Variations and Solar Radiation Dynamics 59
Microclimatic Variations and Solar Radiation Dynamics 60
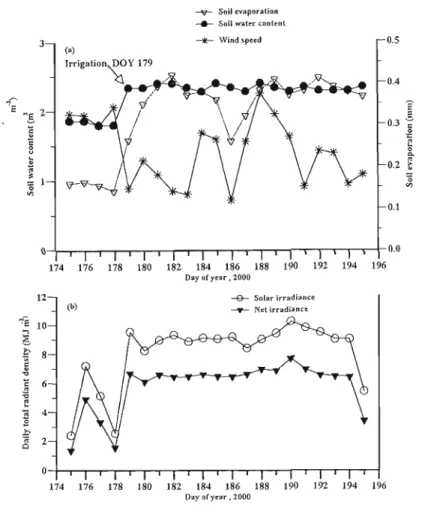
Fig.6.3 (a) Mean variations in microlysimeter soil evaporation (mm), soil water content (nr'm") were measured with MLlThetaProbe at 0.3 m depth and average wind speed (mS-I) for each day with sensor located 3 m above ground and 0 .5 m above the canopy;b) Daily total radiation density for DOY 174 through 196. Mean values were considered between 600 h and 1800 h determined with a pyranometer and net radiometers, respectively, both located 0.5 m above the banana canopy; 6.6, is usually on the psychrometric charts, the former by the slope of the saturation water vapor pressure at a specific temperature and the latter by the negative slope of the wet-bulb temperature lines.
Microclimatic Variations and Solar Radiation Dynamics 62
Microclimatic Variations and Solar Radiation Dynamics 63
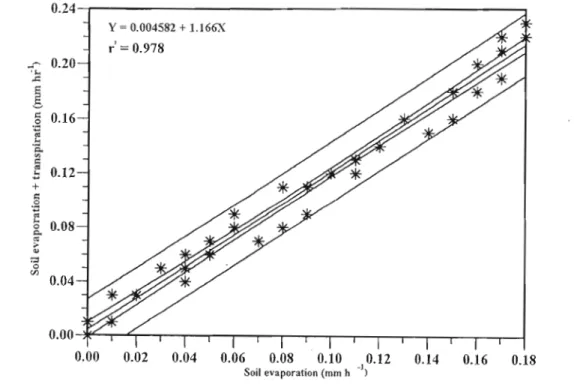
This is consistent with the fact that the reference evaporation must always be greater than the soil evaporation (Figure 6.7). Soil evaporation is subtracted from reference evaporation to calculate canopy transpiration (Savage, 2001, personal communication). The daily patterns (Figure 6.7) certainly match these trends. Therefore, increasing energy flux density trends would result in greater soil evaporation and canopy transpiration. Additionally, on DOY 245, there was an average bias of about 40% overestimation of calculated ET compared to soil microlysimeter measurements.
Microclimatic Variations and Solar Radiation Dynamics 67
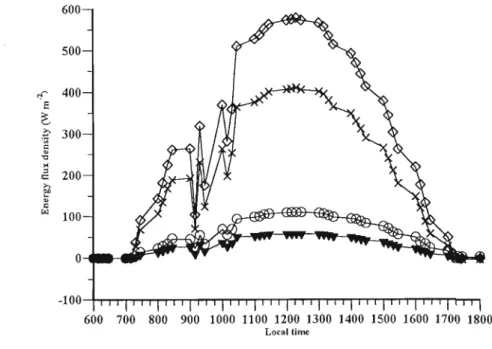
Figure 6.9 Diurnal changes in some components (net irradiance, latent heat flux density, and sensible heat flux density) of the truncated energy balance (left y-axis, Wm-Z) as a function of local time for DOY23 1.2000 for Inselele farm. Figure 6.10 Diurnal variation in sensible heat flux density and wind speed as a function of local time for DOY 231, 2000 for Inselele Farm.
Microclimatic Variations and Solar Radiation Dynamics 69
The trends in Figure 6.13 show that the difference between canopy and air temperature (Tdift) is sensitive to variations in wind speed, as it recorded the highest value (2.36 ms') when the wind speed was highest (2.22 m s' ). plays an important role in evapotranspiration, this appears to be a rather simplistic argument, since wind speed alone does not affect the removal of water vapor from the vegetative surface. It includes a combination of various parameters such as solar irradiance and water vapor pressure deficit, among others. However, the plot of the regression relationship between group average temperature and air temperature (Figure 6.15) showed quite a large scatter, probably due to differences in sensor specifications, since two different temperature sensors were used. Additionally, we can expect the cluster temperature as measured by the Hobo Temp data logger in the ziplock bag to be lower than the measured air temperature.
Microclimatic Variations and Solar Radiation Dynamics 72
Microclimatic Variations and Solar Radiation Dynamics 74
Microclimatic Variations and Solar Radiation Dynamics 75
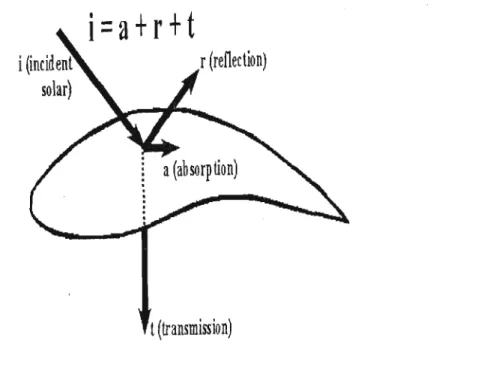
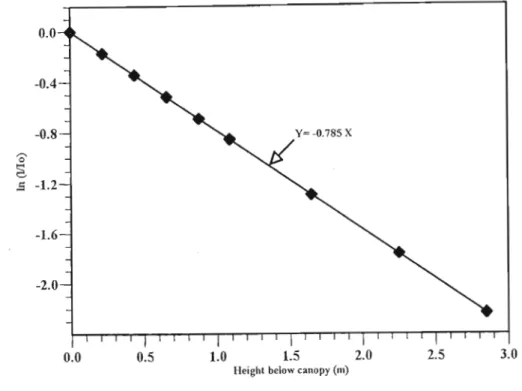
Beer'slaw describes the transmission of a parallel beam of monochromatic radiation through a homogeneous medium (Savage, 1998a). If a beam of monochromatic light passes through a very small distance, dl, of an absorbing medium, a certain fraction of the light will be absorbed. The fraction is independent of the intensity of the light, but is proportional to the density, p, of the absorbing medium and to the distance, dl. At a depth of,x (m) in a plant canopy, the incident radiation density or irradiance is equal to the product of the height, x, and the amount of incoming radiation,1. Beer's law (Eq.6.7) assumes that the loss or lowering of active flux density in a crop canopy layer, dx, is proportional to the thickness of the layer and to the amount of incoming radiation.
Microclimatic Variations and Solar Radiation Dynamics 77
Savage (1998a) reported that for a community with more or less horizontal leaves, the k value is between 0.7 and 1.0 m. This worker further stated that from theoretical considerations it would be desirable to reduce the absolute size ork. decrease, I will approach 10 and the solar radiation along the canopy profile will be more uniform. This scenario can be applicable in a banana stand, because there is often unwanted mutual shadowing on the pistons, which leads to reduction in incident light to the secondary canopy (Robinson and Nel, 1989).
Banana growth, morphology and phenology trends
- Introduction
Before treatments were introduced, baseline data showed that suckers showed a progressive linear increase in mean pseudostem height (Figure 7.2) with sampling time within the respective plots with very similar patterns, with no significant differences, P'?0.05. plots receiving the 20% irradiance treatment had a 1.42% higher mean height limit of mammals compared to the pooled mean of the other treatments, while plots receiving 70. Plant height and pseudostem girth were negatively affected reducing the incident irradiance to 70% and 40% of the unshaded control and further decreased when the incident irradiance was further reduced to 20% of the unshaded control (Fig. 7.4 c and b, respectively). Figure 7.4 (a) Variation of average plant LAl with time measured with a LAl 2000 canopy analyzer at sunset, 1830 hours; Progressive change of mean pseudostem girth and mean banana height with sampling days (b and c) during the vegetative phase.
Banana growth, morphology and phenology trends 85
- Flower emergence to harvest interval
Banana growth, morphology and phenology trends 86
Banana growth, morphology and phenology trends 87
Banana growth, morphology and phenology trends 88
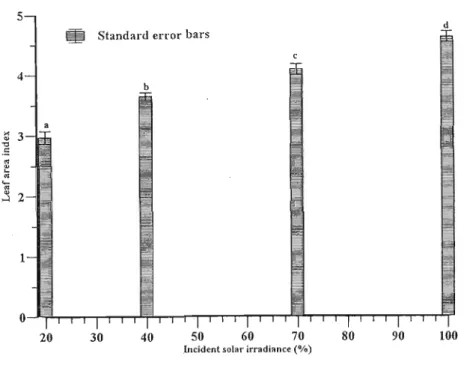
Fig.7.7 Variation of maximum leaf area index (L X W X 0.83X number of functional leaves in inflorescence -i-ground area) of cultivar 'Williams' with different irradiance levels in Insele!e ratoon plantation. Different letters represent statistically significant differences at P~0.0 5. Differences in these two findings can be attributed to variations in agroclimatic zones, cultivar variations, changes in radiation levels, and management conditions.
Banana growth, morphology and phenology trends 90
Banana growth, morphology and phenology trends 91
Banana growth, morphology and phenology trends 92
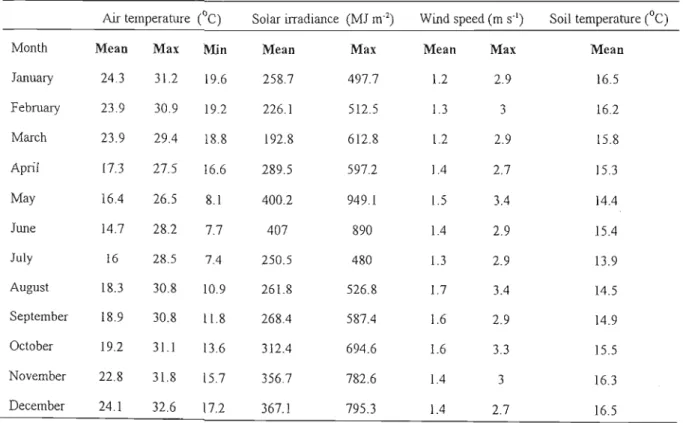
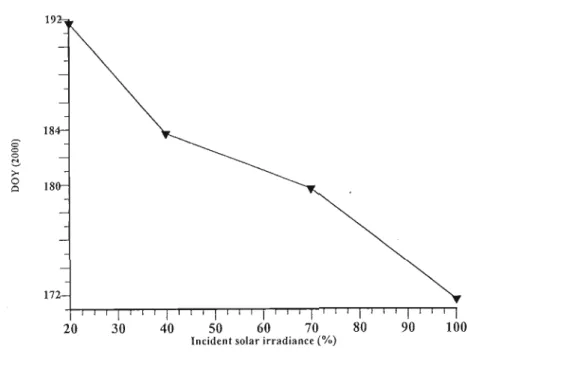
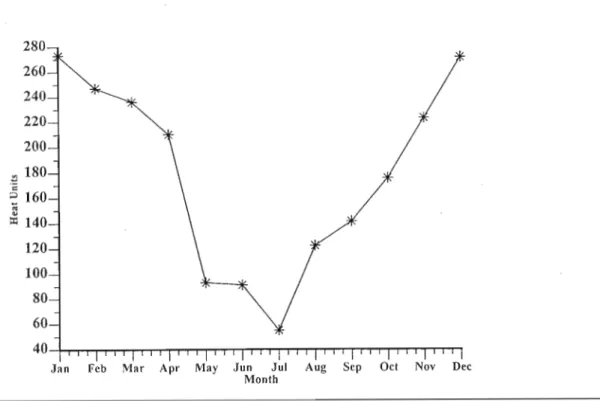
A comparison of the flowering date trends with the levels of incident irradiance (Fig. 7.1 0) showed an inverse relationship and had a very high negative correlation of 98.4% (Genstat, 1983). The lower level of incident radiation resulted in a delay in flowering dates as depicted in Fig. An assessment of heat units makes it possible to obtain a better cumulative comparison of the air temperature variations in the respective months of the year and how this affects the banana.
Banana growth, morphology and phenology trends 94
Plant density did not appear to be reduced in any of the plots, but would probably be affected in the second production cycle due to poor uptake initiation and slow uptake growth in densely shaded plots. Hands taken for grip and finger length showed no significant differences, P .cO.OS, between treatments and 20%. However, a level of interaction was observed in the plots of 70% and 40% irradiation relative to 100% irradiation, which showed significant differences, P.cO.OS. The length of the finger was observed in the densest shade with 20.
Banana growth, morphology and phenology trends 96
Banana growth, morphology and phenology trends 97
Conclusion and Recommendations
Conclusion and Recommendations for Future Research
- Conclusion
- Conclusion and Recommendations 99
- Conclusion and Recommendations 100
- Conclusion and Recommendations 101
- Conclusion and Recommendations 102
- Recommendations for future research
- Conclusion and Recommendations 103
A marked effect of reduced radiation on banana fruit morphology, phenology, growth and production was realized in this study. Responses to shading have also been reported for bananas grown under the canopy of nut palms (Balasimha, 1989) and these responses no doubt also become crucial. where banana cultivation is practiced under agroforestry conditions (Bonaparte, 1967). There was a decrease in leaf area, pseudostem height and girth (Figs. 7.4 and 7.5) and a delay in flowering dates (Fig. 7.10) especially under denser shade. (20% radiation). 100. These responses observed at all shade levels signal a level of stagnation due to the reduction of incident solar radiation. Reduced growth rate, shorter internodes, lower stem diameter and reduced total dry matter have also been reported for sweet potato in Trinidad (Lauraet al., 1986) and cocoa (Galyuonet al., 1994) grown under artificial shade. The findings in this study are consistent with those of Israel (1995) who observed a suppression of sucker growth in the understory of a very high density commercial plantation. A vital question in this study is whether these results are specific to the conditions in which this study was conducted, or whether they are valid across a wide range of settings. Therefore, the results of this study should be considered with caution, as the data correspond to a specific area, the Inselele farm in the south of KwaZulu-Natal.
21X DATALOGGER PROGRAM FOR INSELELE RESEARCH PROJECT 116
11 21X DATALOGGERPROGRAM FOR INSE LELE RESEARCH PROJECT 117
Baseline sucker height measurements