FORDA - Jurnal
Teks penuh
Gambar
Garis besar
Dokumen terkait
Owing to lack of the corresponding ground truth, in the experiment, just six rough classes are fixed to classify the test area, that is, buildings (and roads), forest areas, dense
The Six land use / land cover (LU/LC) classes were recognized based on change detection in the first level ( pixel-based classification ) to be distributed in the study area:
The study area was classified into six main classes like forest, water bodies, bush grasses, barren land snow and agricultural land in supervised classification
Thus, the analysis of our results suggests that every bare land and area covered by agricultural field is likely to be converted to forest cover (dense forest or light forest)
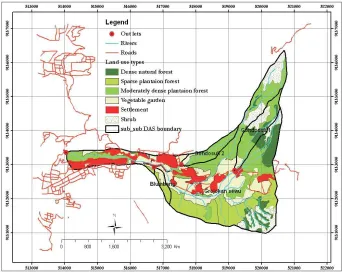
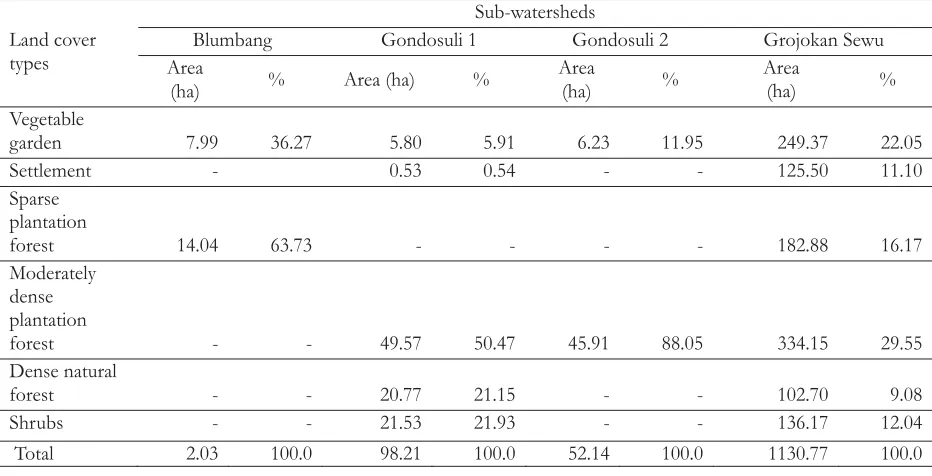
Forest land cover in this study dif- ferentiated the condition based on physi- cal parameters of the tree canopy clo- sure (Figure 4.B). From some of these statistics can be seen
The results from the land cover change analysis show that this regime shift form herbaceous wetland to forest is more evident in wetlands which were once converted into plantation
Dense canopy of alder and maple perhaps is one reason for the low number of species on the forest cover plantation compared to sequoia stand.. The result of Fallahchai and Hashemi 2012
The topographic maps included detail information of land use and land cover data, such as forest, agricultural both paddy field and dry~field , urban, settlement, tidal flats.. The
